Details
-
New Feature
-
Resolution: Done
-
 Major
Major
-
None
Description
TL;DR: Cluster Monitor should push its own alerts to Alertmanager, otherwise we can't get rich, descriptive alert messaging.
Currently we use Prometheus as a vehicle for delivering the Cluster Monitor's alerts - Prometheus scrapes it, stores the values, and sends an alert to Alertmanager if it matches one of our rules. This means that we get a lot for free - not just alerting, but also showing the data in Grafana without needing to use JSON API, plus Prom stores the history of the checker statuses, and uses very little space when doing so (just a couple bytes per sample).
The major limitation with this approach is that we are limited in what metadata we can carry - currently we store the cluster name/UUID, node/bucket details, and the check ID and name. This means that to get any more details, one needs to consult the Cluster Monitor UI.
We have done a good job of working around this by creating bespoke definitions for each checker's alert (see CMOS-190), meaning that each one has a descriptive remediation. The issue with this approach is that it doesn't scale - currently these rules all need to be written by hand. We could explore a code generation-based strategy to automatically create them. However, this still hasn't solved the fundamental problem - we can tell the user that something's gone wrong and how to fix it, but we can't tell them what specifically.
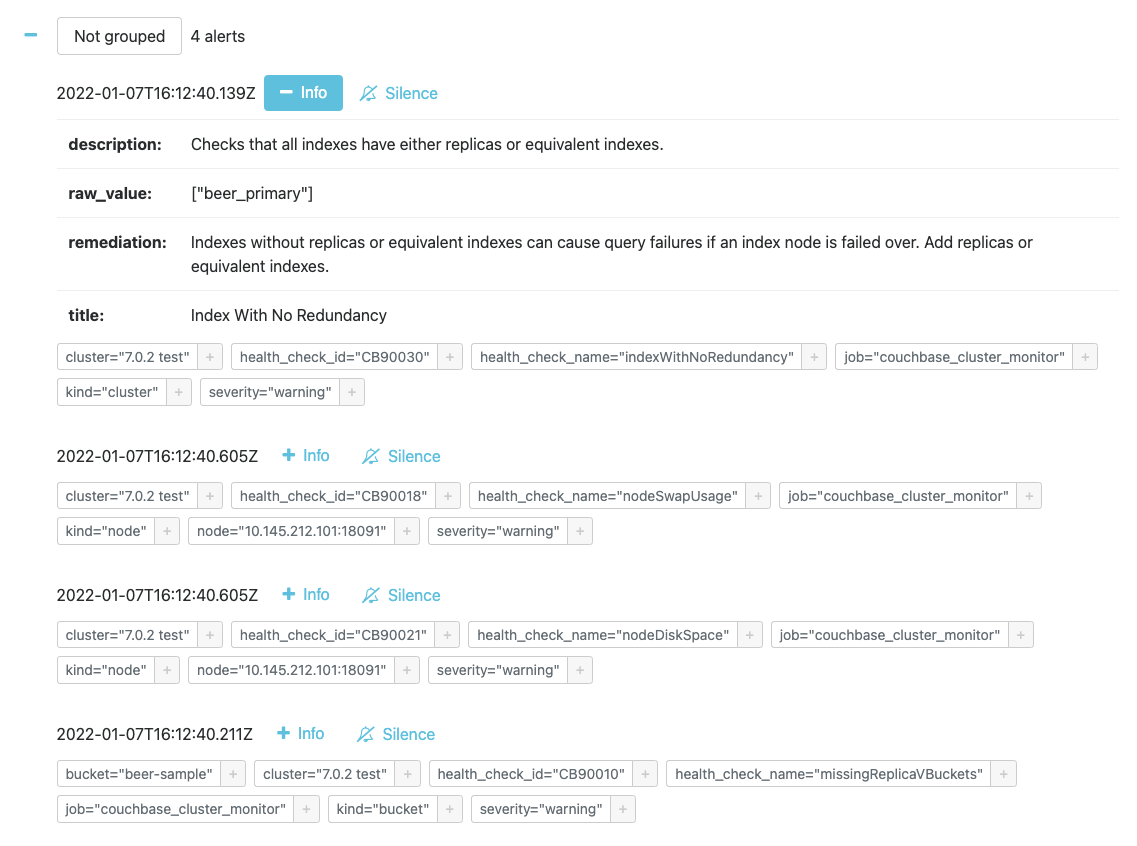
To take a concrete example, the index redundancy checker outputs the names of the indexes without redundancy, however this is not exposed to the user anywhere except for the Cluster Monitor UI - the user is told that some indexes don't have replicas, but they have no way of knowing which ones unless they check Cluster Monitor. Similarly, if we had an alert for blocked service ports, the only information conveyed in the alert and in Grafana would be that "node X cannot communicate with some other node on some port".
This is not a great user experience, as the responder has to switch from either Grafana or wherever they got the alert (Slack / email / PagerDuty etc.) to the Cluster Monitor UI (with its own set of credentials) and find the cause of the alert. This can be mitigated using deep linking, but the core problem still remains.
We could encode additional metadata about the checker result in the Prometheus metric - for example, have a label with the services with no redundancy or the blocked ports. The problem with this is that it introduces unbounded time series cardinality - or, to be precise, the time series cardinality goes from O(number of nodes × number of distinct checkers) to O(number of nodes × number of distinct checkers × number of distinct checker results) - and I can easily see the latter being a very big number. The Prometheus docs call this out as an anti-pattern:
CAUTION: Remember that every unique combination of key-value label pairs represents a new time series, which can dramatically increase the amount of data stored. Do not use labels to store dimensions with high cardinality (many different label values), such as user IDs, email addresses, or other unbounded sets of values.
Arguably we should be encoding the source information that would trigger the alert into Prometheus, instead of simply the result. In a sense, the Cluster Monitor would act as a "smart exporter" - translating key information from the Couchbase Server endpoints into a format Prometheus can understand, but not making a value judgement on the data. However, this would require essentially reworking Cluster Monitor from the ground up. Furthermore in many cases the emitted value would essentially be "0 good, 1 bad" which is not far from what we have today, albeit with more detailed labels. The bigger issue with this is that it constrains the amount of logic we can perform - instead of doing arbitrary processing on CBS data and outputting a value judgement, we would be limited to a) what can be represented as a float64 in Prometheus and b) what processing can be done on those float64s in PromQL. There is also the risk that this could cause high time series cardinality (e.g. the index redundancy checker would effectively need to output one time series per index). Finally, it would limit the utility of the Cluster Monitor as a standalone product for customers who do not use Prometheus. So I'm skeptical of this being a workable approach.
The approach that seems the most promising to me is to cut out the middleman and send our own alerts directly to Alertmanager. Alertmanager has a specified and documented API for this, including OpenAPI definitions. This would mean that we can encode whatever we like in the alert's labels and annotations, for example custom remediation strings, which solves the core problem while not increasing time series cardinality. Routing is still fully flexible, as they enter the Alertmaanger routing tree just like any other alert, meaning that customers can apply silences, inhibitions, and routing decisions as they wish, and alerts can be sent to any receiver that Alertmanager supports.
The biggest complication of this approach is that we need to know where the Alertmanager is, instead of simply exposing our metrics and letting Prometheus deal with it. Ideally this would be done via the CMOS-104 config service, however this is still feasible as a command line argument (and indeed should be, for the sake of stand-alone usability should that come to pass). We would need to be mindful that Alertmanager supports High Availability and so we would need to send our alerts to all the Alertmanagers all the time (and we would want to support things like SRV records for sevice discovery), however this should not be too complex (famous last words).
The area that this doesn't address is Grafana - the information we give there will still be limited to the service status, so we'd need to look at other approaches there. We need to be careful about information overload on the main dashboards, so I could see us adding a "health issue details" dashboard with the full data including descriptions and remediation strings, fed via JSON API from either Alertmanager or Cluster Monitor (preferably the former, so we can catch alerts triggered by Prometheus and Loki rules too).
Setting fixVersion=1.0 because this is a relatively major change, however it would be great to get it into 0.1 if we have spare bandwidth.