Details
-
Bug
-
Resolution: Unresolved
-
 Minor
Minor
-
5.0.0
-
Untriaged
-
-
No
Description
Build
5.0.0-2958
I was giving system test a try yesterday. Here's what I did :
1. Started with a single node - kv + fts, (8GB RAM, 4 cores, 500GB SSD)
2. created a bucket called "dumps" with 2GB RAM and value eviction
3. Loaded "companies" and "yelp" datasets - total of 6.4M docs, some as large as 86K(yelp-reviews)
4. Active resident ratio went as low as 0.02% when I started getting OOMs and hard OOM error after which I added 2 more kv+fts nodes(same config as the first node. Rebalance started at 3:37:23 PM Thu Jun 1, 2017
5. And changed value eviction to full eviction on "dumps" and increased bucket quota to 3GB.
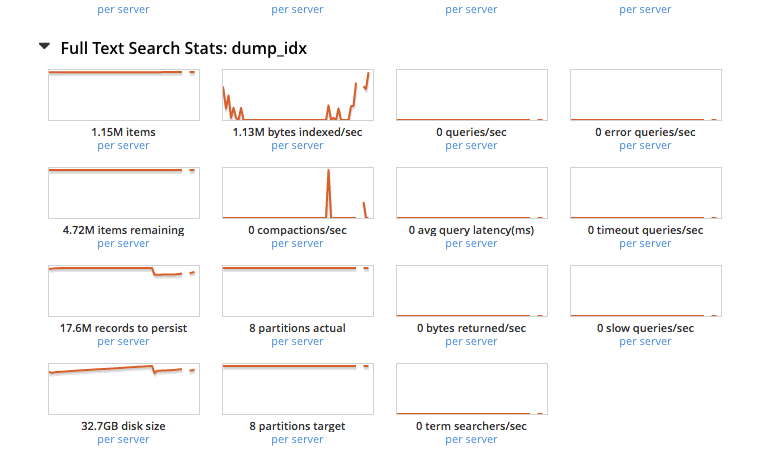
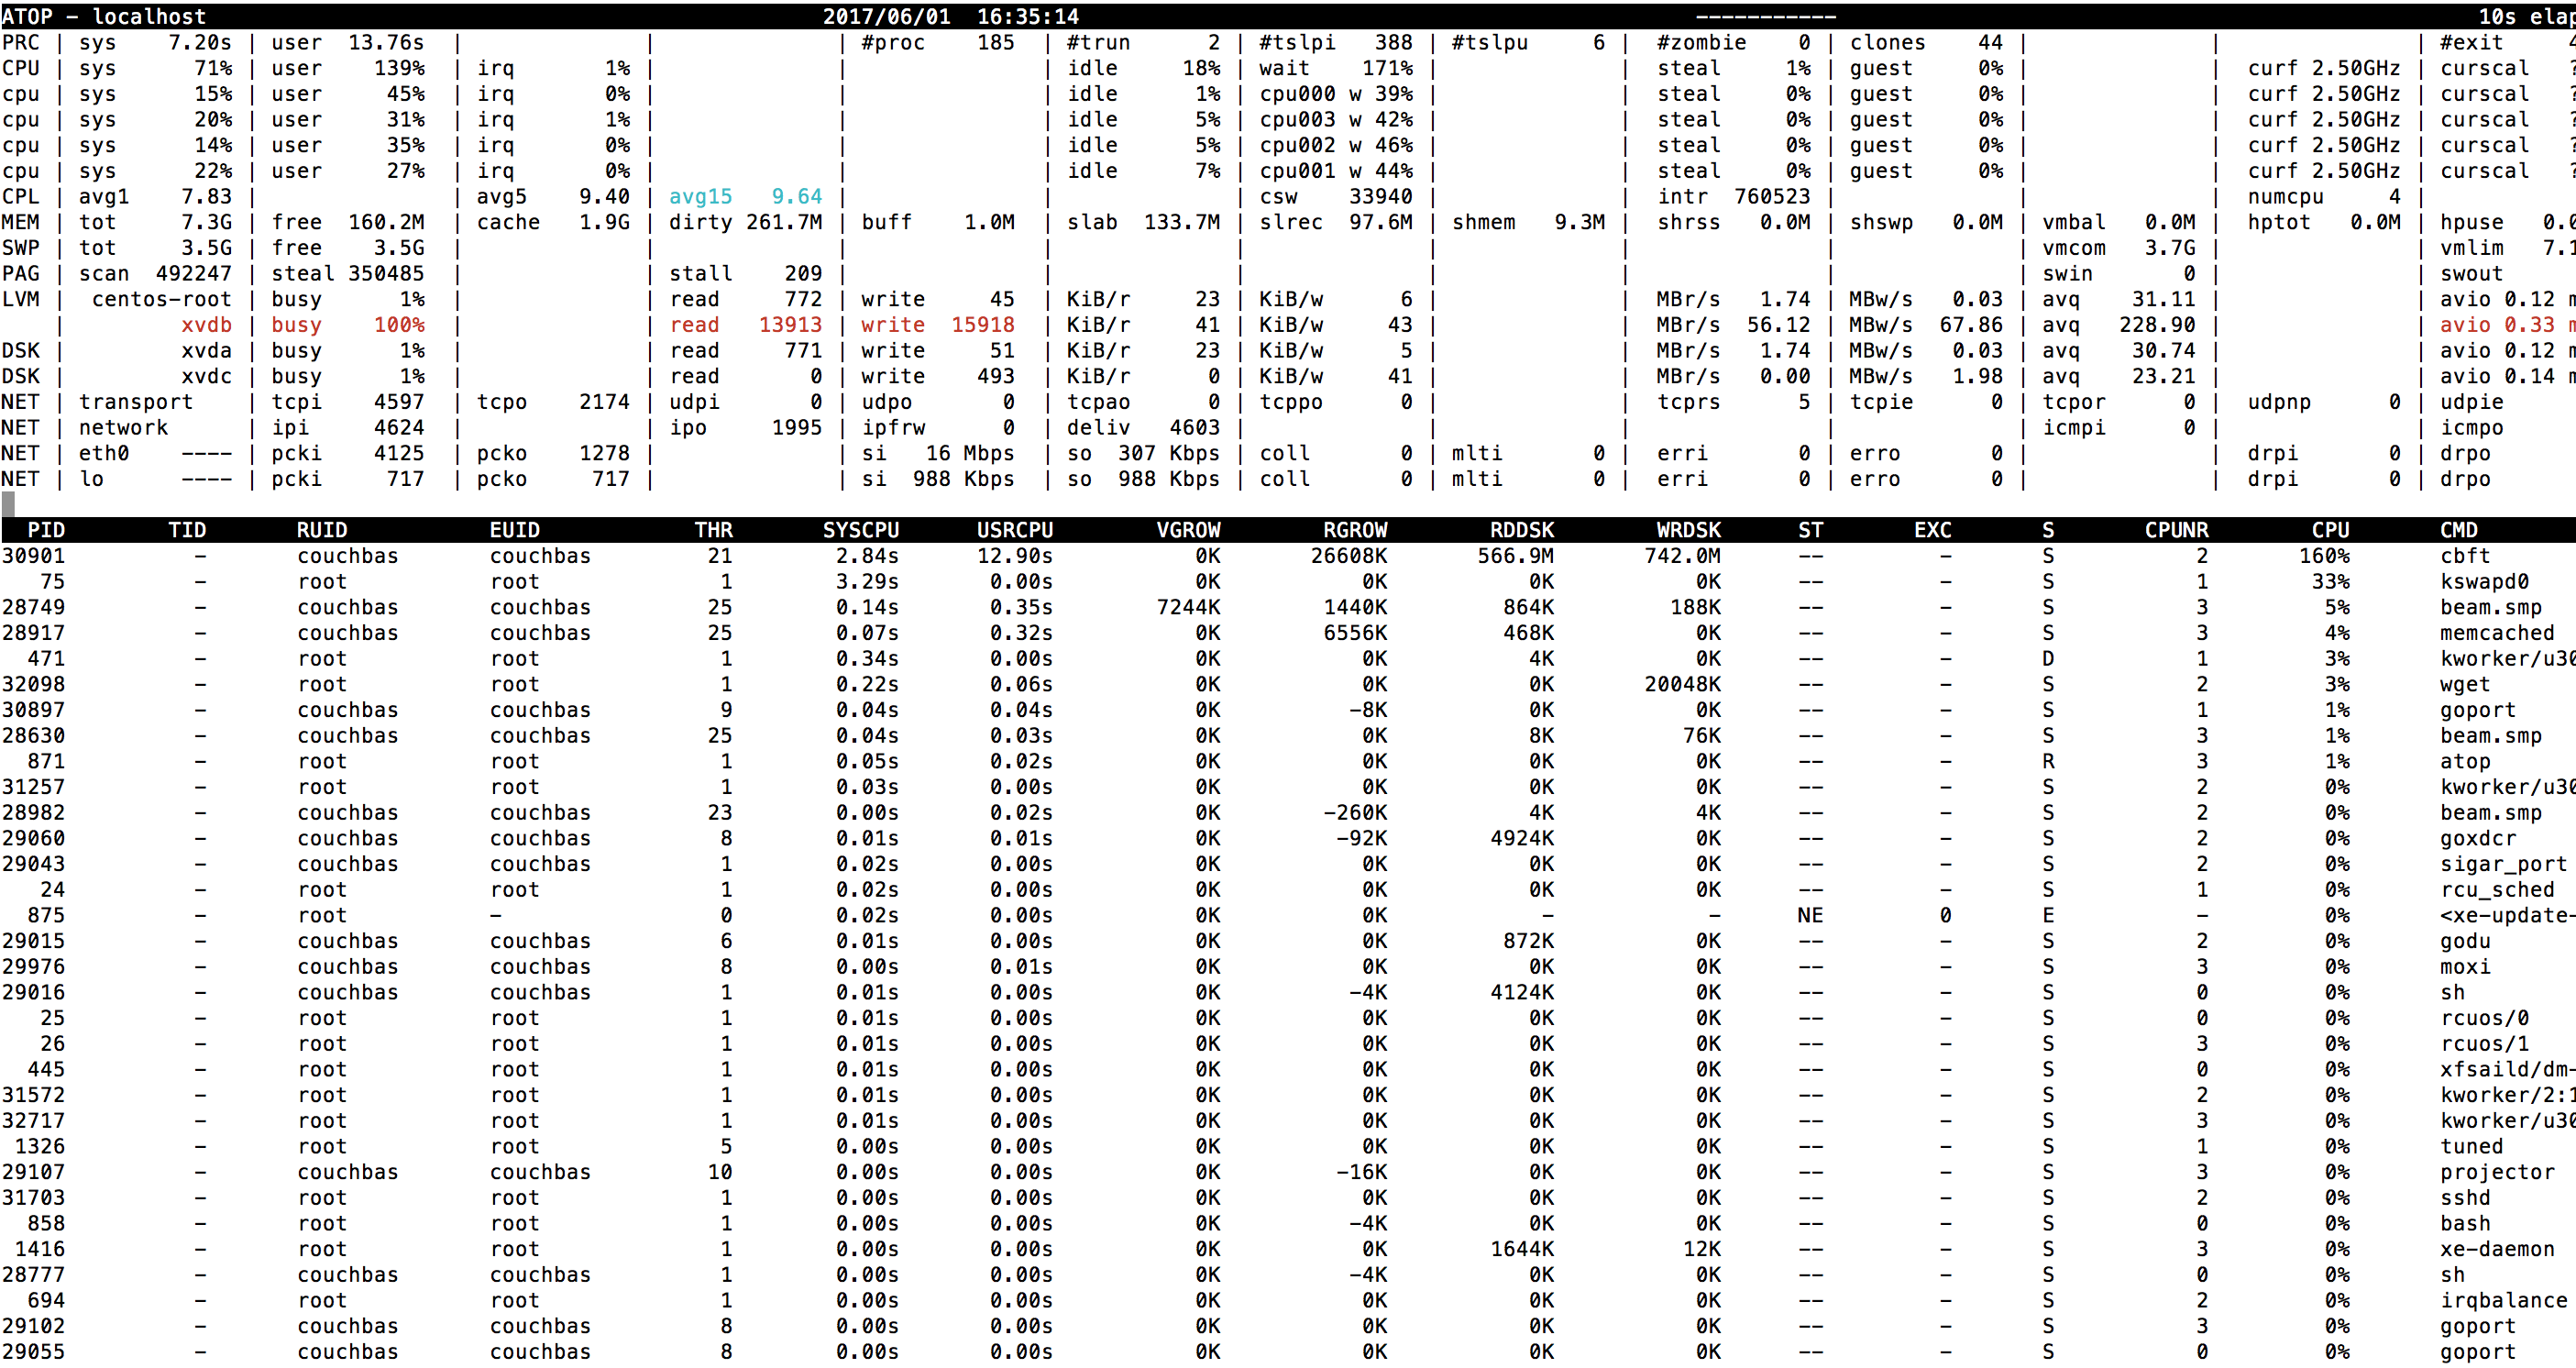
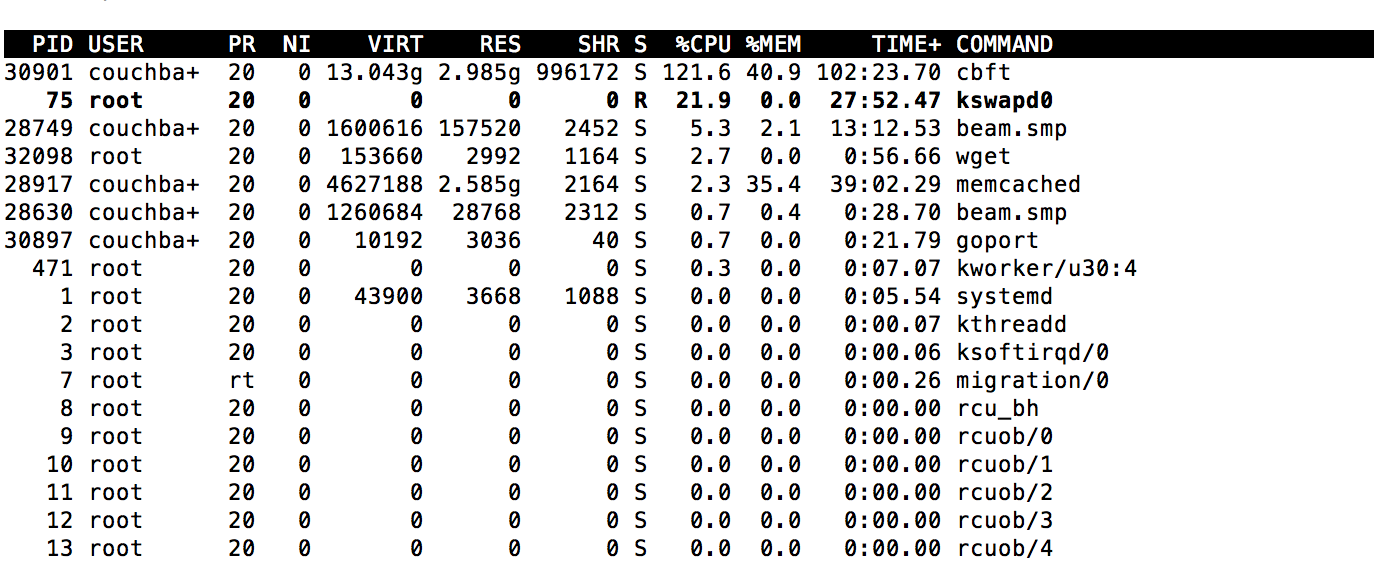
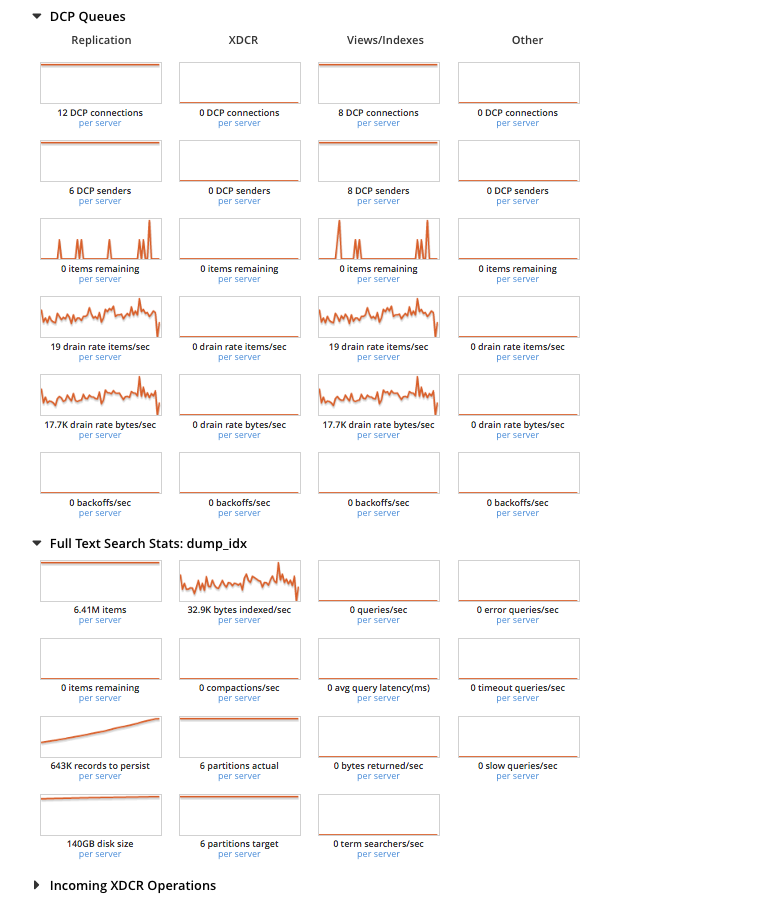
6. Loading completed and kv data was distributed among the nodes evenly and active resident ratio went up to 36.6% but rebalance was trudging along on the fts side and the pindexes on the first node were 6 and other two nodes had only 1 each. I did an atop on first node, please see attached screenshots showing very high virtual memory and disk usage. I collected first set of logs here -
http://supportal.couchbase.com/snapshot/e62520836c132d49d1f8c74ef31ee394%3A%3A1
===Checker results for '172.23.105.216'=== |
[info] Collection Time : 2017-06-02 18:41:06 |
[info] OS Name : Linux 3.10.0-327.22.2.el7.x86_64 |
[info] OS Version : CentOS Linux release 7.2.1511 (Core) |
[BAD] CB Version : 5.0.0-2958-enterprise - Unsupported build |
[info] CB Packages : couchbase-server-5.0.0-2958.x86_64 |
[info] CB Uptime : 20 hours, 43 minutes, 42 seconds |
[info] System Uptime : 1 day |
[ok] Installed CPUs : 4 |
[warn] Installed RAM : 7474 MB - less than recommended (16384 MB) |
[ok] Used RAM : 44.0% (3287 / 7474 MB) |
[info] Data Quota : Data Quota (3729 MB) 49.89% of Total RAM (7474 MB) |
[info] FTS Quota : FTS Quota (256 MB) 3.43% of Total RAM (7474 MB) |
[ok] Total Server Quota : Total Quota (3985 MB) 53.32% of Total RAM (7474 MB) |
(less than maximum of 80.00%) |
[ok] Erlang VM vsize : 1,567 MB |
[warn] Memcached vsize : 4,134 MB - greater than Data Quota: 3,729 MB. |
Possible memory problems.
|
[warn] Memcached Fragmentation: ??? (Attribute not found). Cannot check.
|
[ok] vm.swappiness : 0 (Recommended value) |
[ok] Swap Used : 0.00% |
[ok] Interface 'eth0' (172.23.105.216) failures: RX:0 / TX:0 |
[ok] Transparent Huge Pages: never
|
[warn] Slow operations : 86 - Last slow operation was at |
2017-06-02T01:24:50.757083-07:00 |
[info] Data Directory : (non-default) /data2 - ext4 - (/dev/xvdb1 493GB / 8% used) |
[warn] MDS Services : fts, kv - Only run 1 service per node in production - |
FTS is not supported
|
[warn] NS Stats Ticks : 9 instances found, showing the last 3 |
: 2017-06-01T22:41:34.195-07:00 (Collector: stats_collector) |
Dropped 9 ticks |
: 2017-06-01T22:41:34.188-07:00 (Collector: |
global_stats_collector) Dropped 9 ticks |
: 2017-06-01T22:40:37.053-07:00 (Collector: stats_collector) |
Dropped 10 ticks |
|
7. I checked back at 8:30pm(5 hrs later) and rebalance was only 93% complete
8. It appears from logs that rebalance completed successfully at 1:56:30 AM Fri Jun 2, 2017 (10.5 hrs in all).
9. Indexing completed 100% by 11:00 AM(9 hrs later). Indexing rate had lonely spikes and was totally dependent on compaction, i.e,it appeared we were not indexing a steady stream of data at any point in time.
I'm filing 3 issues with the same description for addressing -
1. Rebalance slowness - taking 10.5 hrs
2. Indexing slowness - sporadic ingestion (should probably rerun with the new compaction default settings?)
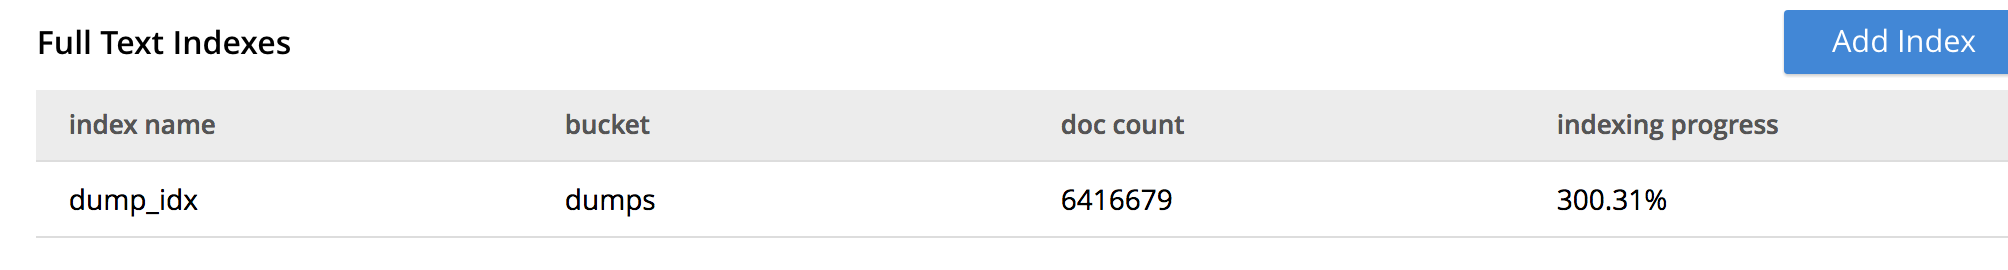
3. Indexing progress showing 300.39%
Please also take a look at the logs collected today
https://s3.amazonaws.com/cb-engineering/ArunaP/collectinfo-2017-06-02T183909-ns_1%40172.23.105.216.zip
https://s3.amazonaws.com/cb-engineering/ArunaP/collectinfo-2017-06-02T183909-ns_1%40172.23.105.224.zip
https://s3.amazonaws.com/cb-engineering/ArunaP/collectinfo-2017-06-02T183909-ns_1%40172.23.106.120.zip