Details
-
Bug
-
Resolution: Fixed
-
 Critical
-
5.5.0
-
Untriaged
-
Unknown
Description
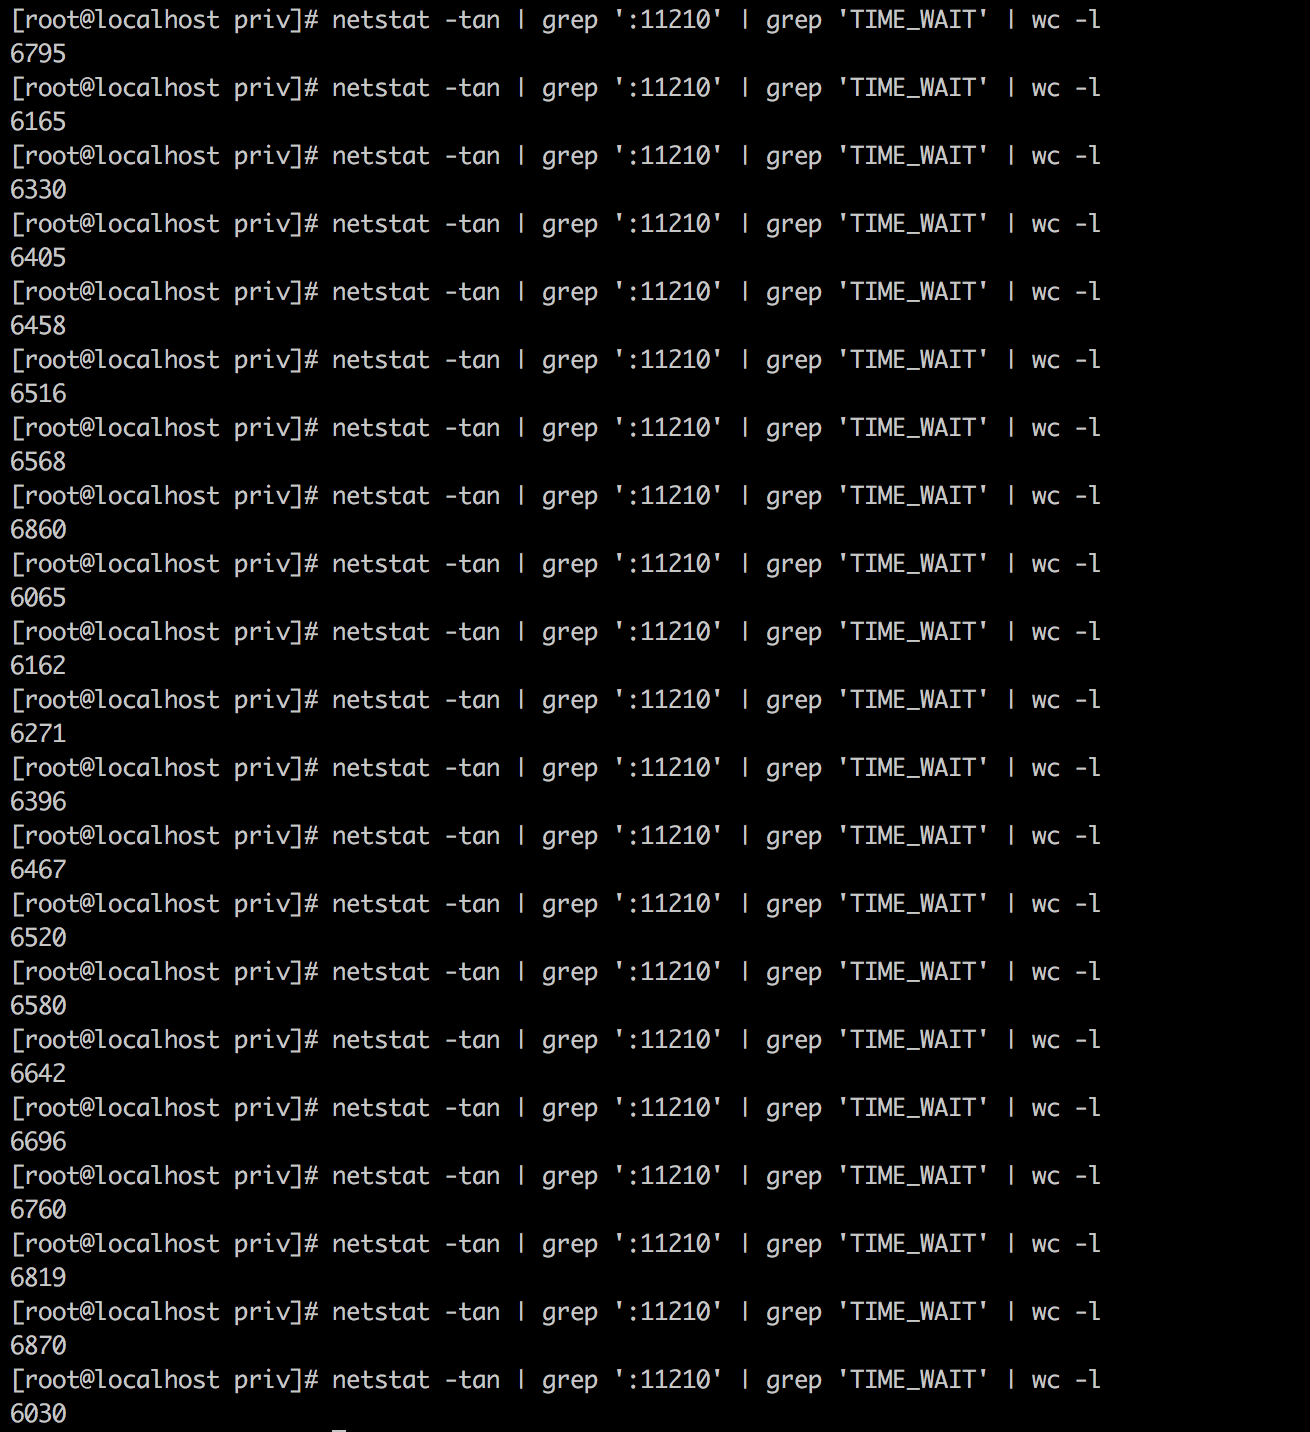
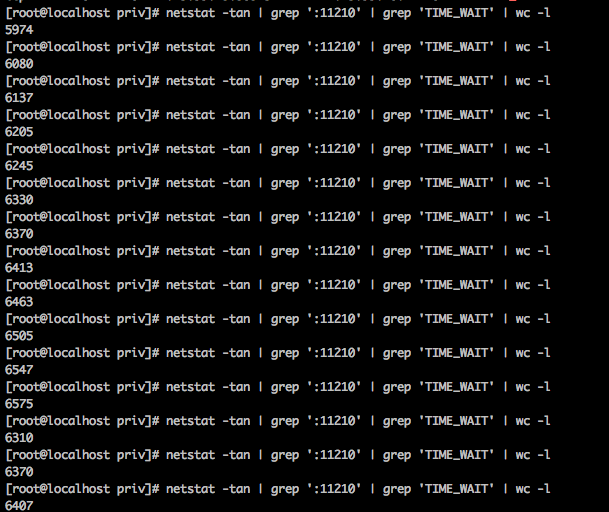
As reported in this comment: https://issues.couchbase.com/browse/MB-28710?focusedCommentId=261403&page=com.atlassian.jira.plugin.system.issuetabpanels:comment-tabpanel#comment-261403, running of system test leaves thousands of sockets in the TIME_WAIT state. From nutshell on node .99.25:
Established TIME_WAIT Total
|
TCP Connections in State Conns Hosts Conns Hosts Conns Hosts SendQ (Bytes)
|
--------------------------------------------------------------------------------
|
Port 8091 (cluster mgmt) 23 1 5 1 29 2 0
|
Port 8093 (N1QL) 473 2 0 0 505 3 0
|
Port 18091 (cluster mgmt SSL) 0 0 0 0 1 1 0
|
Port 18093 (N1QL SSL) 0 0 0 0 1 1 0
|
==Total== 1021 17 7764 7 8839 19 354
|
Looking in couchbase.log we see:
Proto Recv-Q Send-Q Local Address Foreign Address State PID/Program name
|
tcp 0 0 172.23.99.25:41411 172.23.97.238:11210 TIME_WAIT -
|
tcp 0 0 172.23.99.25:56182 172.23.99.21:11210 TIME_WAIT -
|
tcp 0 0 172.23.99.25:33245 172.23.97.239:11210 TIME_WAIT -
|
tcp 0 0 172.23.99.25:58658 172.23.97.239:11210 TIME_WAIT -
|
tcp 0 0 172.23.99.25:60702 172.23.99.21:11210 TIME_WAIT -
|
tcp 0 0 172.23.99.25:49630 172.23.108.104:11210 TIME_WAIT -
|
tcp 0 0 172.23.99.25:52370 172.23.99.22:11210 TIME_WAIT -
|
tcp 0 0 172.23.99.25:52947 172.23.99.22:11210 TIME_WAIT -
|
tcp 0 0 172.23.99.25:42461 172.23.97.238:11210 TIME_WAIT -
|
tcp 0 0 172.23.99.25:48095 172.23.99.22:11210 TIME_WAIT -
|
tcp 0 0 172.23.99.25:58853 172.23.97.239:11210 TIME_WAIT -
|
tcp 0 0 172.23.99.25:48984 172.23.108.104:11210 TIME_WAIT -
|
tcp 0 0 172.23.99.25:42261 172.23.97.238:11210 TIME_WAIT -
|
...
|
Since these are outbound connections from .25 to the memcached port on other nodes it seems that these connections have to be query connections as query is the only service running on this node and ns_server always connections to 11209. It seems wrong that we have so many connections getting closed so quickly that we end up with an enormous number of connections in this state.
My recommendation is that in addition to looking at what's happening between cbq-engine and memcached, we should also look at the queries that are running (we should connect with the QE guys on this) and figure out if there's something pathological about the workload.
Full logs for test, including for .25.
https://s3.amazonaws.com/bugdb/jira/mar21/collectinfo-2018-03-21T155904-ns_1%40172.23.99.25.zip
https://s3.amazonaws.com/bugdb/jira/mar21/collectinfo-2018-03-21T155904-ns_1%40172.23.106.188.zip
https://s3.amazonaws.com/bugdb/jira/mar21/collectinfo-2018-03-21T155904-ns_1%40172.23.108.103.zip
https://s3.amazonaws.com/bugdb/jira/mar21/collectinfo-2018-03-21T155904-ns_1%40172.23.108.104.zip
https://s3.amazonaws.com/bugdb/jira/mar21/collectinfo-2018-03-21T155904-ns_1%40172.23.96.56.zip
https://s3.amazonaws.com/bugdb/jira/mar21/collectinfo-2018-03-21T155904-ns_1%40172.23.96.6.zip
https://s3.amazonaws.com/bugdb/jira/mar21/collectinfo-2018-03-21T155904-ns_1%40172.23.97.238.zip
https://s3.amazonaws.com/bugdb/jira/mar21/collectinfo-2018-03-21T155904-ns_1%40172.23.97.239.zip
https://s3.amazonaws.com/bugdb/jira/mar21/collectinfo-2018-03-21T155904-ns_1%40172.23.97.242.zip
https://s3.amazonaws.com/bugdb/jira/mar21/collectinfo-2018-03-21T155904-ns_1%40172.23.99.20.zip
https://s3.amazonaws.com/bugdb/jira/mar21/collectinfo-2018-03-21T155904-ns_1%40172.23.99.21.zip
https://s3.amazonaws.com/bugdb/jira/mar21/collectinfo-2018-03-21T155904-ns_1%40172.23.99.22.zip