Details
-
Bug
-
Resolution: Fixed
-
 Critical
-
6.5.0
-
ares cluster, weekly tests
-
Untriaged
-
Yes
Description
the MB-32061 fix is the following change:
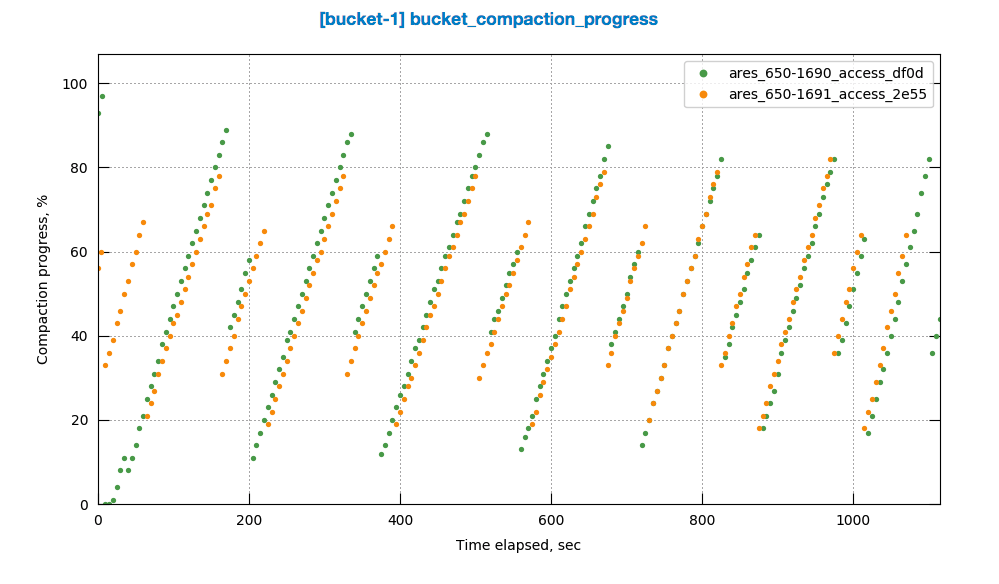
Build couchbase-server-6.5.0-1691 contains kv_engine commit 54d4e73 with commit message: MB-32061: Lower spdlog buffer size
which resulted about 3% drop in max throughput (pillowfight test)
cbc-pillowfight, 2 nodes, 50/50 R/W:
2.55M ops/sec vs 2.50M ops/sec average on build 6.5.0-1691
logs and reports:
6.5.0-1691: http://perf.jenkins.couchbase.com/job/ares/9090/console
6.5.0-1690: http://perf.jenkins.couchbase.com/job/ares/9091/console
cpu profiles attached
Attachments
Issue Links
| For Gerrit Dashboard: MB-32388 | ||||||
|---|---|---|---|---|---|---|
| # | Subject | Branch | Project | Status | CR | V |
| 103976,2 | MB-32388: Create toy build post regression | master | manifest | Status: MERGED | +2 | +1 |