Details
-
Bug
-
Resolution: Fixed
-
 Critical
-
5.5.0, 5.5.1, 5.5.2, 5.5.3, 5.5.4, 5.5.5, 5.5.6, 6.0.0, 6.0.1, 6.0.2, 6.0.3
-
Untriaged
-
Yes
Description
There is a regression introduced in Couchbase Server 5.5.0 through the addition of MB-16737, causing view queries to hang for a very long time intermittently.
Steps to reproduce
- Create a multi node cluster (I used a 4 node vagrant cluster) running Data on all nodes.
- Create a bucket and load it bucket with json documents (I loaded it with ~500,000), e.g.:
/opt/couchbase/bin/cbc pillowfight -U "couchbase://localhost/test" -u Administrator -P password -J -I 500000 --populate-only - Create a view with complex array keys and a reduce function, it is not important how complex or what the reduce actually does, the key aspect is that each node has to spend a reasonable amount of time preparing the results for the merge query.
For example (this is contrived to aggravate the problematic behavior):
Mapfunction (doc, meta) {for (var i=0; i<100; i++) {var l= [];for (var j=0; j<10; j++) {l.push(j*i);}emit(l, Math.random());}}Reduce
_stats - Once the index is built, query the index in a loop using a high group_level, for example:
{ while true; do date 1>&2; time curl -sS -u Administrator:password 'http://10.143.192.101:8092/test/_design/testy/_view/testy?stale=ok&inclusive_end=true&skip=0&group_level=5' ; done } > /dev/null
Expected Behavior
This query loop runs successfully forever (well not forever, but you get the idea) with reasonably consistent response times.
Actual Behavior
After 60 seconds, the view query becomes 'stuck' for a while, once this completes (with errors), the other queries are fast again for another 60 seconds or so, then the cycle repeats.
For example:
Fri Nov 29 03:18:03 PST 2019
|
real 0m0.936s
|
user 0m0.000s
|
sys 0m0.004s
|
|
|
...
|
|
|
Fri Nov 29 03:19:01 PST 2019
|
real 0m0.975s
|
user 0m0.004s
|
sys 0m0.000s
|
|
|
Fri Nov 29 03:19:02 PST 2019
|
real 1m0.313s
|
user 0m0.004s
|
sys 0m0.000s
|
|
|
Fri Nov 29 03:20:02 PST 2019
|
real 0m1.001s
|
user 0m0.000s
|
sys 0m0.004s
|
Investigation
From a process dump on the view engine being queried, I can see that it is stuck waiting for the results from the merge call to the other nodes in the cluster, in this example for node 10.143.192.102:
{backtrace,
|
[<<"Program counter: 0x00007f74e8735048 (lhttpc:get_body_part/2 + 56)">>,
|
<<"CP: 0x0000000000000000 (invalid)">>,<<"arity = 0">>,<<>>,
|
<<"0x00007f74c11c4e30 Return addr 0x00007f74caf8cc10 (couch_index_merger:next_chunk/2 + 40)">>,
|
<<"y(0) 60000">>,<<"y(1) <0.17011.11>">>,<<>>,
|
<<"0x00007f74c11c4e48 Return addr 0x00007f74caf92228 (couch_http_view_streamer:next_streamer_state/2 + 232)">>,
|
<<>>,
|
<<"0x00007f74c11c4e50 Return addr 0x00007f74caf91cd8 (couch_http_view_streamer:stream_loop/4 + 112)">>,
|
<<"y(0) #Fun<couch_index_merger.16.2253377>">>,
|
<<"y(1) <<0 bytes>>">>,<<>>,
|
<<"0x00007f74c11c4e68 Return addr 0x00007f74caf91c10 (couch_http_view_streamer:parse/3 + 272)">>,
|
<<"y(0) []">>,<<"y(1) <<119 bytes>>">>,
|
<<"y(2) #Fun<couch_index_merger.16.2253377>">>,
|
<<"y(3) <0.17004.11>">>,<<"y(4) <<0 bytes>>">>,<<>>,
|
<<"0x00007f74c11c4e98 Return addr 0x00007f74caf8b220 (couch_index_merger:run_http_index_folder/5 + 1024)">>,
|
<<>>,
|
<<"0x00007f74c11c4ea0 Return addr 0x00007f74caf8a908 (couch_index_merger:http_index_folder/5 + 304)">>,
|
<<"y(0) Catch 0x00007f74caf8b338 (couch_index_merger:run_http_index_folder/5 + 1304)">>,
|
<<"y(1) Catch 0x00007f74caf8b500 (couch_index_merger:run_http_index_folder/5 + 1760)">>,
|
<<"y(2) []">>,<<"y(3) []">>,<<"y(4) []">>,
|
<<"y(5) <0.17004.11>">>,
|
<<"(6) \"http://%40ns_server:a728b878680ed4605cb597a67c98a8e09372963eac710802bf7d1e982628ff97@10.143.192.102:8092/_view_">>,
|
<<"y(7) []">>,<<>>,
|
<<"0x00007f74c11c4ee8 Return addr 0x000000000089d2f8 (<terminate process normally>)">>,
|
<<"y(0) Catch 0x00007f74caf8a928 (couch_index_merger:http_index_folder/5 + 336)">>,
|
<<"y(1) Catch 0x00007f74caf8ab20 (couch_index_merger:http_index_folder/5 + 840)">>,
|
<<"y(2) []">>,<<"y(3) []">>,
|
<<"(4) {index_merge,[{set_view_spec,<<4 bytes>>,<<13 bytes>>,<<5 bytes>>,[0,1,2,3,4,5,6,7,8,9,10,11,12,13,14,15,16,17,1">>,
|
<<"y(5) []">>,<<"y(6) []">>,<<>>]},
|
...
|
{messages,
|
[<<"{response,<0.17011.11>,{error,connection_closed}}">>,
|
<<"{ok,#Ref<0.0.79.74304>}">>]},
|
{message_queue_len,2},
|
...
|
{current_location,
|
{lhttpc,get_body_part,2,
|
[{file,
|
"/home/couchbase/jenkins/workspace/couchbase-server-unix/couchdb/src/lhttpc/lhttpc.erl"},
|
{line,600}]}},
|
{dictionary,
|
[{from_url,
|
<<"http://%40ns_server:a728b878680ed4605cb597a67c98a8e09372963eac710802bf7d1e982628ff97@10.143.192.102:8092/_view_merge/">>},
|
{streamer_pid,<12402.17011.11>},
|
{queue_ref,#Ref<12402.0.79.74304>}]}]},
|
What's interesting is that it seems to waiting for results from the other node, but it actually has received
{error,connection_closed}in the process' message inbox, indicating that the connection was closed, yet for some reason it's still waiting.
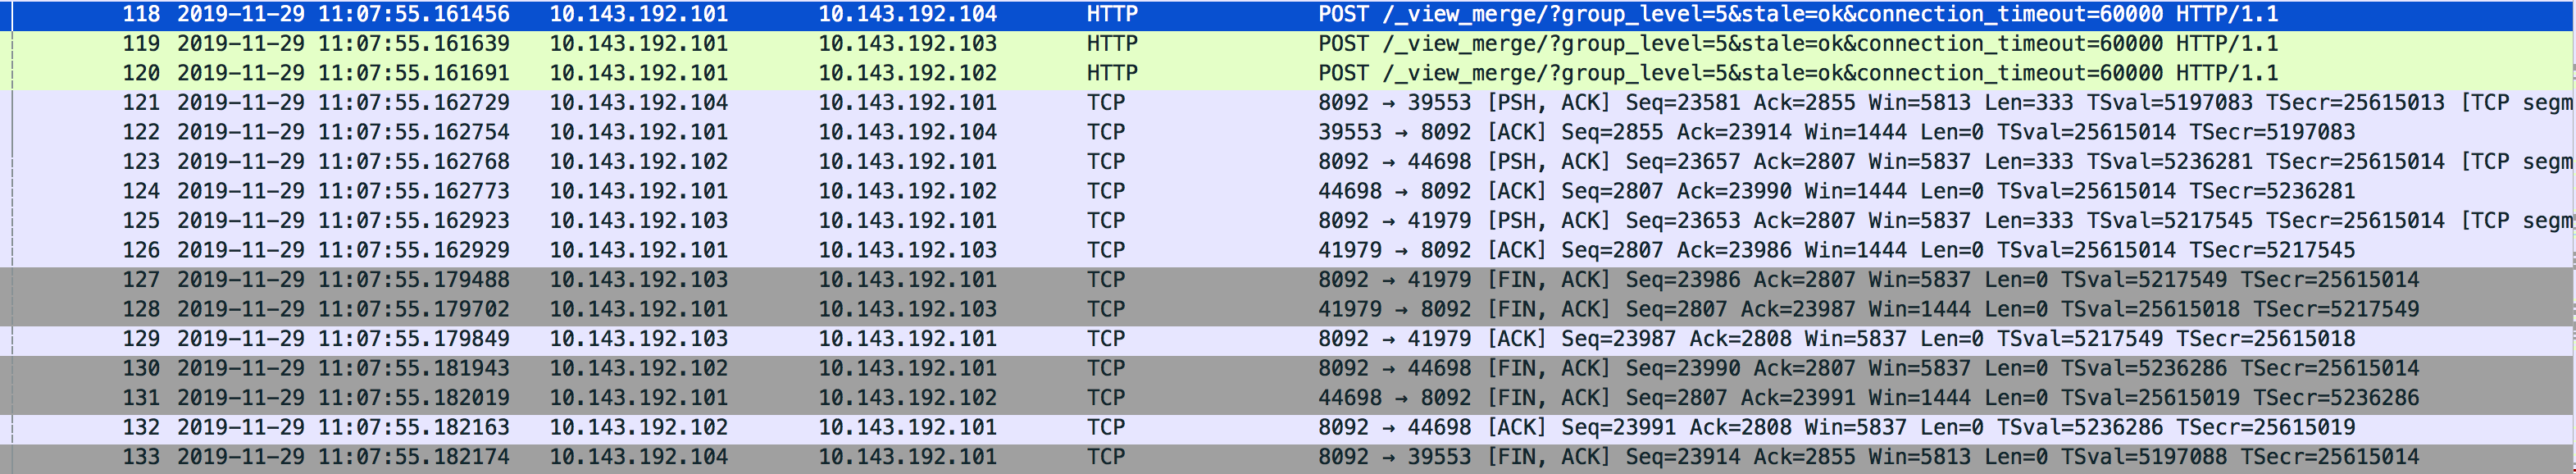
Based on this analysis, I took a tcpdump on port 8092 to see what the network traffic was like at the time, this is attached as mb-37100.pcap![]() .
.
We can see that eventually the view query returned with a partial results set, showing connection_closed errors:
"errors":[
|
{"from":"10.143.192.103:8092","reason":"connection_closed"},
|
{"from":"10.143.192.102:8092","reason":"connection_closed"},
|
{"from":"10.143.192.104:8092","reason":"connection_closed"}
|
]
|
From the pcap, we can also see that the connections to the other data nodes were terminated ~200ms after the call to /_view_merge (green packets are the HTTP call, grey packets are the FIN, ACK closing the connection):

This then causes the result set to be incomplete, as the primary view node did not receive the full result set from the nodes it is scatter-gathering from.
From the pcap we can also see that these connection closes happened approximately 60 seconds after the initial view query:
[Timestamps]
|
[Time since first frame in this TCP stream: 59.413167000 seconds]
|
[Time since previous frame in this TCP stream: 0.000075000 seconds]
|
Repeating the same test over and over shows a similar pattern, where the connections are closed ~60 seconds after they were opened.
Digging deeper, this is because the view engine is re-using the same TCP connections to perform multiple /_view_merge calls (which is sensible, as this is efficient) and as a result of the changes added in MB-16737 these connections are being closed after the default internal HTTP timeout which is 60000 milliseconds - http://src.couchbase.org/source/xref/6.0.1/couchdb/src/couch_index_merger/src/couch_index_merger.erl#576-578.
We will need to fix this within the view engine to not close sockets due to a timeout if they have successfully served a HTTP call.
Workaround
If you are able to within your application (SDKs such as Java cannot set this) you can set a custom connection_timeout value as part of the view query.
If you set this to a very high value for all of your view queries then this mitigates the impact as it takes a lot longer for the inter-node view connections to be closed, so rather than hanging a query every minute, you could change it a much higher value.
For example to set it to 1 day:
http://10.143.192.101:8092/test/_design/testy/_view/testy?stale=ok&inclusive_end=true&skip=0&group_level=5&connection_timeout=86400
|
This however is not a very efficient workaround, as if there are other queries not using a high connection_timeout value, it will still affect the other connections that are using the higher value.