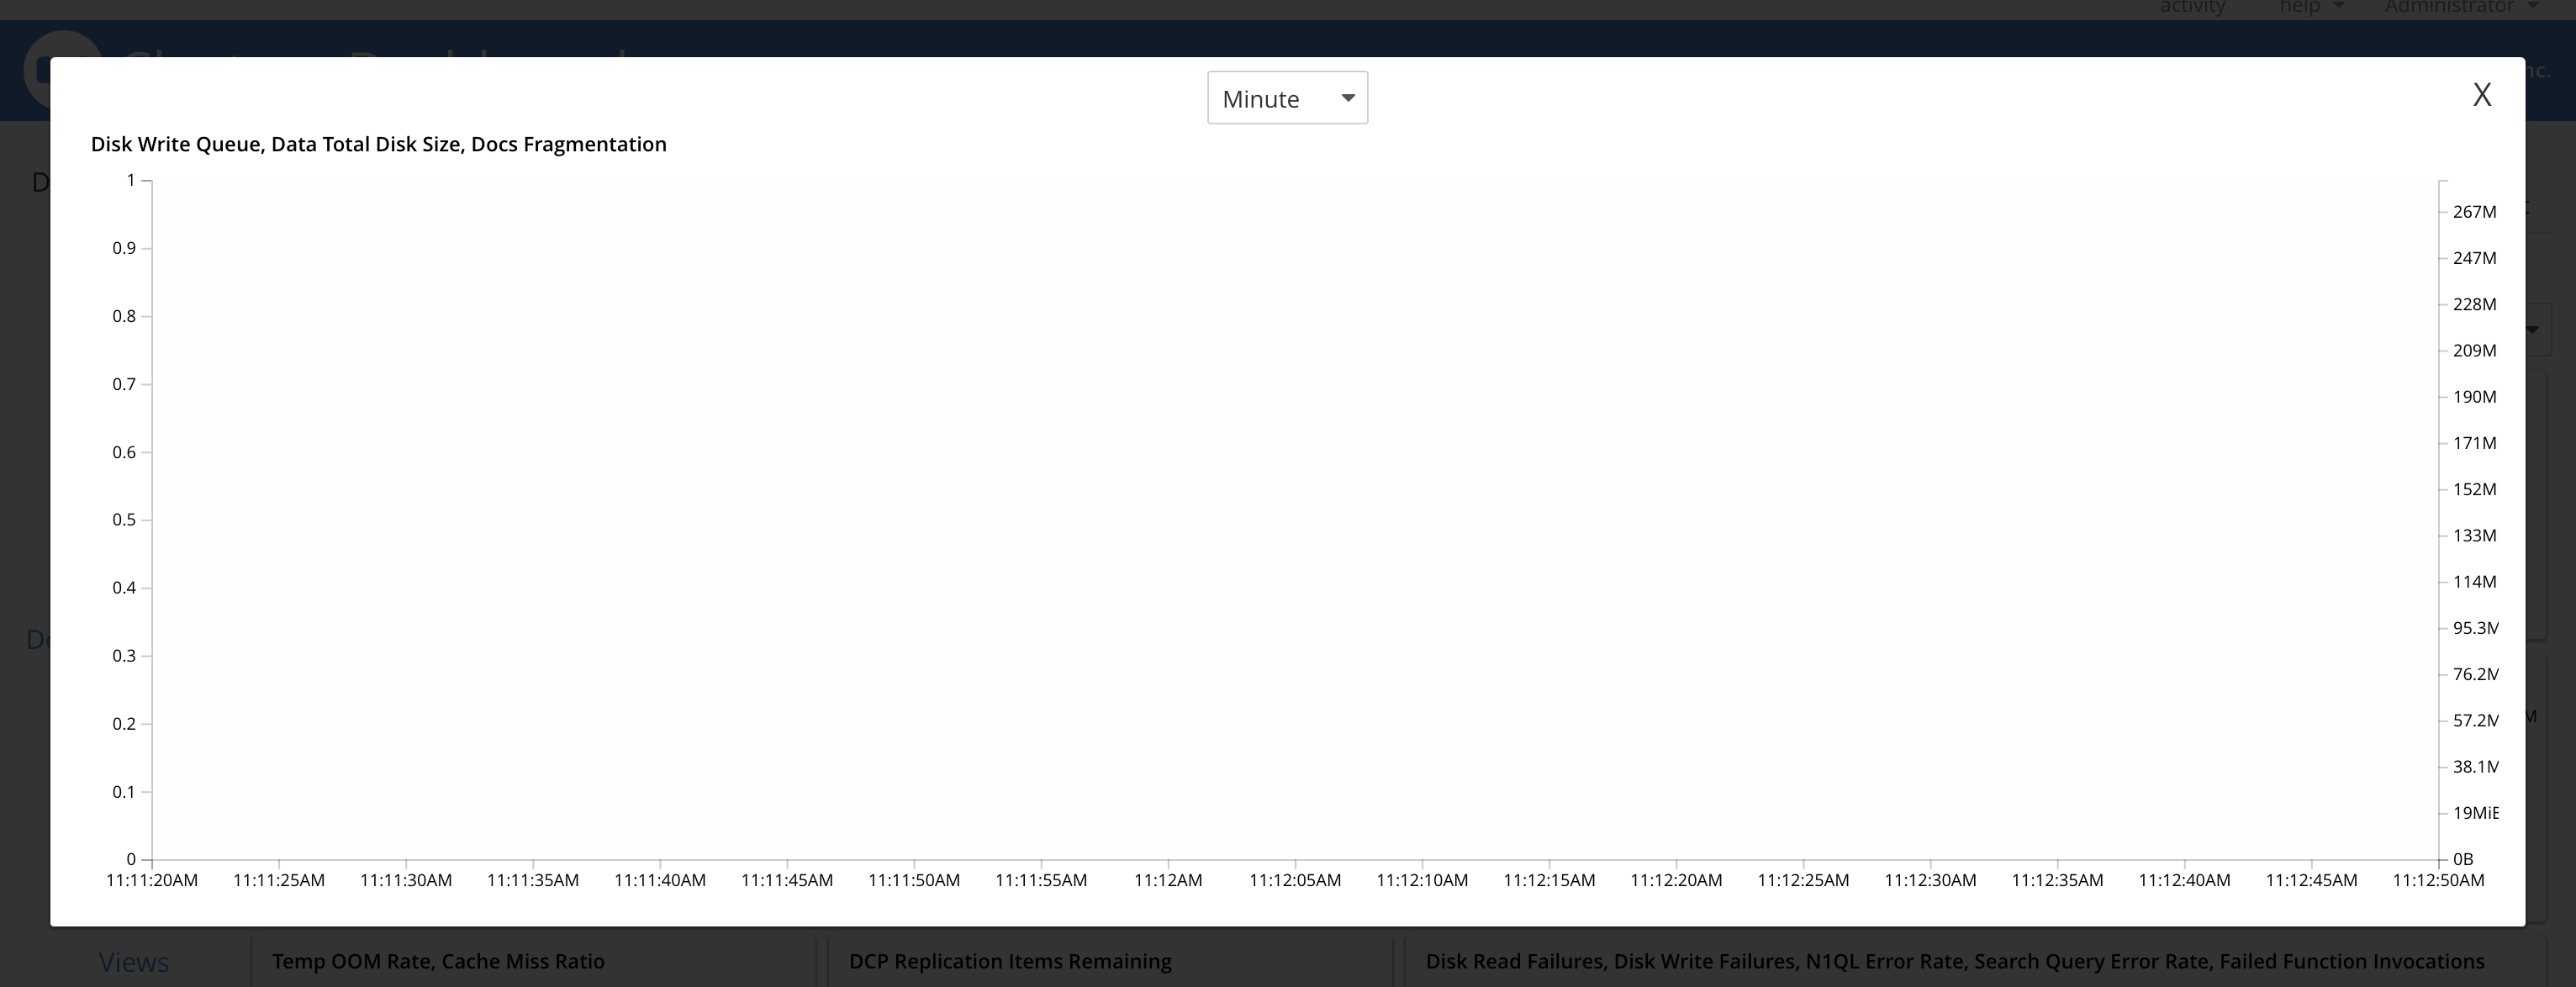
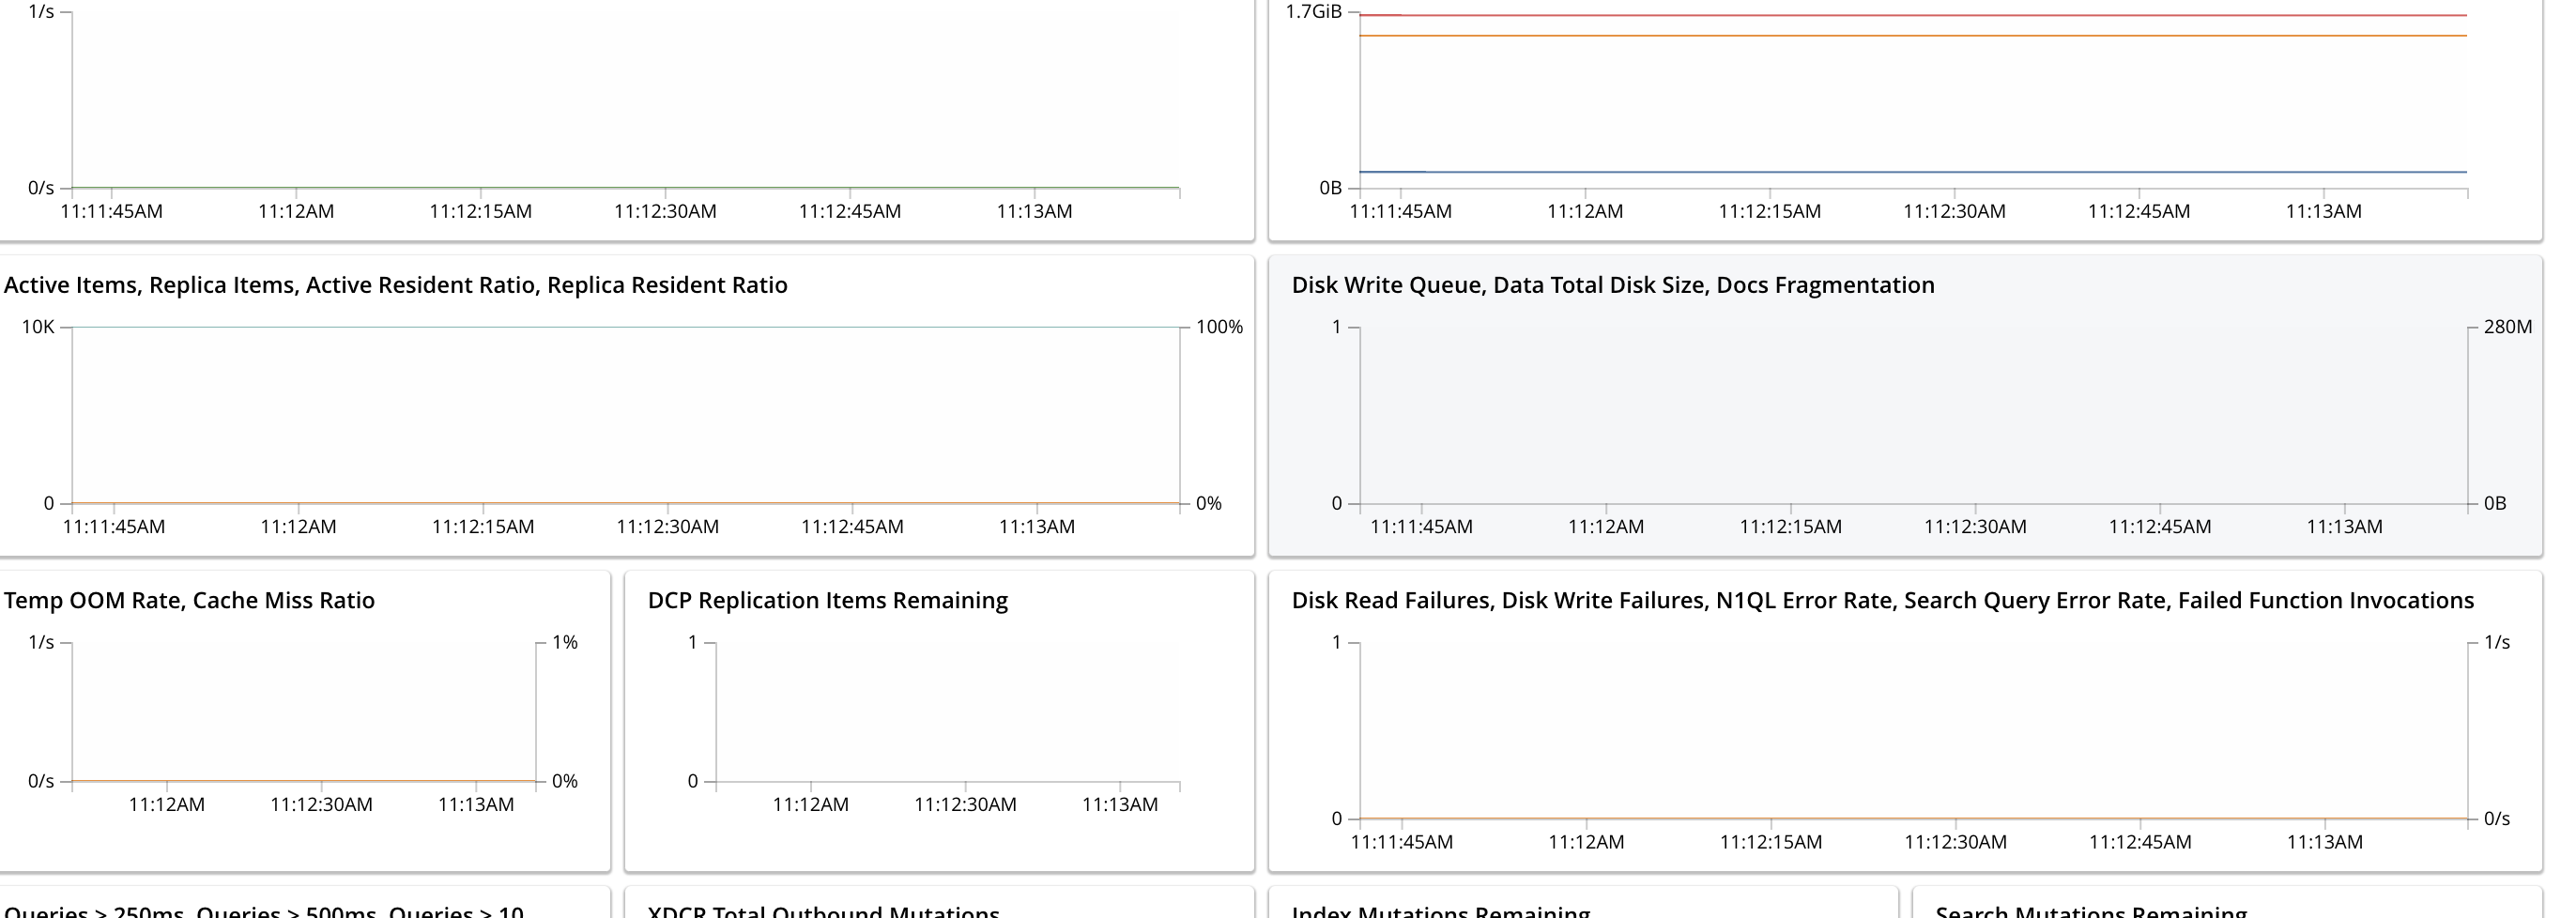
Uploaded image for project: 'Couchbase Server'
  1. Couchbase Server
  2. MB-46015

[Stats] Data total disk size...graph not plotted

    XMLWordPrintable

Details

    • Bug
    • Resolution: Fixed
    • Critical
    • 7.0.0
    • Cheshire-Cat
    • UI
    • CB EE 7.0.0-5048

    Description

      Summary:
      The following graph "Disk Write Queue, Data Total Disk Size, Docs Fragmentation" at Dashboards-> Cluster overview, is not shown. See the screenshots attached. I checked the range api request UI makes to ns_server and the response looks fine; so I believe it's just the graph that doesn't get plotted. I waited sufficiently long and changed the interval from min to hours, but nothing seemed to get it to plot. Have attached the corresponding rest api response.

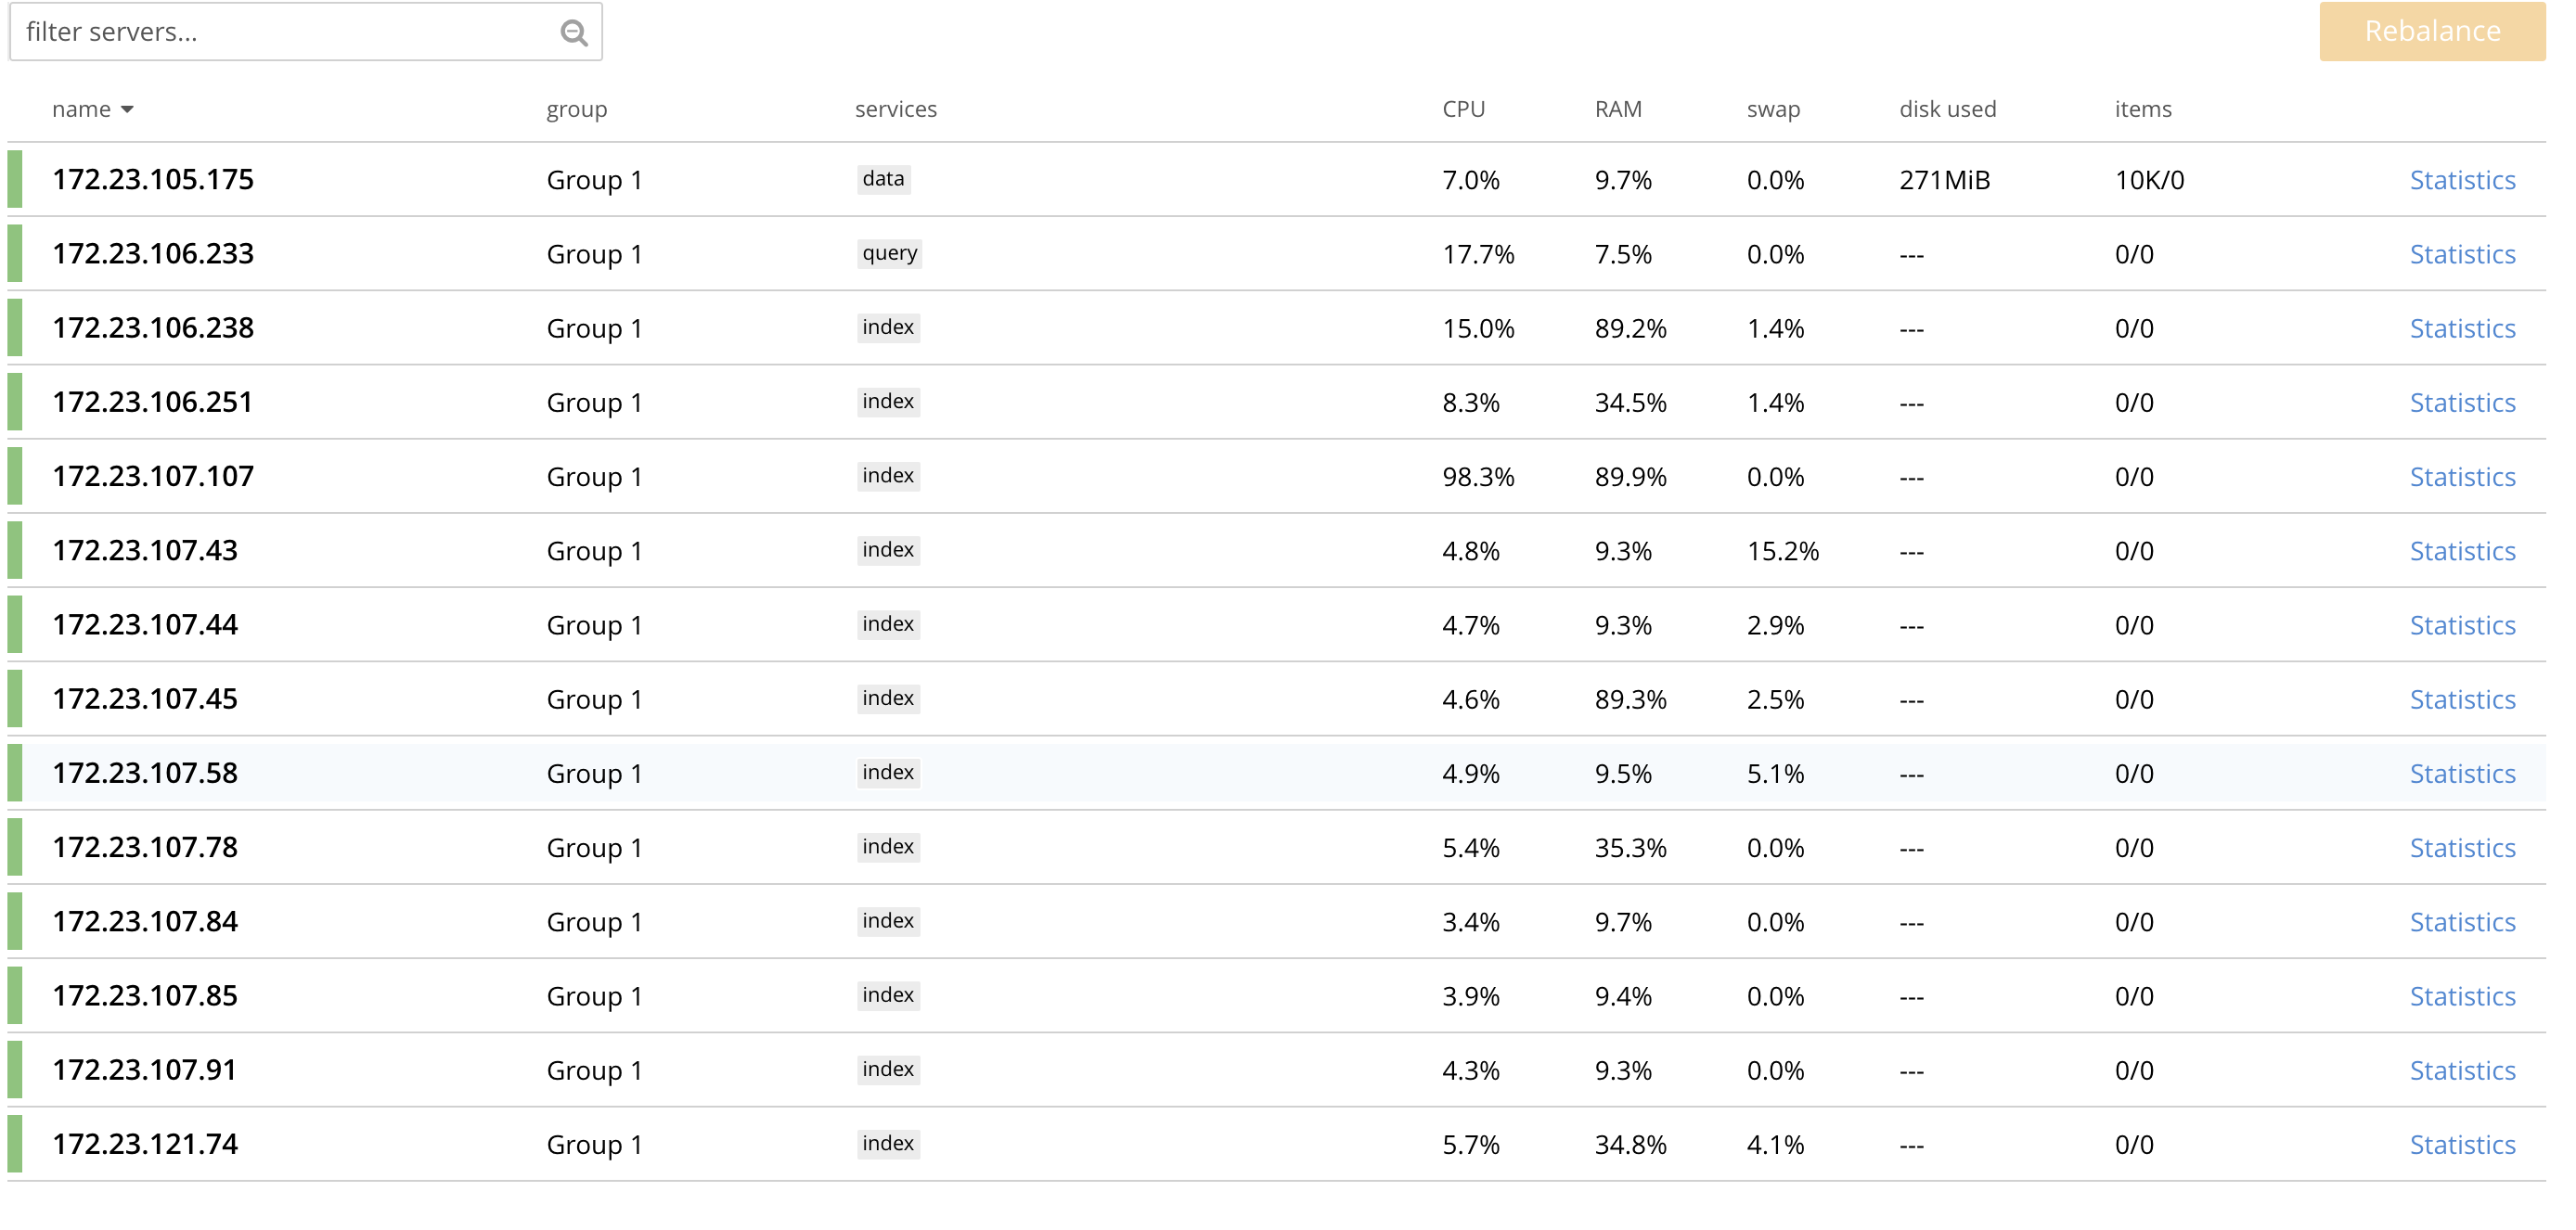
      The cluster had the following when I observed this:
      1. 1 kv node, 1 n1ql node, 12 index nodes. (.175 is the kv node)
      2. I bucket, 1k collections, total of 10k items, around 4k gsi indexes
      But I think the issue is reproducible on a smaller cluster as well 

      Logs and screenshots attached

      Attachments

        No reviews matched the request. Check your Options in the drop-down menu of this sections header.

        Activity

          People

            rob.ashcom Rob Ashcom (Inactive)
            sumedh.basarkod Sumedh Basarkod (Inactive)
            Votes:
            0 Vote for this issue
            Watchers:
            2 Start watching this issue

            Dates

              Created:
              Updated:
              Resolved:

              Gerrit Reviews

                There are no open Gerrit changes

                PagerDuty