Details
-
Bug
-
Status: Closed
-
Major
-
Resolution: Not a Bug
-
Cheshire-Cat
-
Untriaged
-
1
-
Unknown
Description
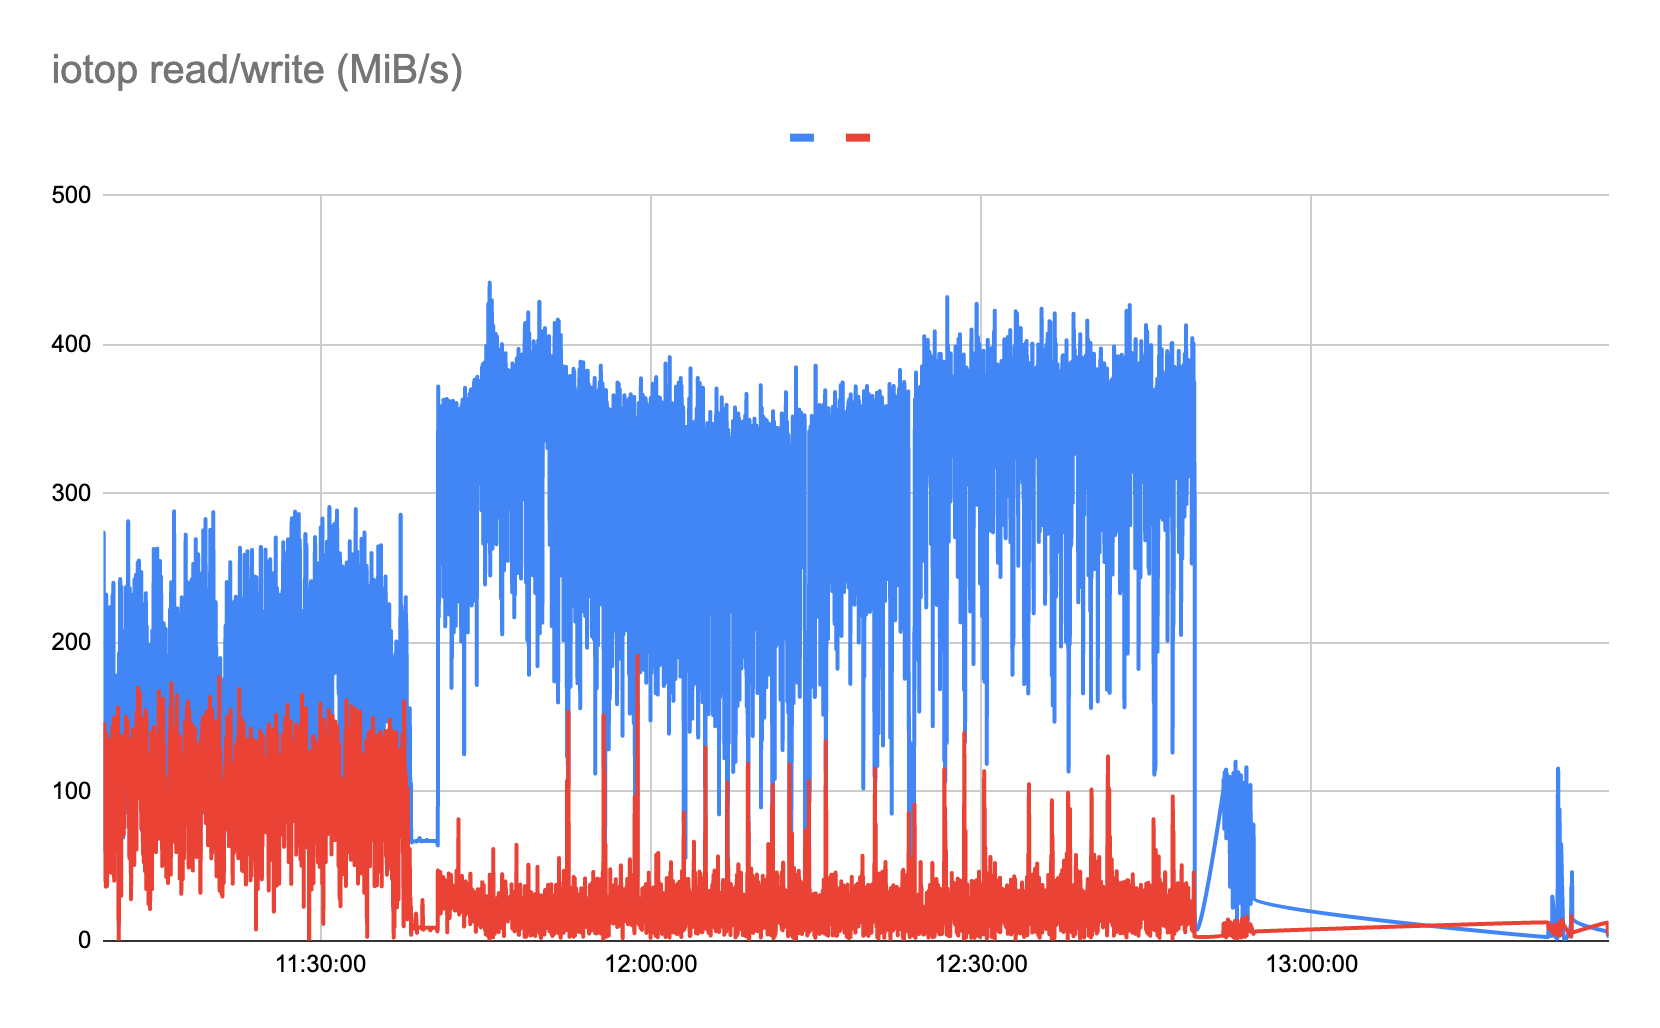
In 7 indexes bloom filter test for build 5177, I can see that the 2 stats approximately match rbps and wbps from html report.
rbps 300-400 MB/s
|
wbps 100-150 MB/s
|
|
2021-05-19T15:43:59.874-07:00 [Info] Periodic Aggregated StorageStats:
|
"lss_read_bs": 2976503344353,
|
"bytes_written": 1906122153984,
|
|
2021-05-19T16:13:59.870-07:00 [Info] Periodic Aggregated StorageStats:
|
"lss_read_bs": 3528014358936, +551511014583 306395008/s
|
"bytes_written": 2066645012480, +160522858496 89179365/s
|
{nofomat}
|
|
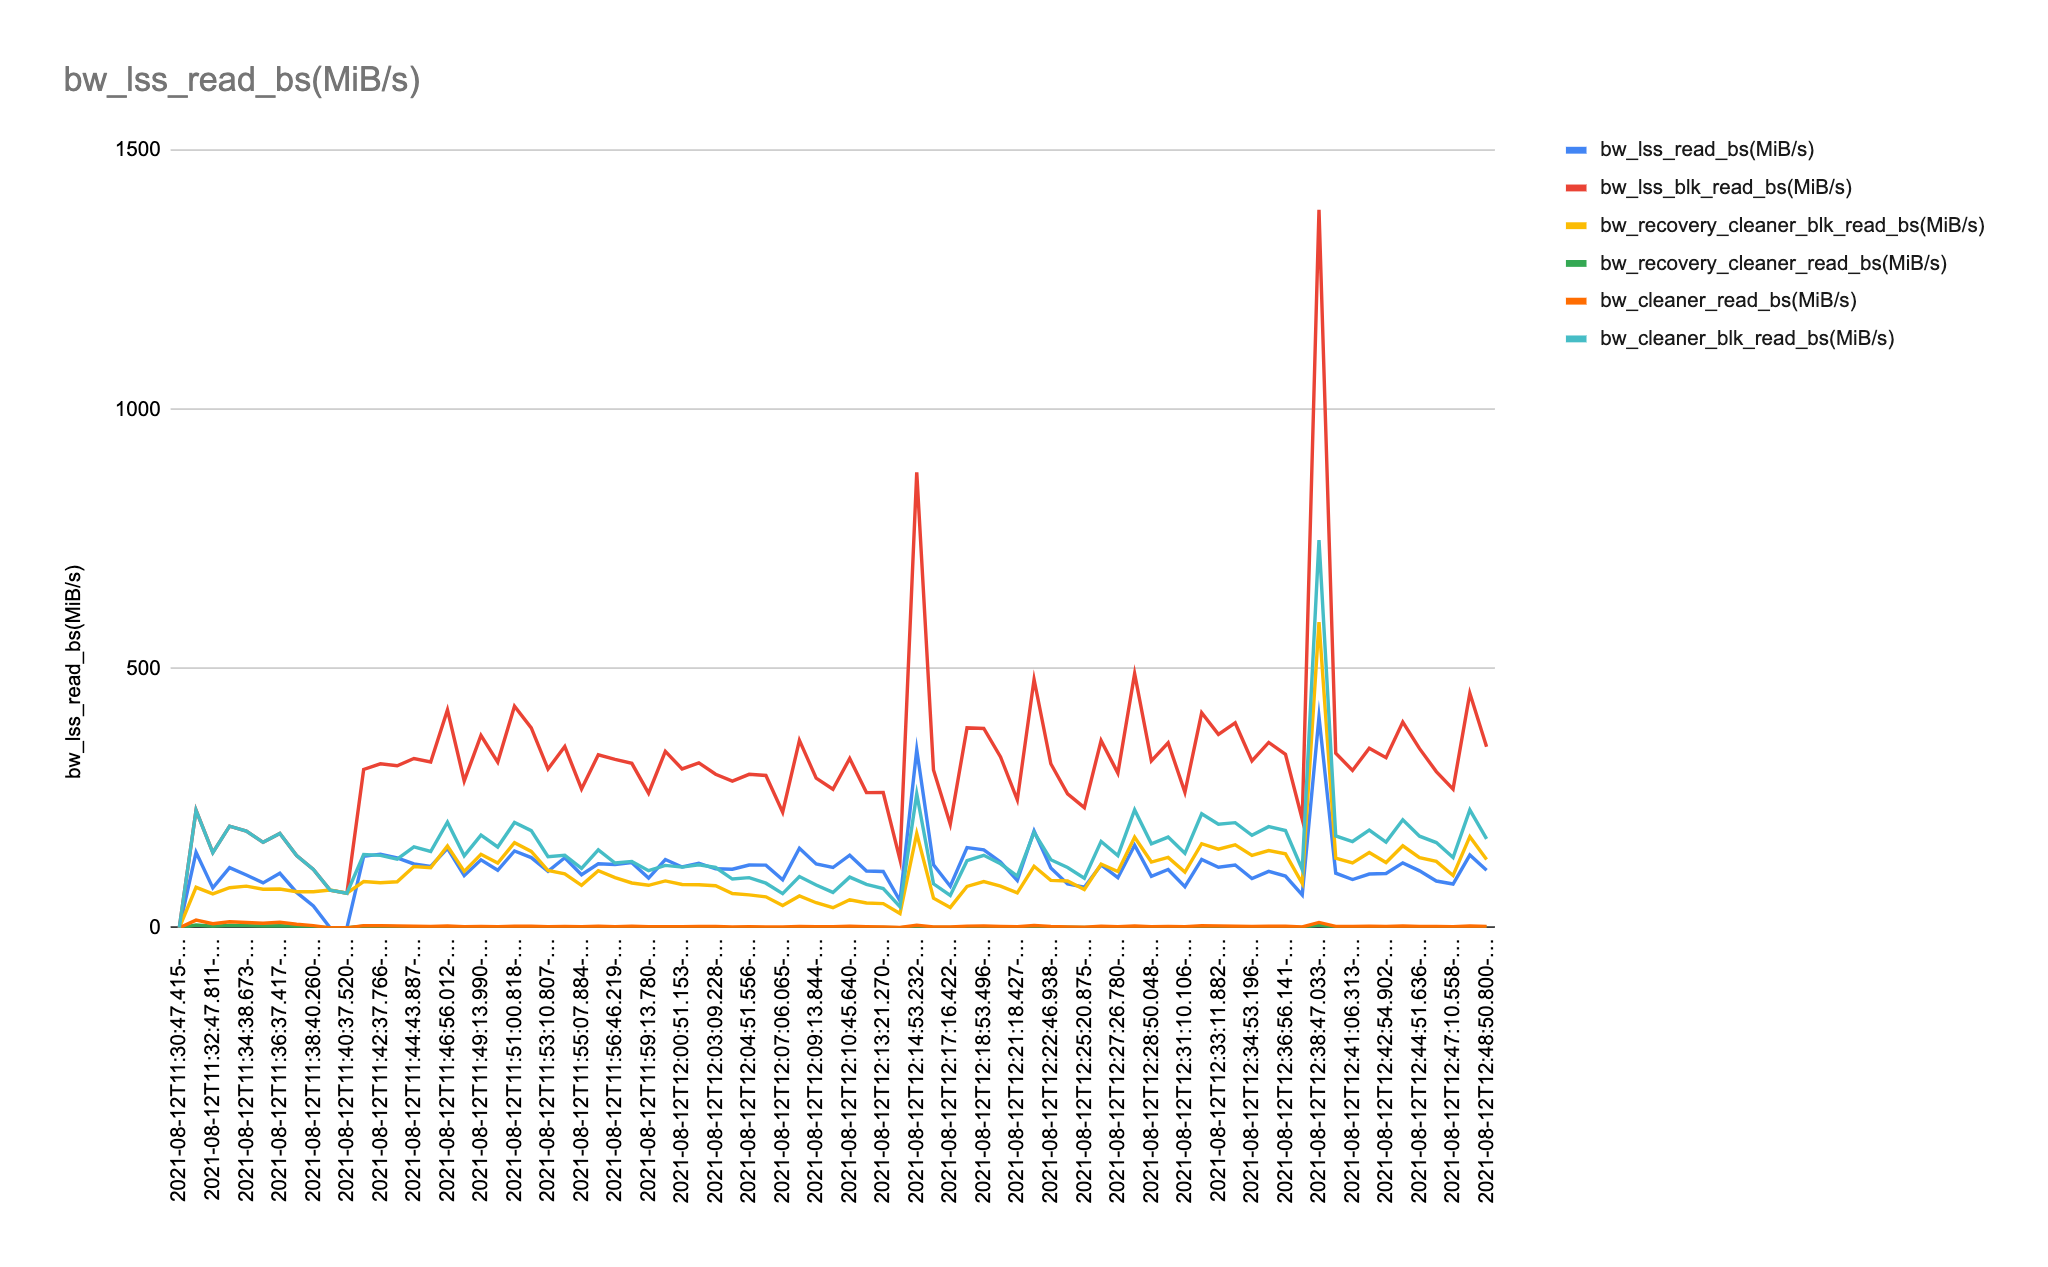
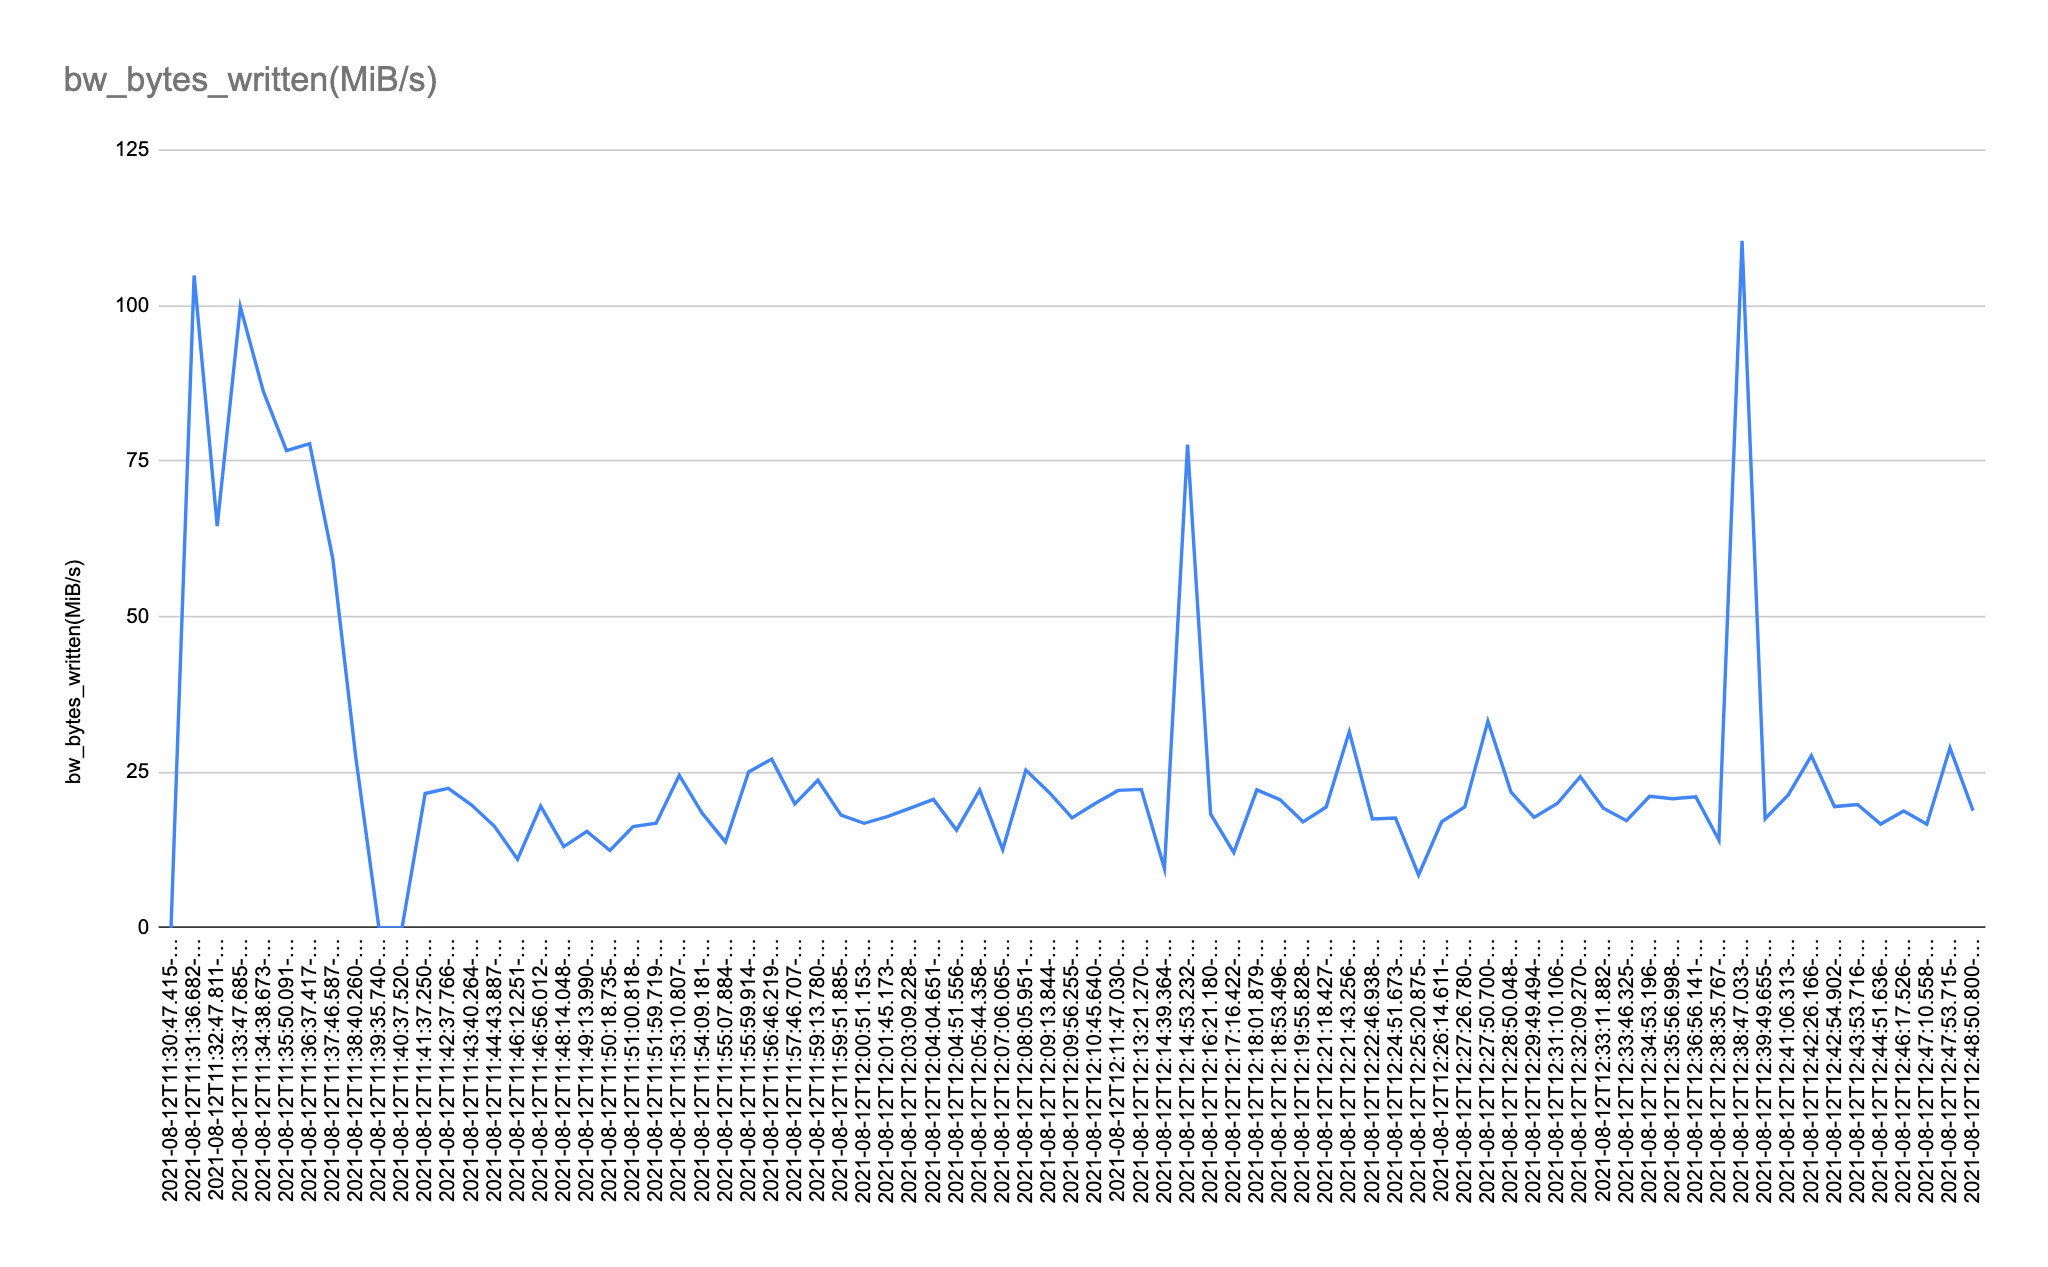
For 10K index incremental build test, the number seems to be off, especially for lss_read_bs.
|
rbps read 150 MB/s
wbps write 125 MB/s
2021-05-23T23:02:54.037-07:00 [Info] Periodic Aggregated StorageStats:
"lss_read_bs": 1382967959770,
"bytes_written": 574250827776,
2021-05-23T23:32:53.544-07:00 [Info] Periodic Aggregated StorageStats:
"lss_read_bs": 2050042223997, 667074264227 370596813/s
"bytes_written": 695640932352, 121390104576 67438946/s
|
Attachments
Issue Links
- backports to
-
MB-47990 [BP 7.0.2] - lss_rea_bytes and bytes_written do not always match perf html report
-
- Closed
-
Activity
Field | Original Value | New Value |
---|---|---|
Fix Version/s | 7.0.1 [ 17104 ] | |
Fix Version/s | CheshireCat.Next [ 16908 ] |
Assignee | John Liang [ jliang ] | Akhil Mundroy [ akhil.mundroy ] |
Assignee | Akhil Mundroy [ akhil.mundroy ] | Saptarshi Sen [ JIRAUSER25455 ] |
Fix Version/s | 7.0.2 [ 18012 ] |
Fix Version/s | 7.0.1 [ 17104 ] |
Attachment | image-2021-08-12-16-56-09-474.png [ 154838 ] |
Attachment | image-2021-08-12-16-57-41-981.png [ 154839 ] |
Attachment | image-2021-08-12-16-58-05-947.png [ 154840 ] |
Attachment | image-2021-08-12-16-58-27-196.png [ 154841 ] |
Fix Version/s | Neo [ 17615 ] | |
Fix Version/s | 7.0.2 [ 18012 ] |
Resolution | Fixed [ 1 ] | |
Status | Open [ 1 ] | Resolved [ 5 ] |
Resolution | Fixed [ 1 ] | |
Status | Resolved [ 5 ] | Reopened [ 4 ] |
Resolution | Not a Bug [ 10200 ] | |
Status | Reopened [ 4 ] | Resolved [ 5 ] |
Status | Resolved [ 5 ] | Closed [ 6 ] |
DirectIO Test:
Ran a 10k perf test on hemera cluster with basically two sets of changes
a) change aggregate stats logging interval 1 min and
b) each logging interval, get uncached LSS Stats
c) secondary."indexer.plasma.useDirectIO".true
d) one minor fix in cleaner stats
Test Spec:
gsi/plasma/secondary_100M_10k_indexes_70_20_10_iud_20res_plasma_1s_1000c.test
Toy build:
http://latestbuilds.service.couchbase.com/builds/latestbuilds/couchbase-server/toybuilds/13383/couchbase-server-enterprise-7.0.0-13383-centos7.x86_64.rpm
Observation:
The overall Aggregate Read/Write Bandwidth matches with Actual Disk Metrics.
However, I noticed two spikes in computed bandwidth in the incremental build portion. The log interval around the spike region seemed rather narrow ~(14s).
http://perf.jenkins.couchbase.com/view/GSI/job/hemera/2406/consoleFull
http://cbmonitor.sc.couchbase.com/reports/html/?snapshot=hemera_700-13383_build_secondaryindex_1f6c
http://cbmonitor.sc.couchbase.com/reports/html/?snapshot=hemera_700-13383_build_incrindex_6dc9
Disk Metrics:
Plasma Periodic Aggregate Stats: