Details
-
Bug
-
Resolution: Not a Bug
-
 Major
Major
-
7.0.1, 7.1.0
-
None
-
Triaged
-
1
-
Unknown
Description
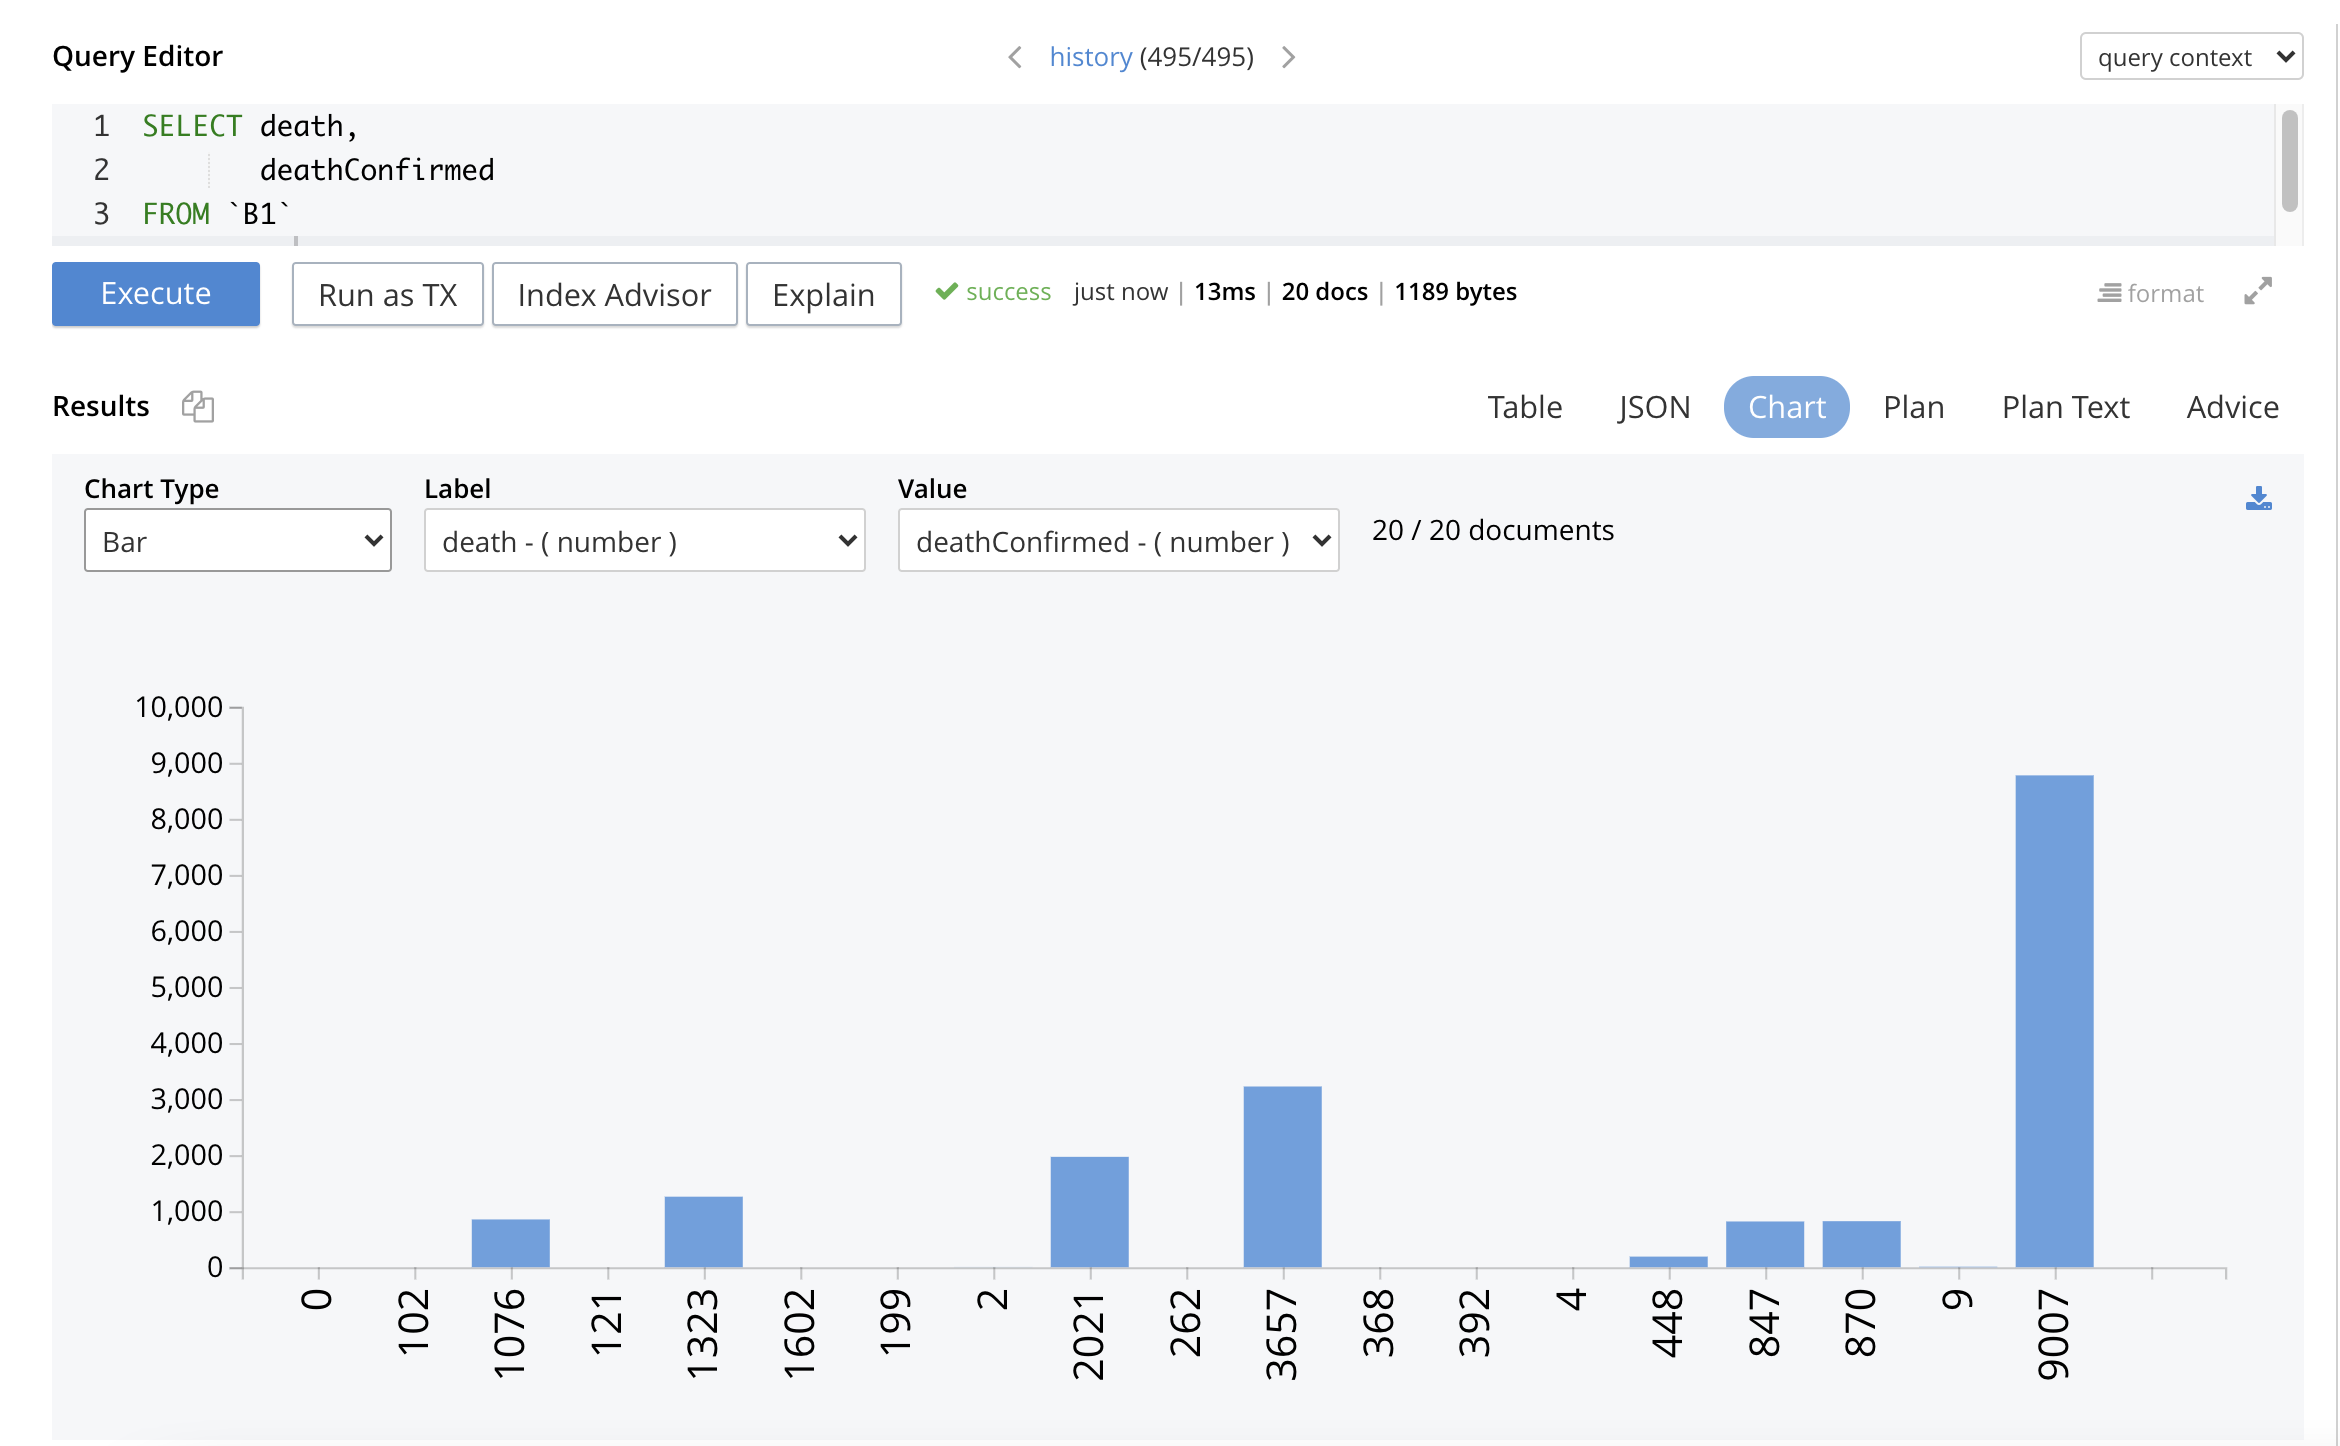
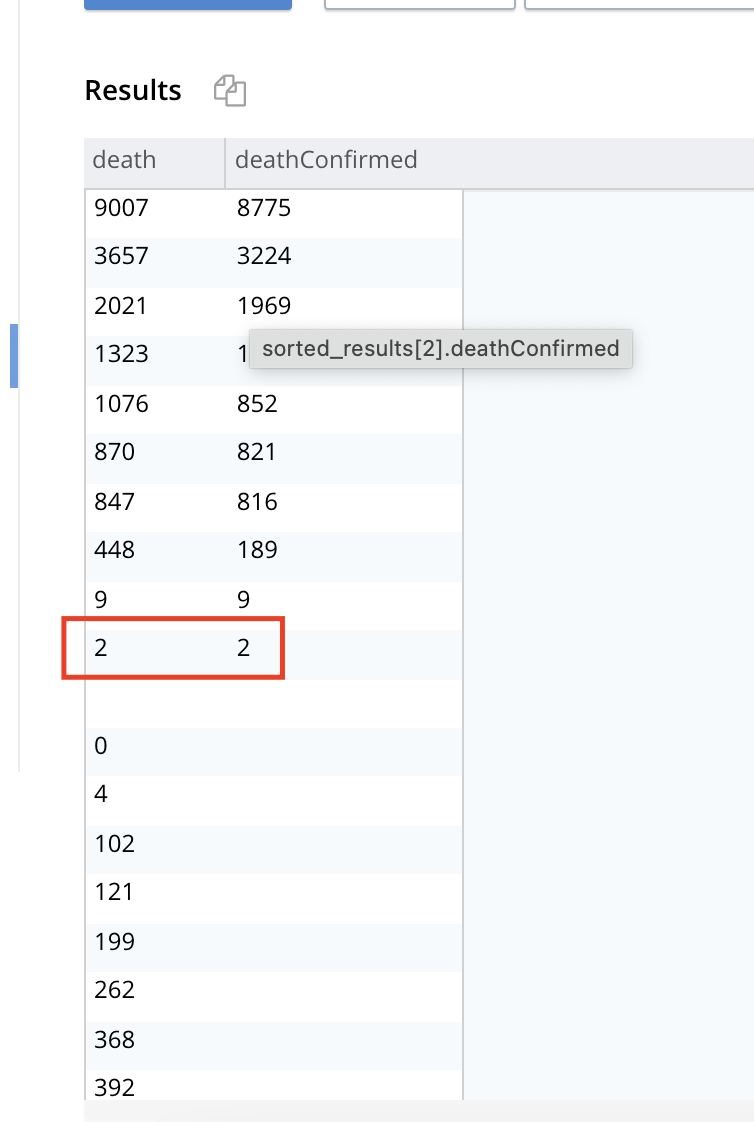
Value doesn't show up in charts. Y scale band removes the lowest value. This is for bar charts explicitly.
This is because the band difference between min and Max is very high.
Attachments
| For Gerrit Dashboard: MB-47595 | ||||||
|---|---|---|---|---|---|---|
| # | Subject | Branch | Project | Status | CR | V |
| 158458,8 | MB-47595: Fix issues with lowest value on Y axis being plotted | master | query-ui | Status: MERGED | +2 | +1 |