Uploaded image for project: 'Couchbase Server'
  1. Couchbase Server
  2. MB-47836

[UI][Analytics]For Scatter-Gather graph , data should display for all correctly for legends when data values is same

    XMLWordPrintable

Details

    • Bug
    • Resolution: User Error
    • Major
    • 7.0.2
    • 7.0.1
    • UI
    • Untriaged
    • Windows 64-bit
    • 1
    • Unknown

    Description

      Tested on 7.0.1 build 5996 

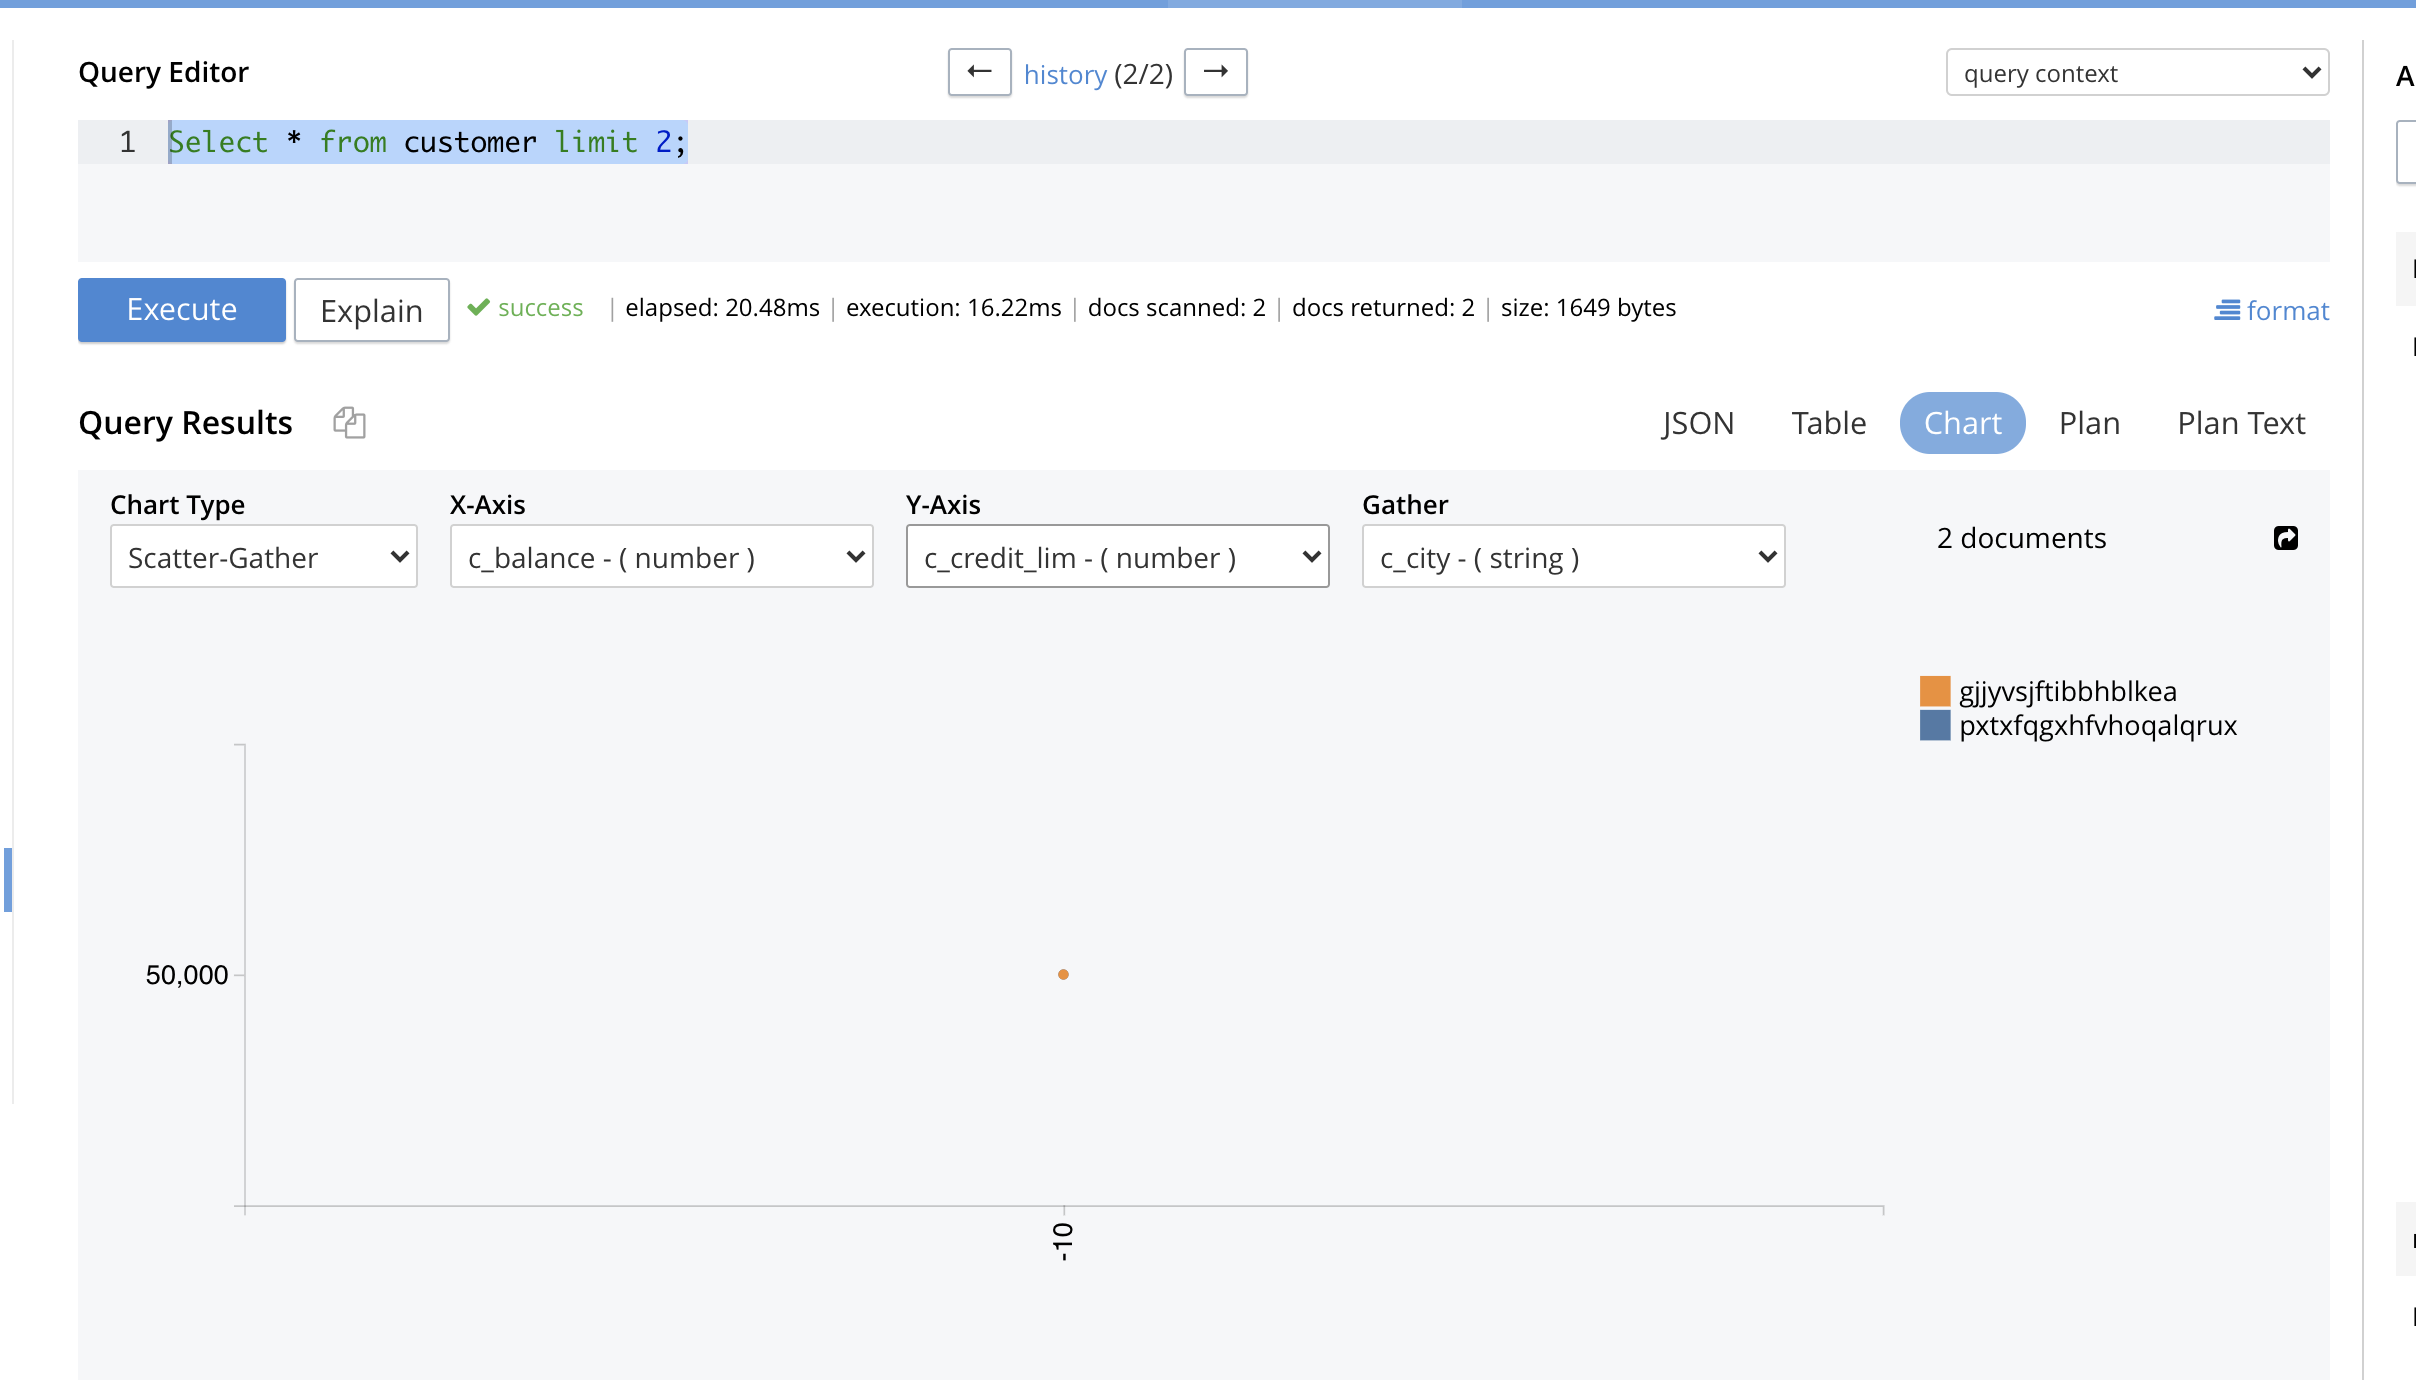
      Executed Analytics query as: 

      Select * from customer limit 2;

      On chart screen. chart type selected as scatter Gather, X- axis as "c-balance" and y-axis "c_credit_limit" and Gather as "c_city".

      c_balance for 2 records is -10 and -10 i.e. same 

      c_credit for 2 records is also same that is 50000 and 50000.

      On Graph, it is displaying for 1 city only where for same location it should show for both the data

      Attachments

        No reviews matched the request. Check your Options in the drop-down menu of this sections header.

        Activity

          People

            isha Isha Kandaswamy (Inactive)
            deepika.verma Deepika Verma (Inactive)
            Votes:
            0 Vote for this issue
            Watchers:
            2 Start watching this issue

            Dates

              Created:
              Updated:
              Resolved:

              Gerrit Reviews

                There are no open Gerrit changes

                PagerDuty