Details
-
Bug
-
Resolution: Fixed
-
 Critical
-
7.0.2
-
Untriaged
-
1
-
Yes
Description
When doing some tests on a 3 x t5.2xlarge AWS cluster I noticed that a set of symmetric servers (Data, Query, Index, Eventing) with default memory quotas have excessive CPU utilization when completely idle on two out of the three nodes. I am running Enterprise Edition 7.0.2 build 6683
- Each node is a r5.2xlarge: 64 GiB of memory, 8 vCPUs, 64-bit platform
I created 20 buckets (default scope and default collection) loaded 50K small documents in each bucket and made a primary index in each.
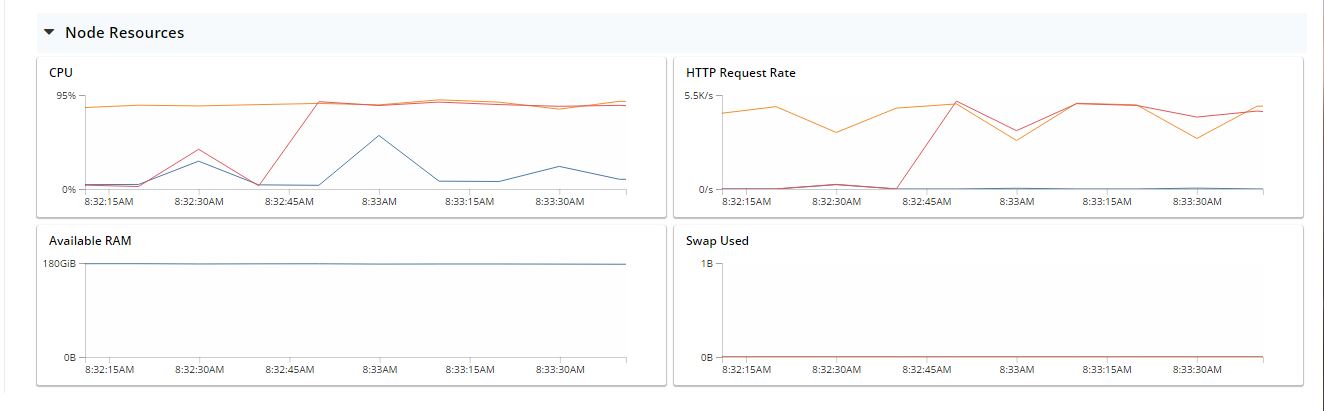
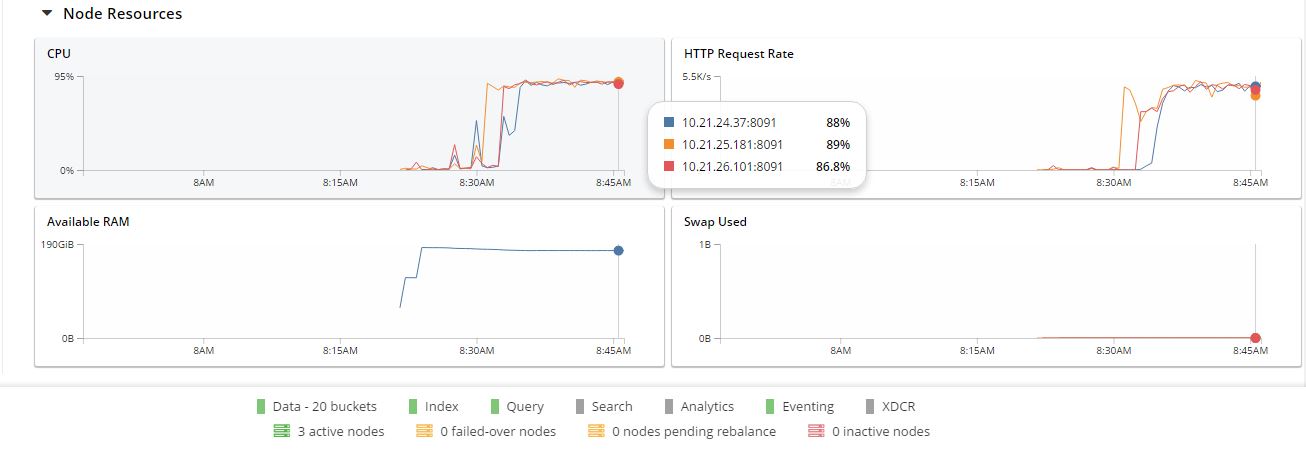
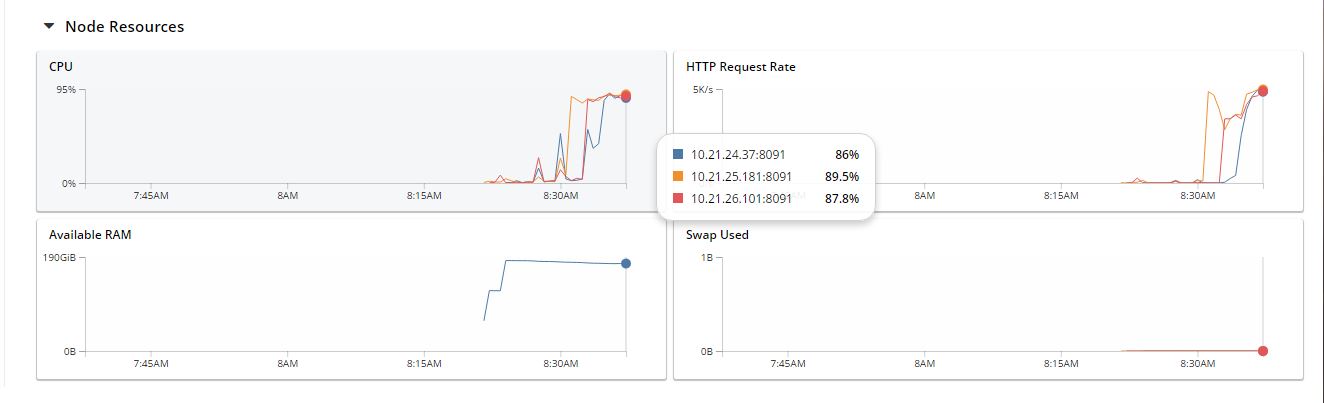
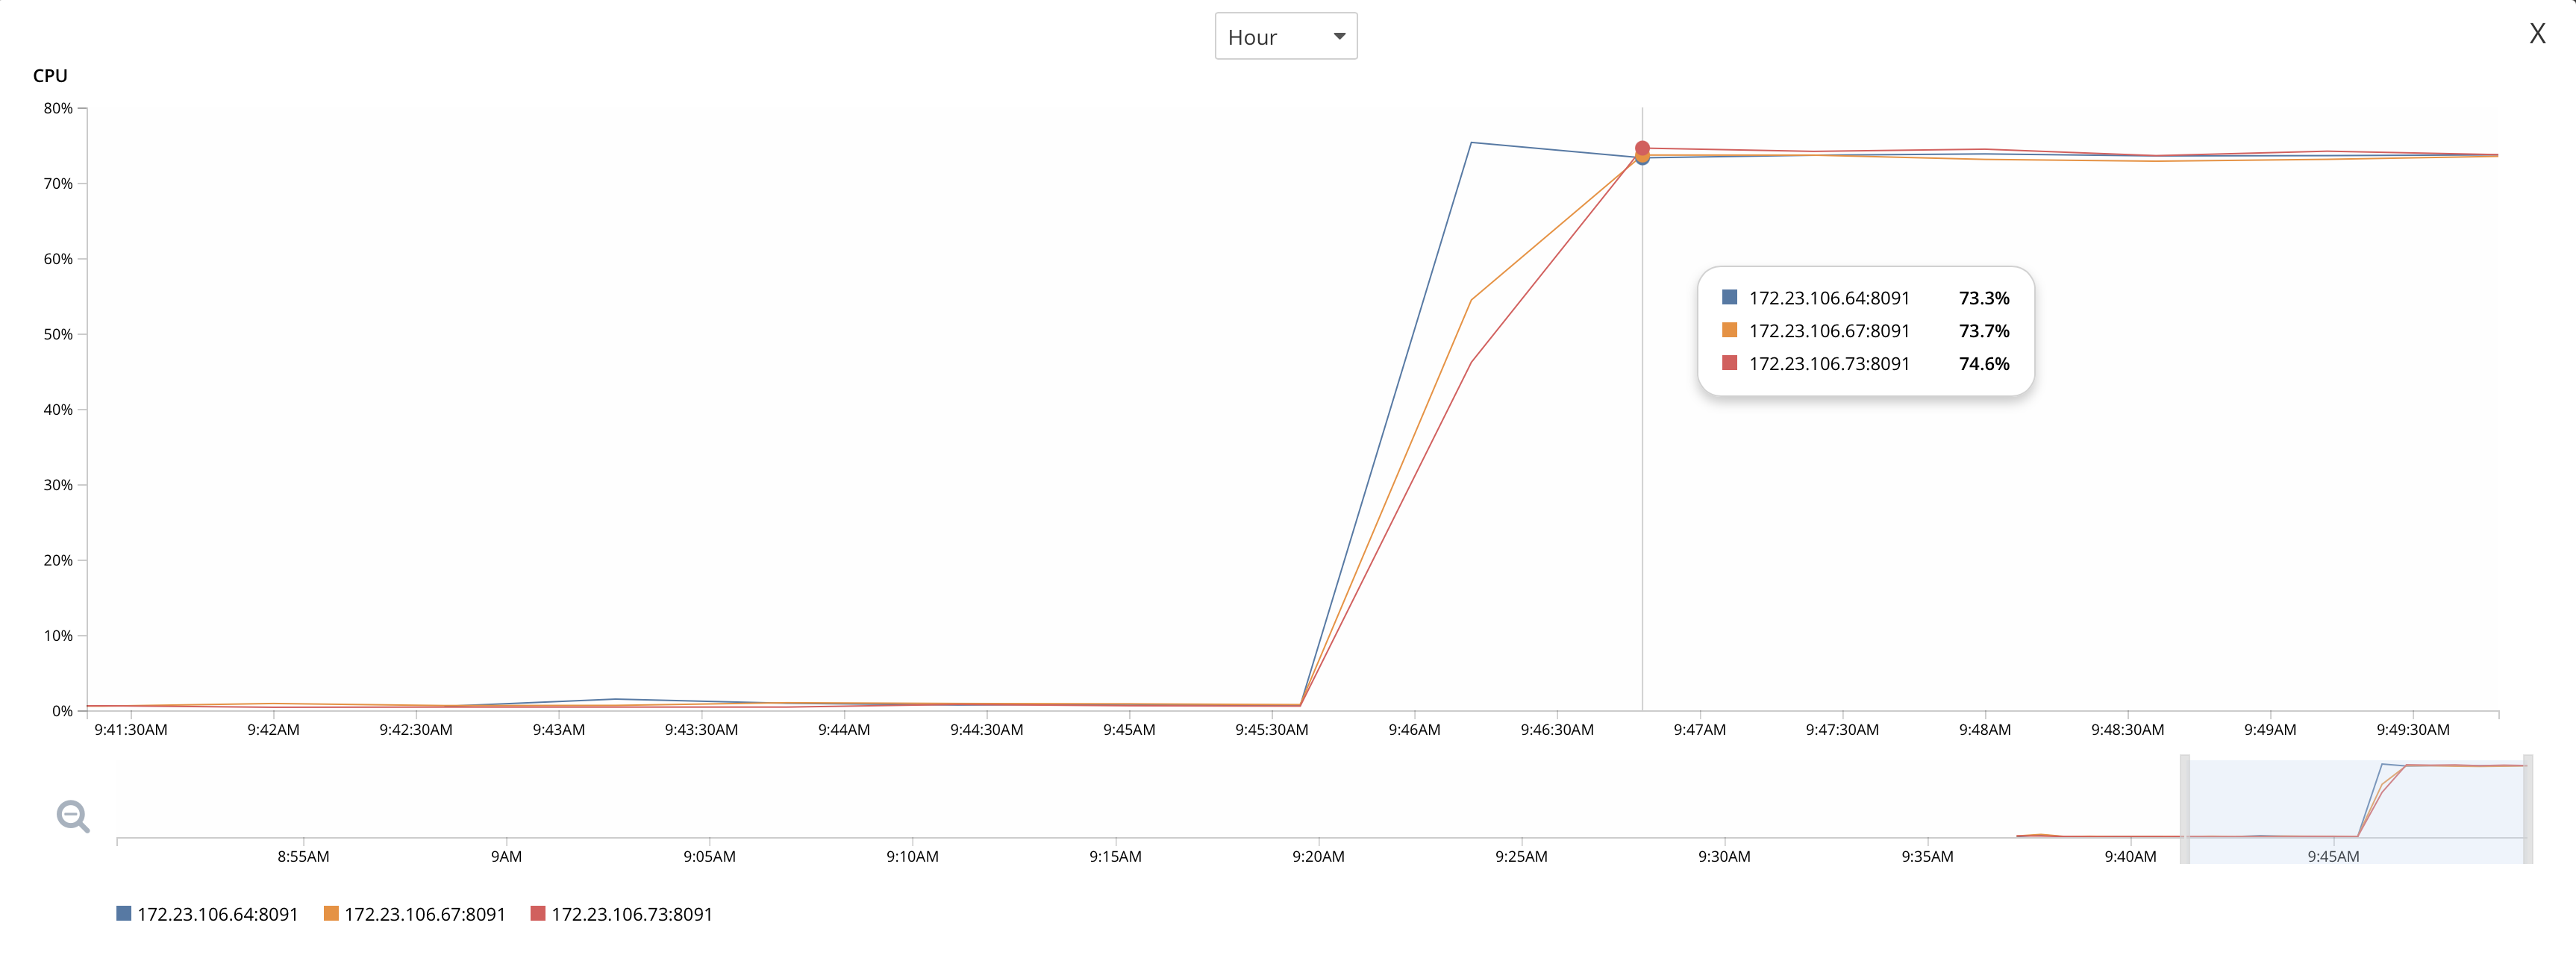
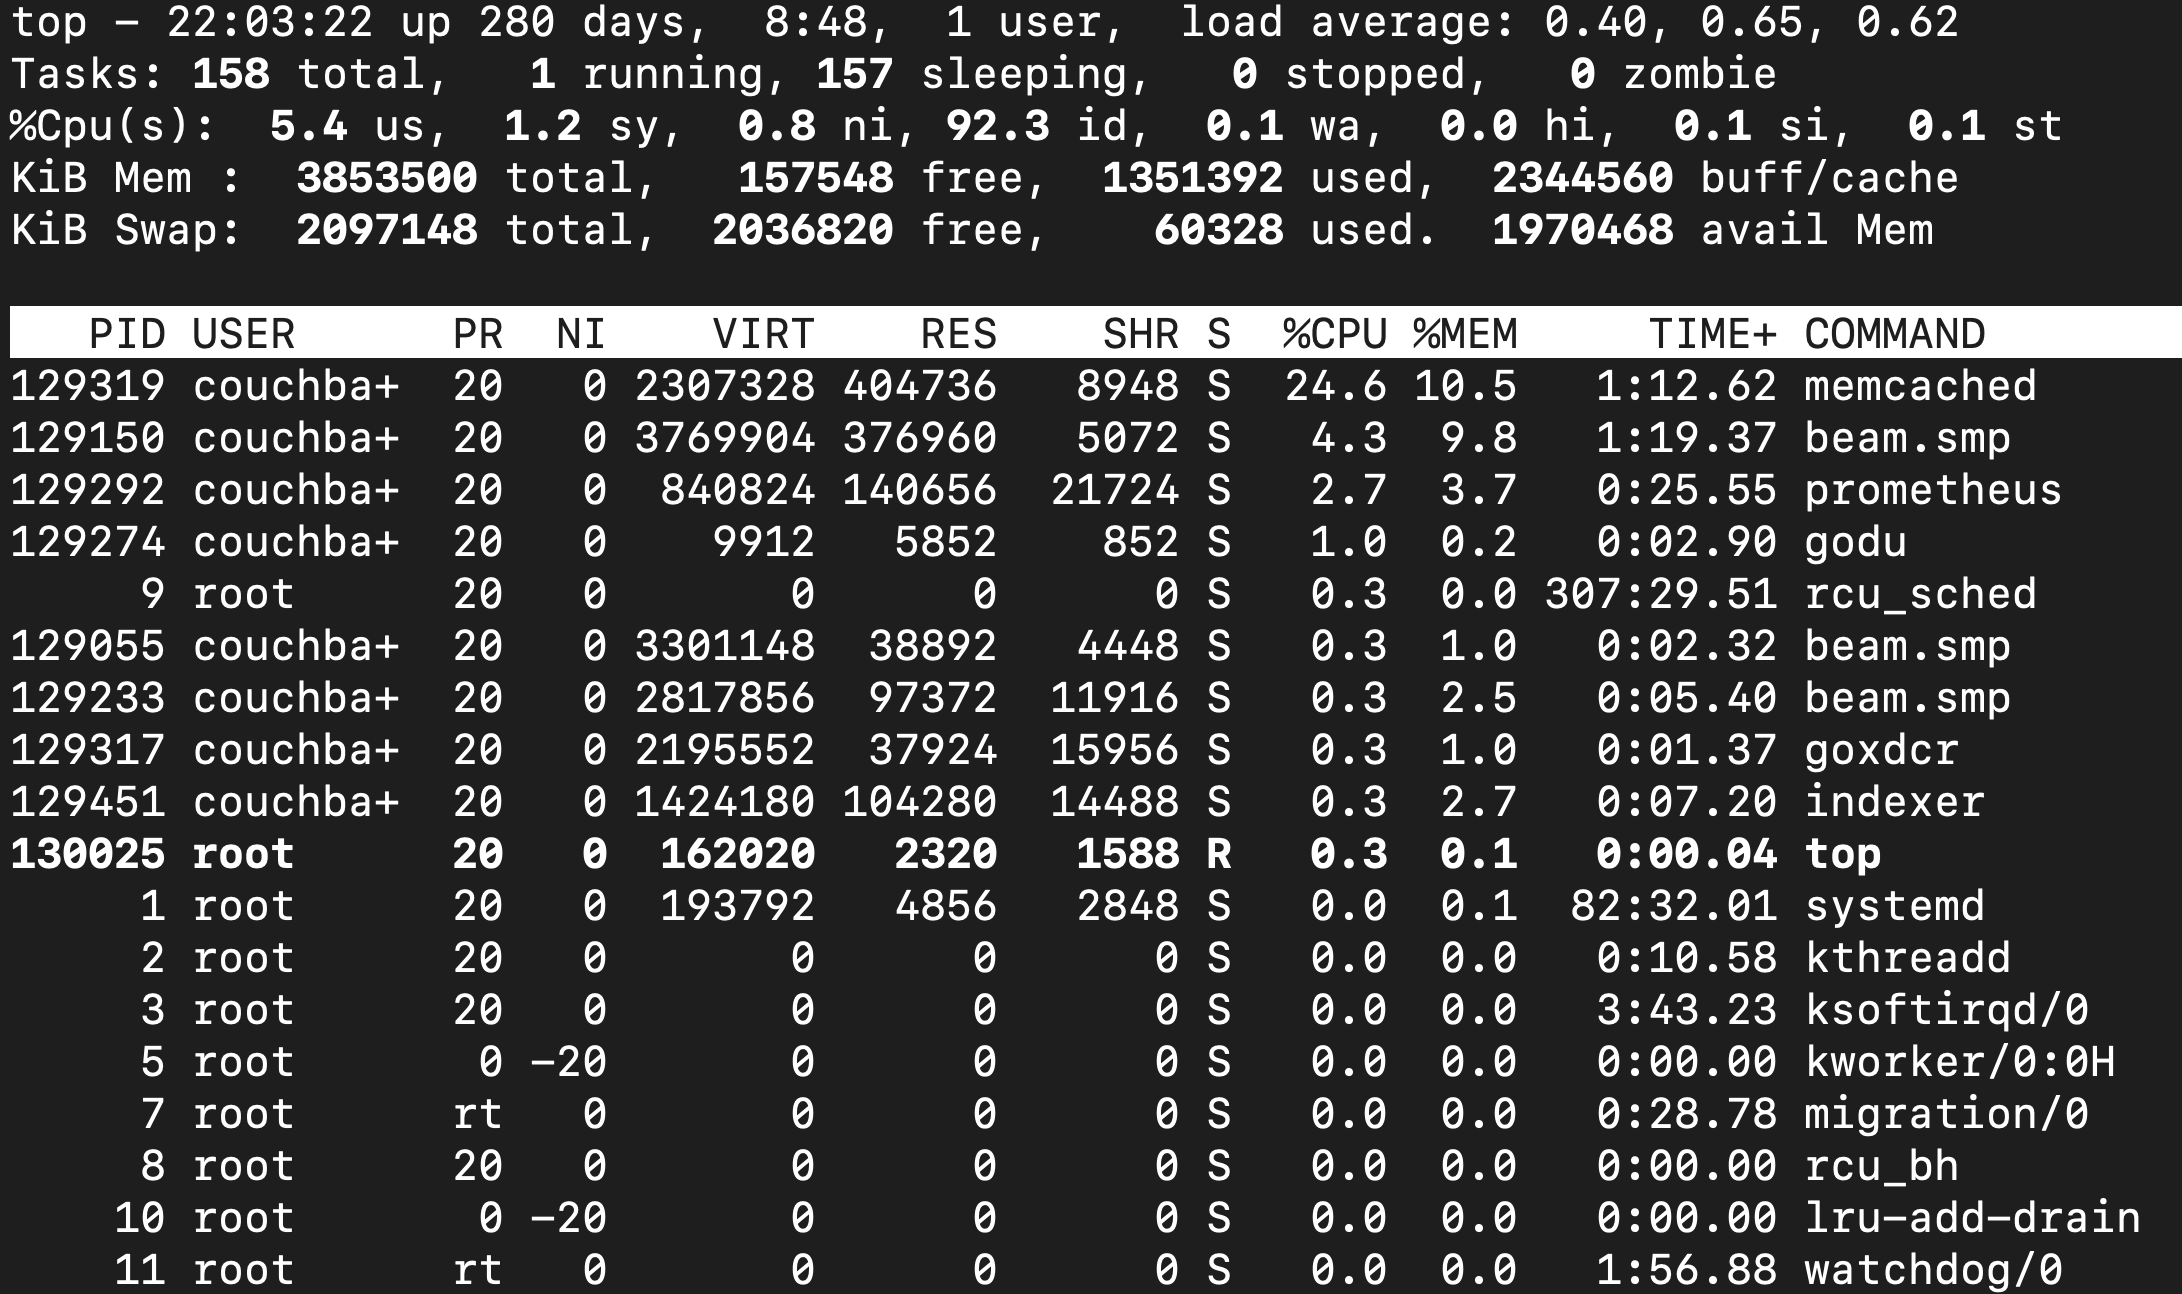
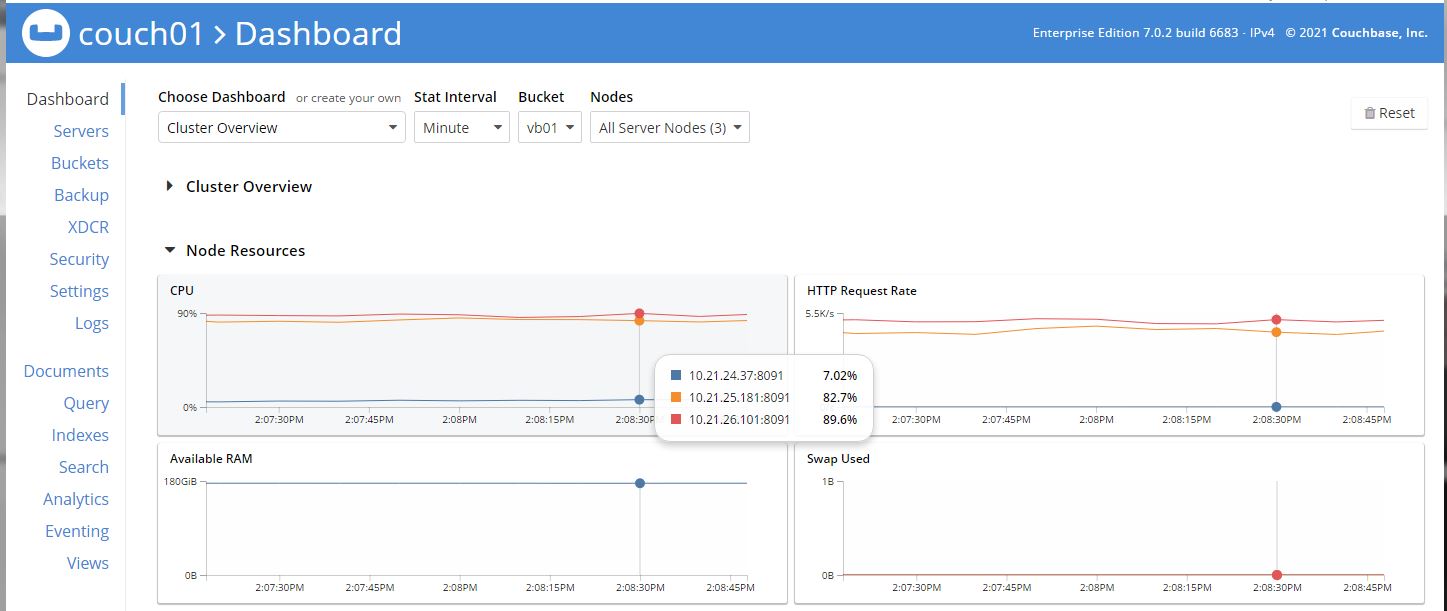
There has never been an Eventing Function configured (nor does one exist in the Eenting UI) on any of the nodes, it seems like on two (2) of the nodes the "eventing-producer" and "beam.smp" interact adversely when they shouldn't. The first node (10.21.24.37) looks correct but the next two nodes (10.21.25.181 and 10.21.26.101) appear to have way too much CPU burned doing absolutely nothing the these nodes are both above 84% CPU utilization(while the first node is under 7%).
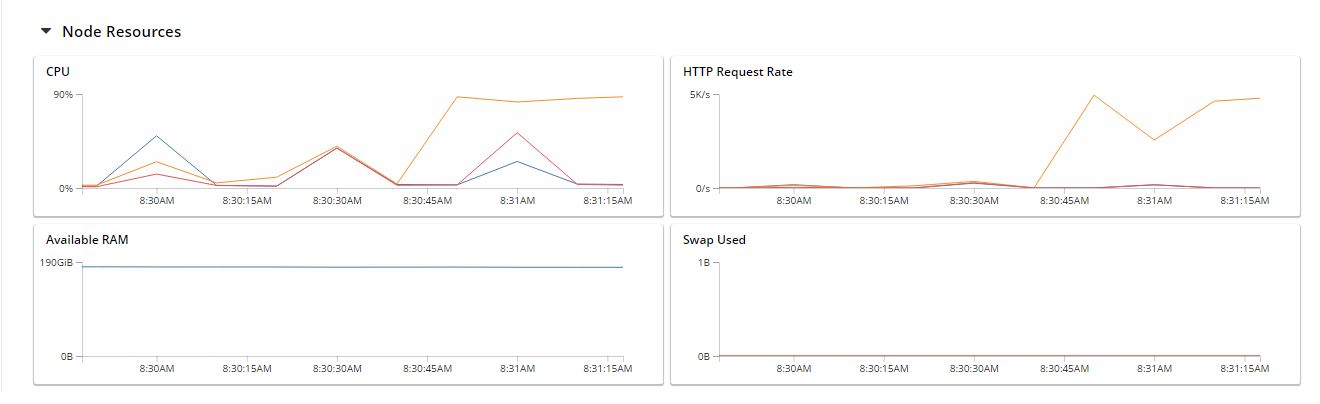
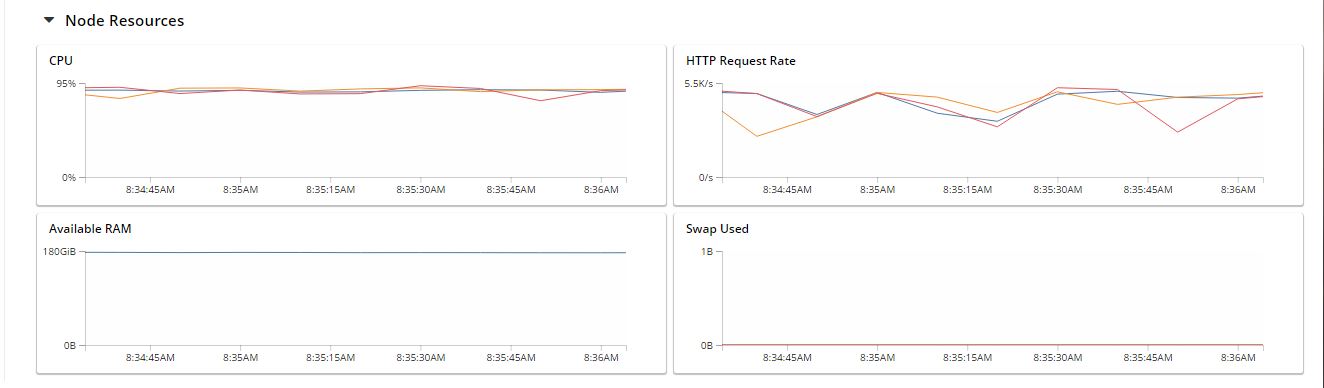
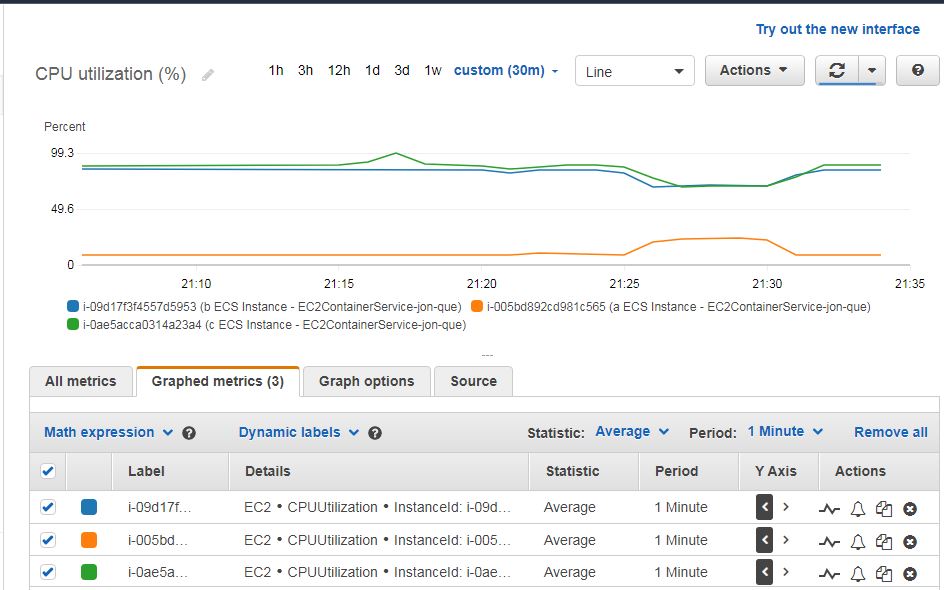
There is no issue if I drop Eventing as a Service from every node and re-run the exact same test (Data, Query, Index) there is no issue 20 buckets (default scope and default collection) loaded 50K small documents in each bucket and made a primary index in each. The result is every node looks the same in the idle state all measuring under 10% CPU utilization (9.3% 7.8% and 7.6%) see picture "compare_with_eventing_and_without_eventing.JPG"
ec2-user@ec2-15-223-36-143.ca-central-1.compute.amazonaws.com
private IP 10.21.24.37
top - 21:10:39 up 40 days, 22:54, 1 user, load average: 0.46, 0.70, 1.61
|
Tasks: 172 total, 1 running, 114 sleeping, 0 stopped, 0 zombie
|
%Cpu(s): 5.4 us, 0.9 sy, 0.0 ni, 93.7 id, 0.0 wa, 0.0 hi, 0.0 si, 0.0 st
|
KiB Mem : 65150468 total, 54548460 free, 3549868 used, 7052140 buff/cache
|
KiB Swap: 0 total, 0 free, 0 used. 61633764 avail Mem
|
PID USER PR NI VIRT RES SHR S %CPU %MEM TIME+ COMMAND
|
24461 couchba+ 20 0 5026936 862652 14888 S 27.9 1.3 16:49.89 memcached
|
24276 couchba+ 20 0 4772976 608832 8068 S 13.9 0.9 58:39.18 beam.smp
|
24759 couchba+ 20 0 2660836 453388 28020 S 9.1 0.7 4:01.53 indexer
|
24664 couchba+ 20 0 1110724 266944 41928 S 4.1 0.4 3:28.16 prometheus
|
24788 couchba+ 20 0 1478148 341420 16988 S 3.6 0.5 1:12.87 projector
|
24645 couchba+ 20 0 9924 6540 1320 S 2.4 0.0 1:10.78 godu
|
24808 couchba+ 20 0 3268680 155668 62172 S 2.0 0.2 0:16.84 cbq-engine
|
24593 couchba+ 20 0 3356620 154548 23300 S 1.1 0.2 1:02.62 beam.smp
|
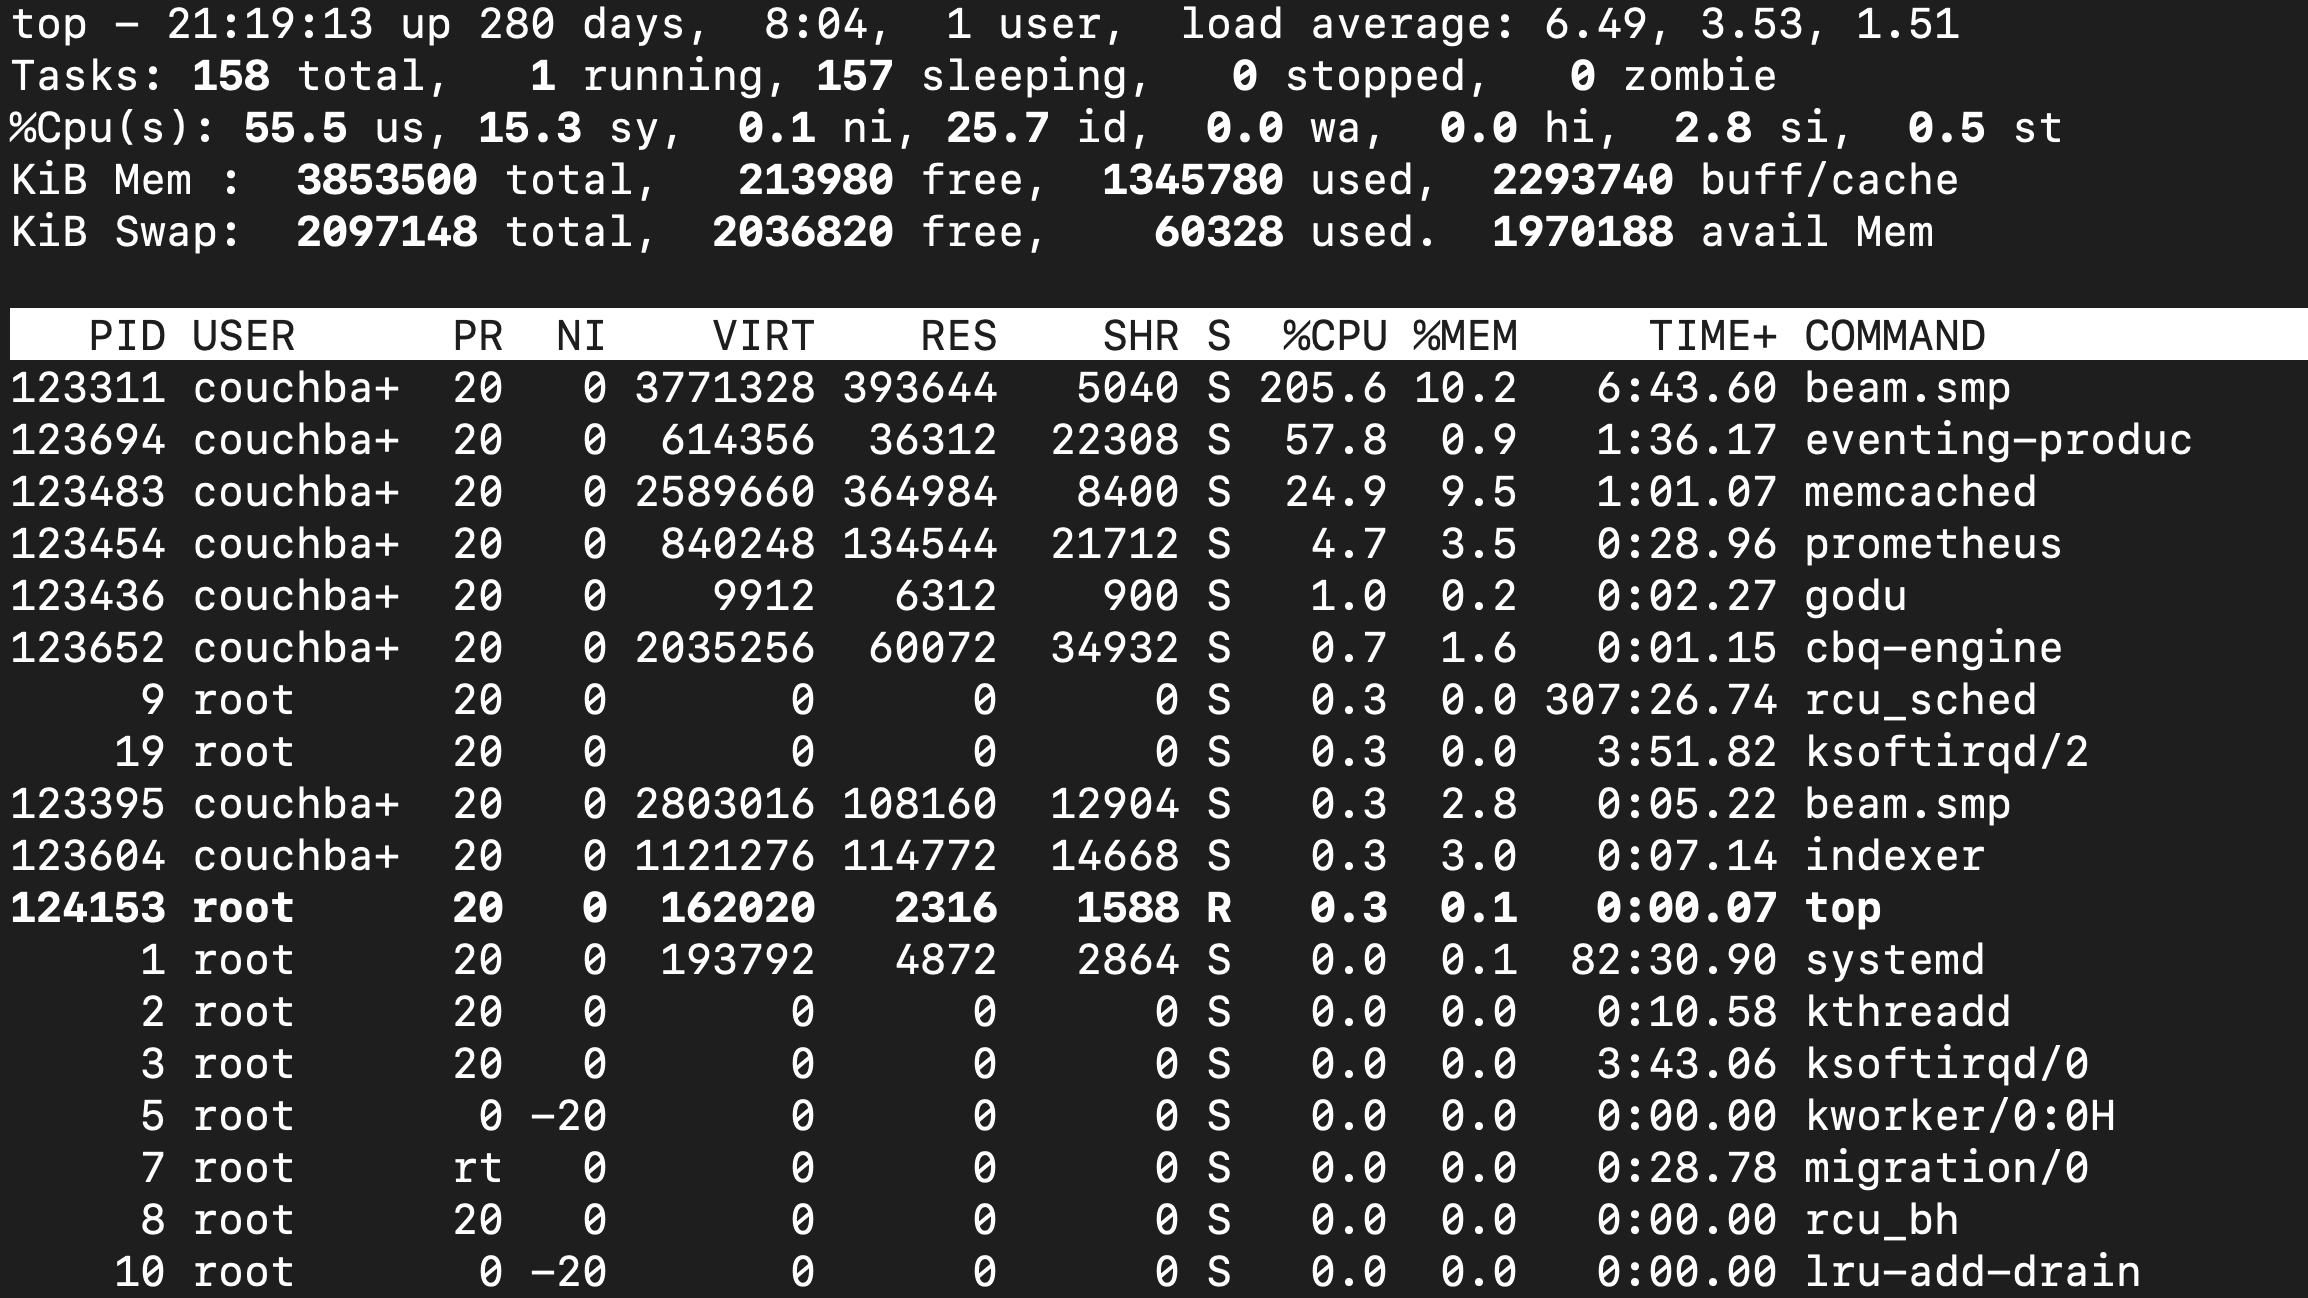
ec2-user@ec2-3-99-49-144.ca-central-1.compute.amazonaws.com
private IP 10.21.25.181
top - 21:11:39 up 40 days, 22:56, 1 user, load average: 10.23, 9.86, 7.54
|
Tasks: 172 total, 2 running, 112 sleeping, 0 stopped, 0 zombie
|
%Cpu(s): 69.7 us, 12.0 sy, 0.0 ni, 15.7 id, 0.0 wa, 0.0 hi, 2.5 si, 0.0 st
|
KiB Mem : 65150468 total, 55771548 free, 3299520 used, 6079400 buff/cache
|
KiB Swap: 0 total, 0 free, 0 used. 61646148 avail Mem
|
PID USER PR NI VIRT RES SHR S %CPU %MEM TIME+ COMMAND
|
1291 couchba+ 20 0 4760200 588008 7832 S 494.2 0.9 128:00.01 beam.smp
|
1917 couchba+ 20 0 1926956 168300 37932 S 130.0 0.3 31:16.83 eventing-produc
|
1480 couchba+ 20 0 4842616 855456 15140 S 31.6 1.3 16:56.56 memcached
|
1812 couchba+ 20 0 2585180 492080 28360 S 9.5 0.8 4:14.74 indexer
|
1695 couchba+ 20 0 1110404 261664 41676 S 5.9 0.4 3:27.25 prometheus
|
1846 couchba+ 20 0 1479620 347520 16740 S 3.4 0.5 1:13.83 projector
|
1675 couchba+ 20 0 9924 6356 1320 S 3.1 0.0 1:18.73 godu
|
1623 couchba+ 20 0 3365920 161164 23252 S 1.6 0.2 0:50.55 beam.smp
|
ec2-user@ec2-15-223-36-53.ca-central-1.compute.amazonaws.com
private IP 10.21.26.101
top - 21:12:24 up 40 days, 22:56, 2 users, load average: 11.13, 10.42, 7.99
|
Tasks: 175 total, 1 running, 118 sleeping, 0 stopped, 0 zombie
|
%Cpu(s): 72.4 us, 12.6 sy, 0.0 ni, 12.5 id, 0.0 wa, 0.0 hi, 2.4 si, 0.0 st
|
KiB Mem : 65150468 total, 55673608 free, 3327924 used, 6148936 buff/cache
|
KiB Swap: 0 total, 0 free, 0 used. 61567400 avail Mem
|
PID USER PR NI VIRT RES SHR S %CPU %MEM TIME+ COMMAND
|
9252 couchba+ 20 0 4855972 658480 8080 S 510.8 1.0 137:56.89 beam.smp
|
10242 couchba+ 20 0 1856856 70124 37904 S 136.8 0.1 33:17.71 eventing-produc
|
9891 couchba+ 20 0 4842616 855484 14968 S 30.9 1.3 16:08.45 memcached
|
10141 couchba+ 20 0 2666272 503560 28644 S 9.6 0.8 4:41.15 indexer
|
10075 couchba+ 20 0 1110852 263224 42184 S 6.2 0.4 3:30.55 prometheus
|
10171 couchba+ 20 0 1478020 343024 16732 S 4.5 0.5 1:15.10 projector
|
10056 couchba+ 20 0 9924 6496 1252 S 3.5 0.0 1:20.45 godu
|
10004 couchba+ 20 0 3370252 180976 23364 S 1.3 0.3 0:51.44 beam.smp
|
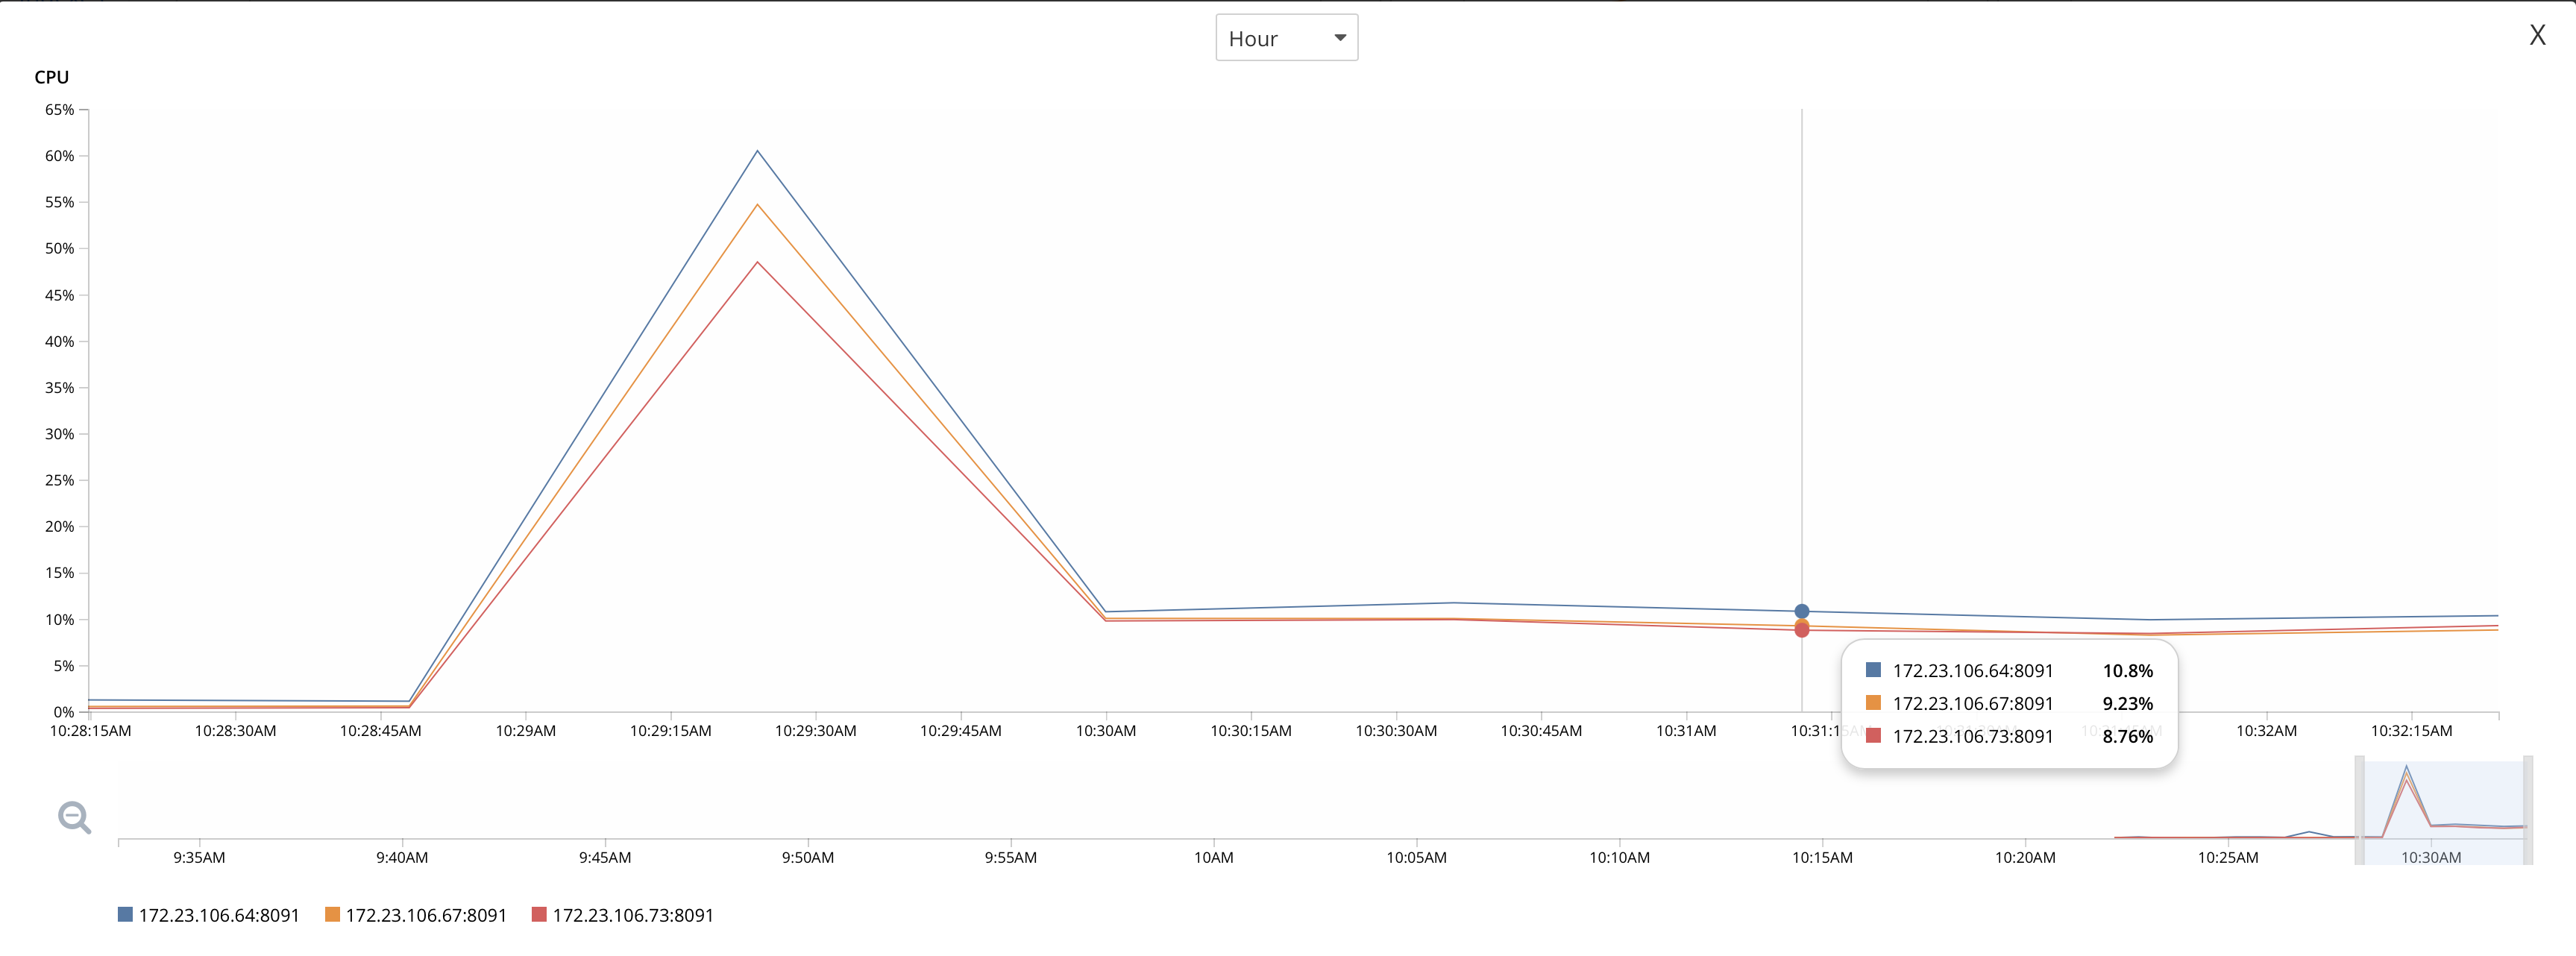
I have attached CPU utilization pictures from both AWS and the Couchbase UI.
Attachments


| For Gerrit Dashboard: MB-48702 | ||||||
|---|---|---|---|---|---|---|
| # | Subject | Branch | Project | Status | CR | V |
| 162695,3 | MB-48702: Fix goroutine leak due to bucket delete and recreate | unstable | eventing | Status: MERGED | +2 | +1 |
| 162931,3 | MB-48702: Fix goroutine leak due to bucket delete and recreate | cheshire-cat | eventing | Status: MERGED | +2 | +1 |