Details
-
Bug
-
Status: Closed
-
Major
-
Resolution: Not a Bug
-
7.1.0
-
Triaged
-
1
-
Unknown
-
KV 2021-Nov
Description
Note: Initially opened on performance variation between, that has been addressed, but now tracking the issue where replica item count does not reach active
—
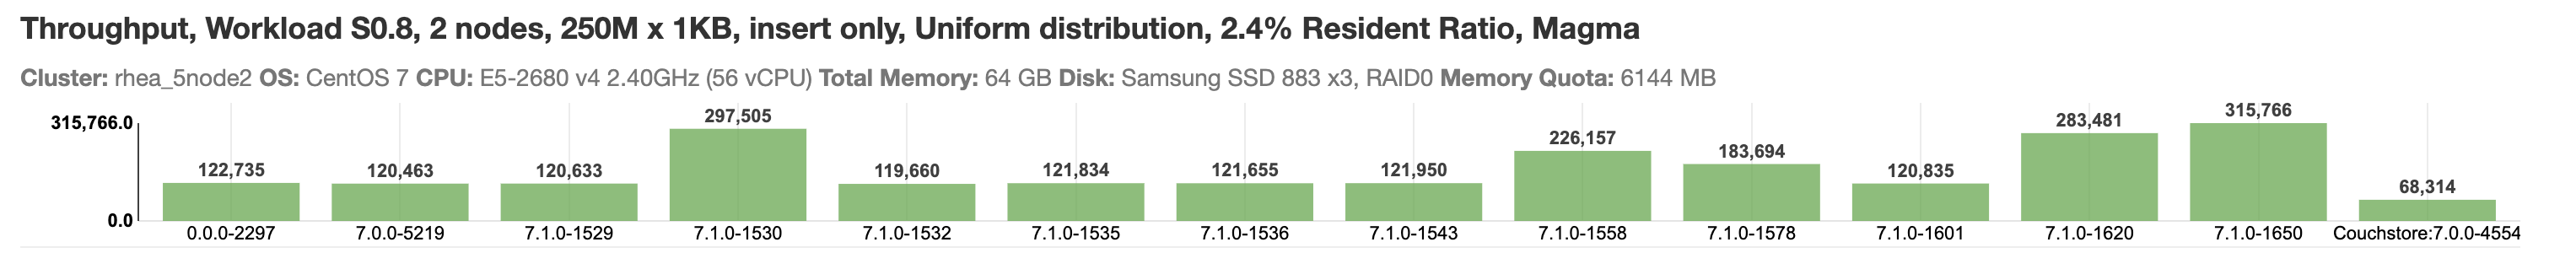
In Magma insert only tests, we see high performance variation.
http://172.23.123.237/#/timeline/Linux/hidd/S0/all
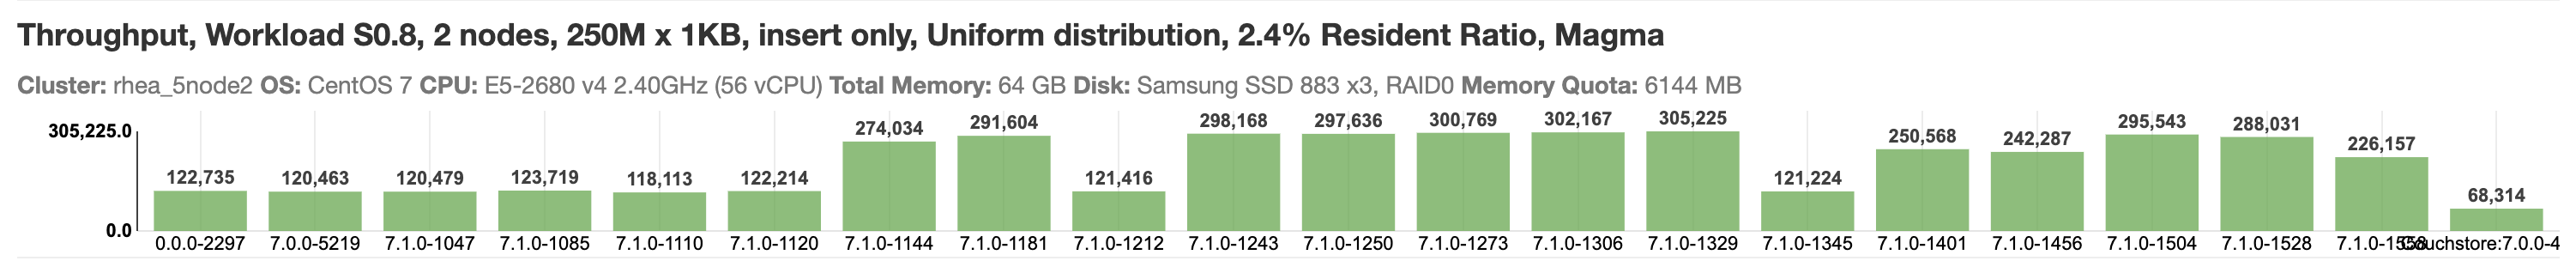
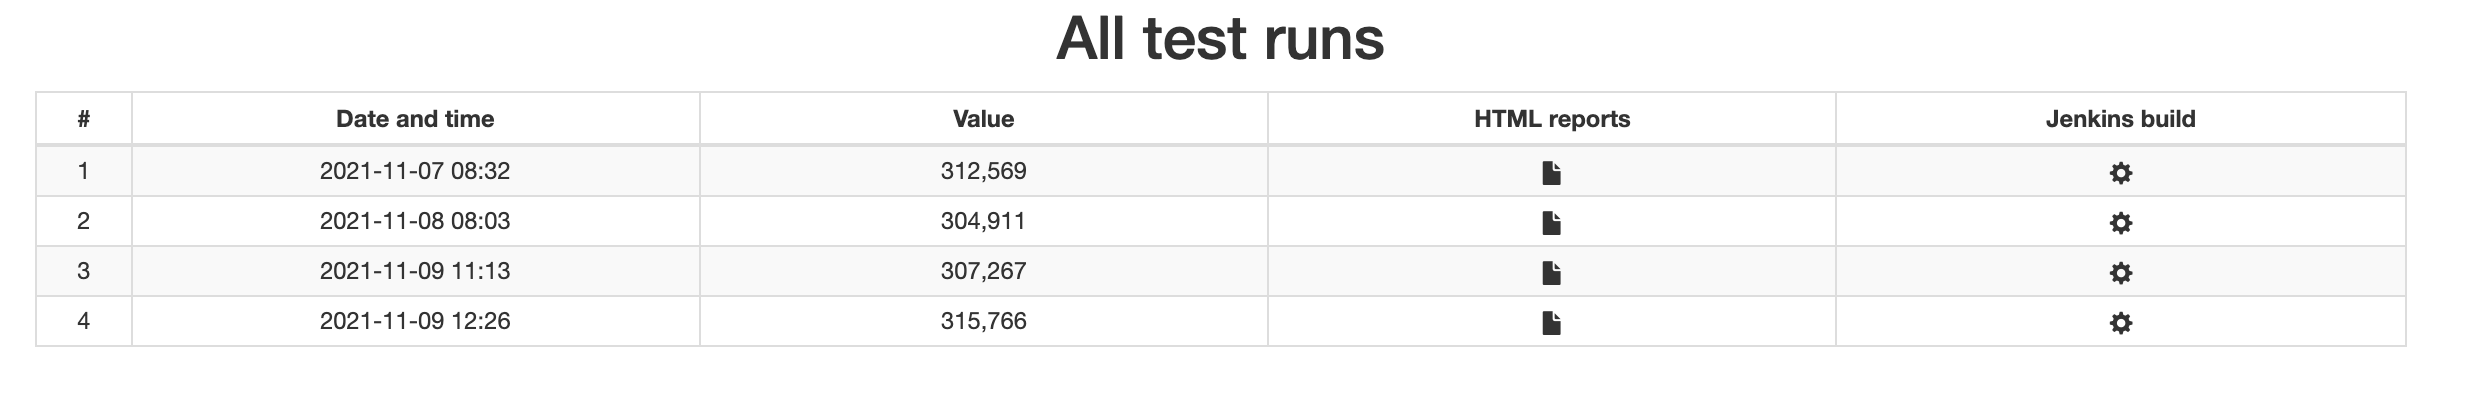
In the latest runs with build 7.1.0-1558, the throughput changed from 122K to 226K.
Build | Throughput | Job |
---|---|---|
7.1.0-1558 | 122,966 | http://perf.jenkins.couchbase.com/job/rhea-5node2/1538/ |
7.1.0-1558 | 226,157 | http://perf.jenkins.couchbase.com/job/rhea-5node2/1539/ |
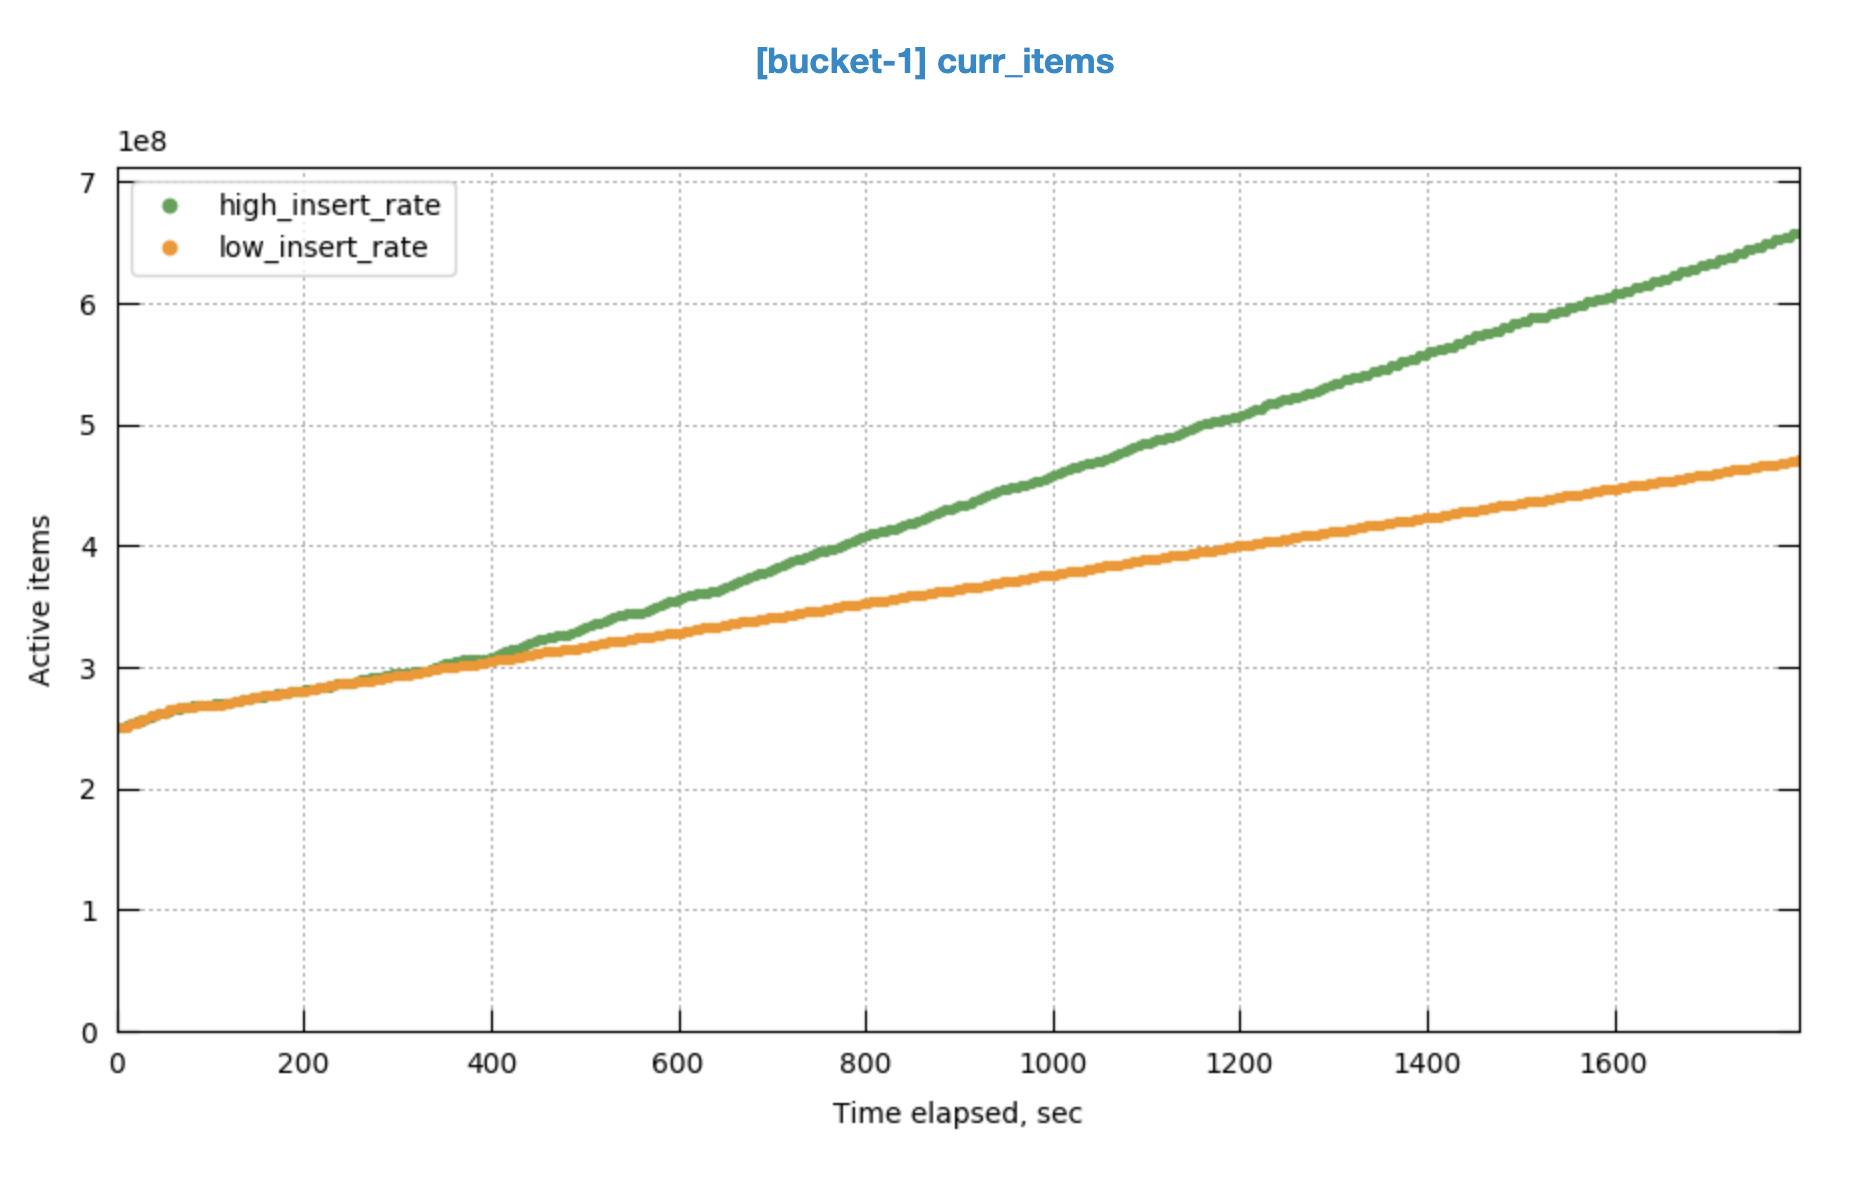
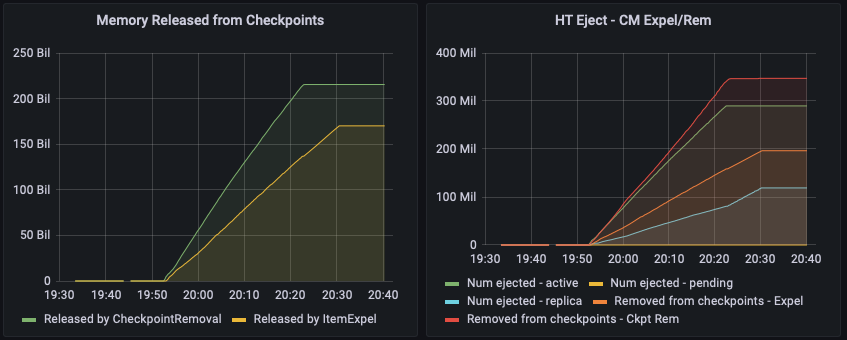
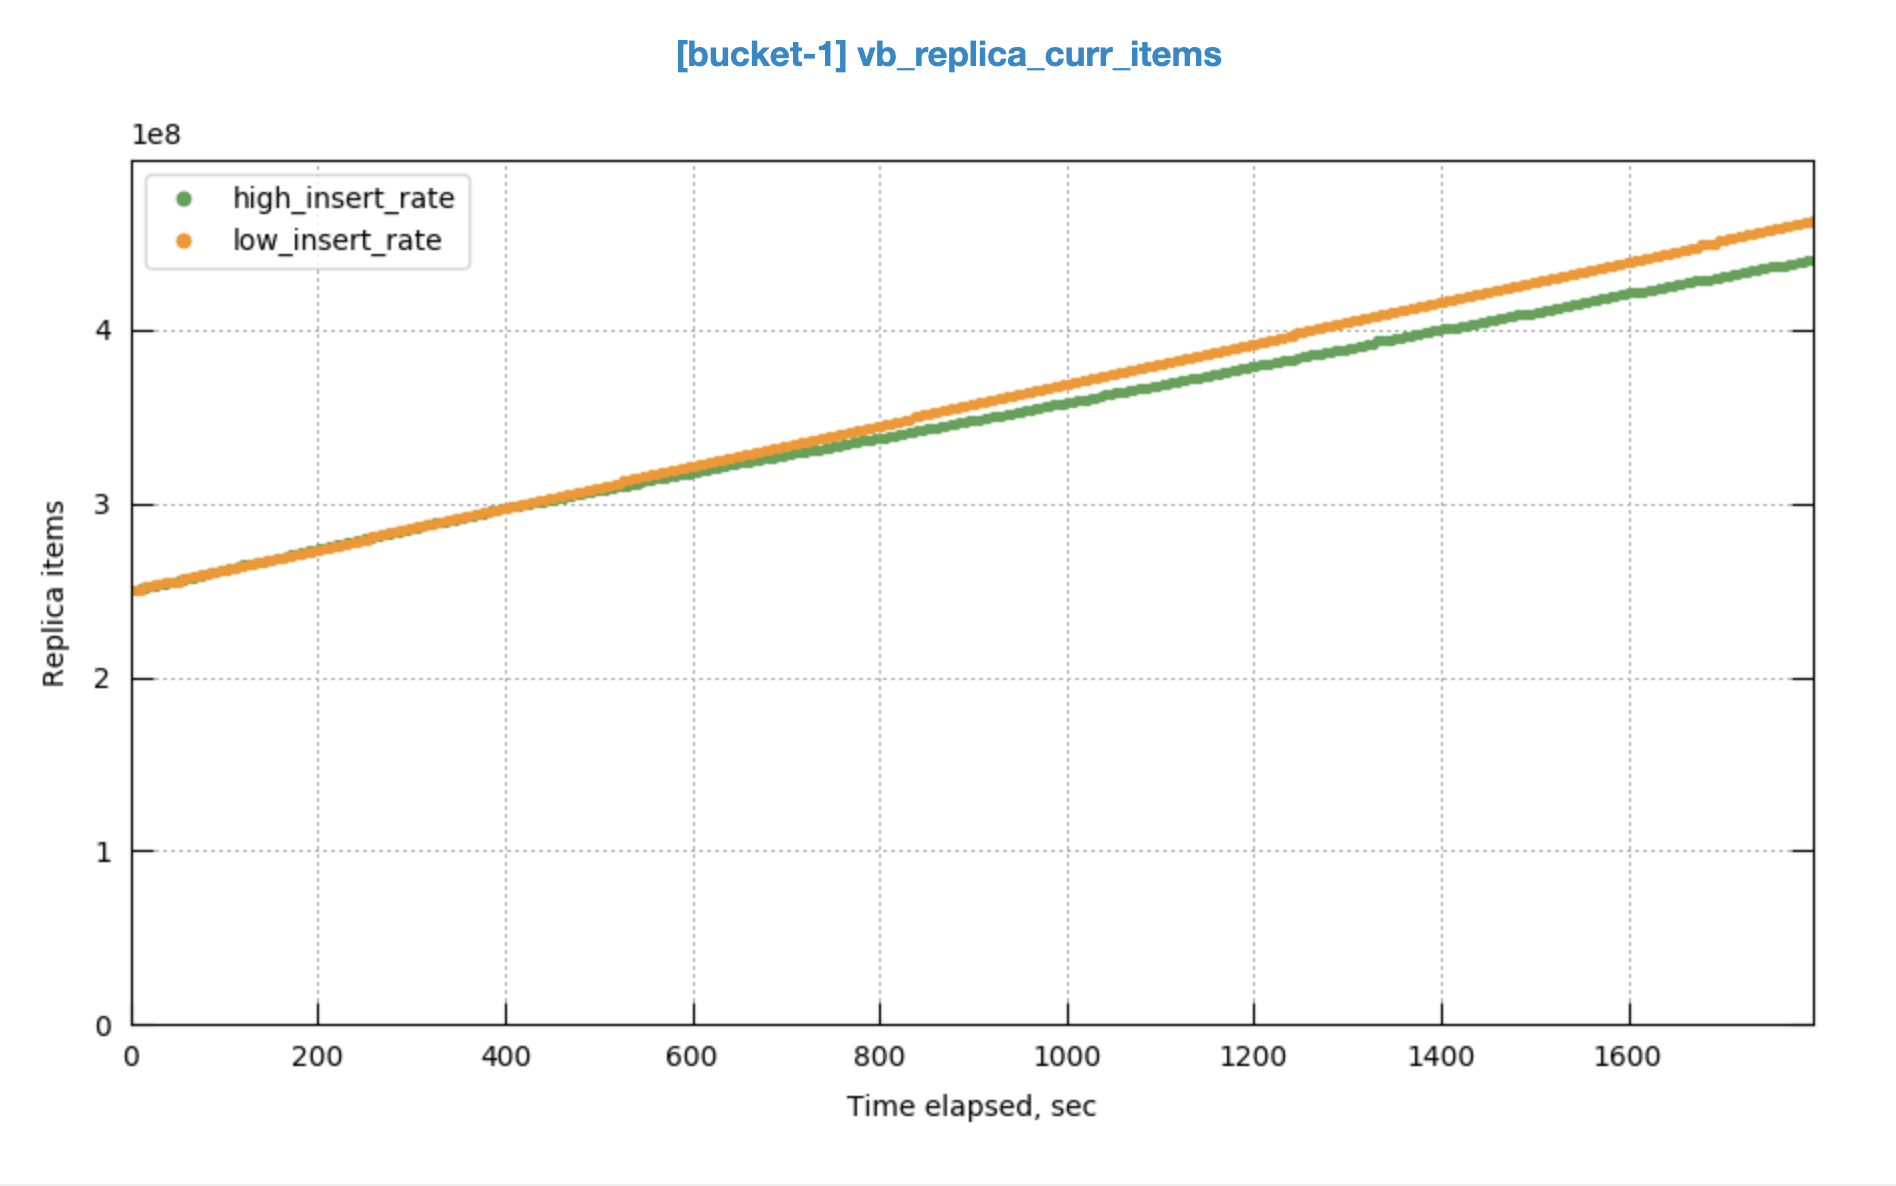
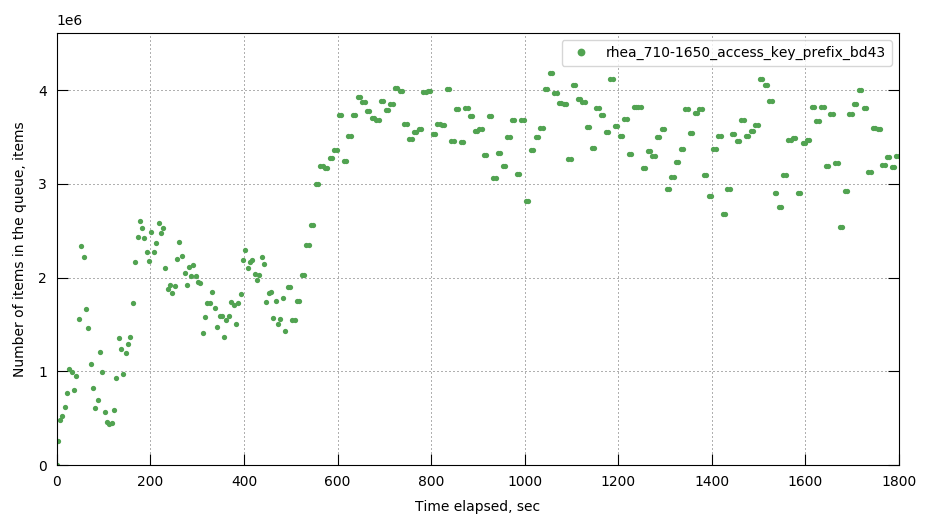
In the run having higher throughput, replica sync rate can't catch up.
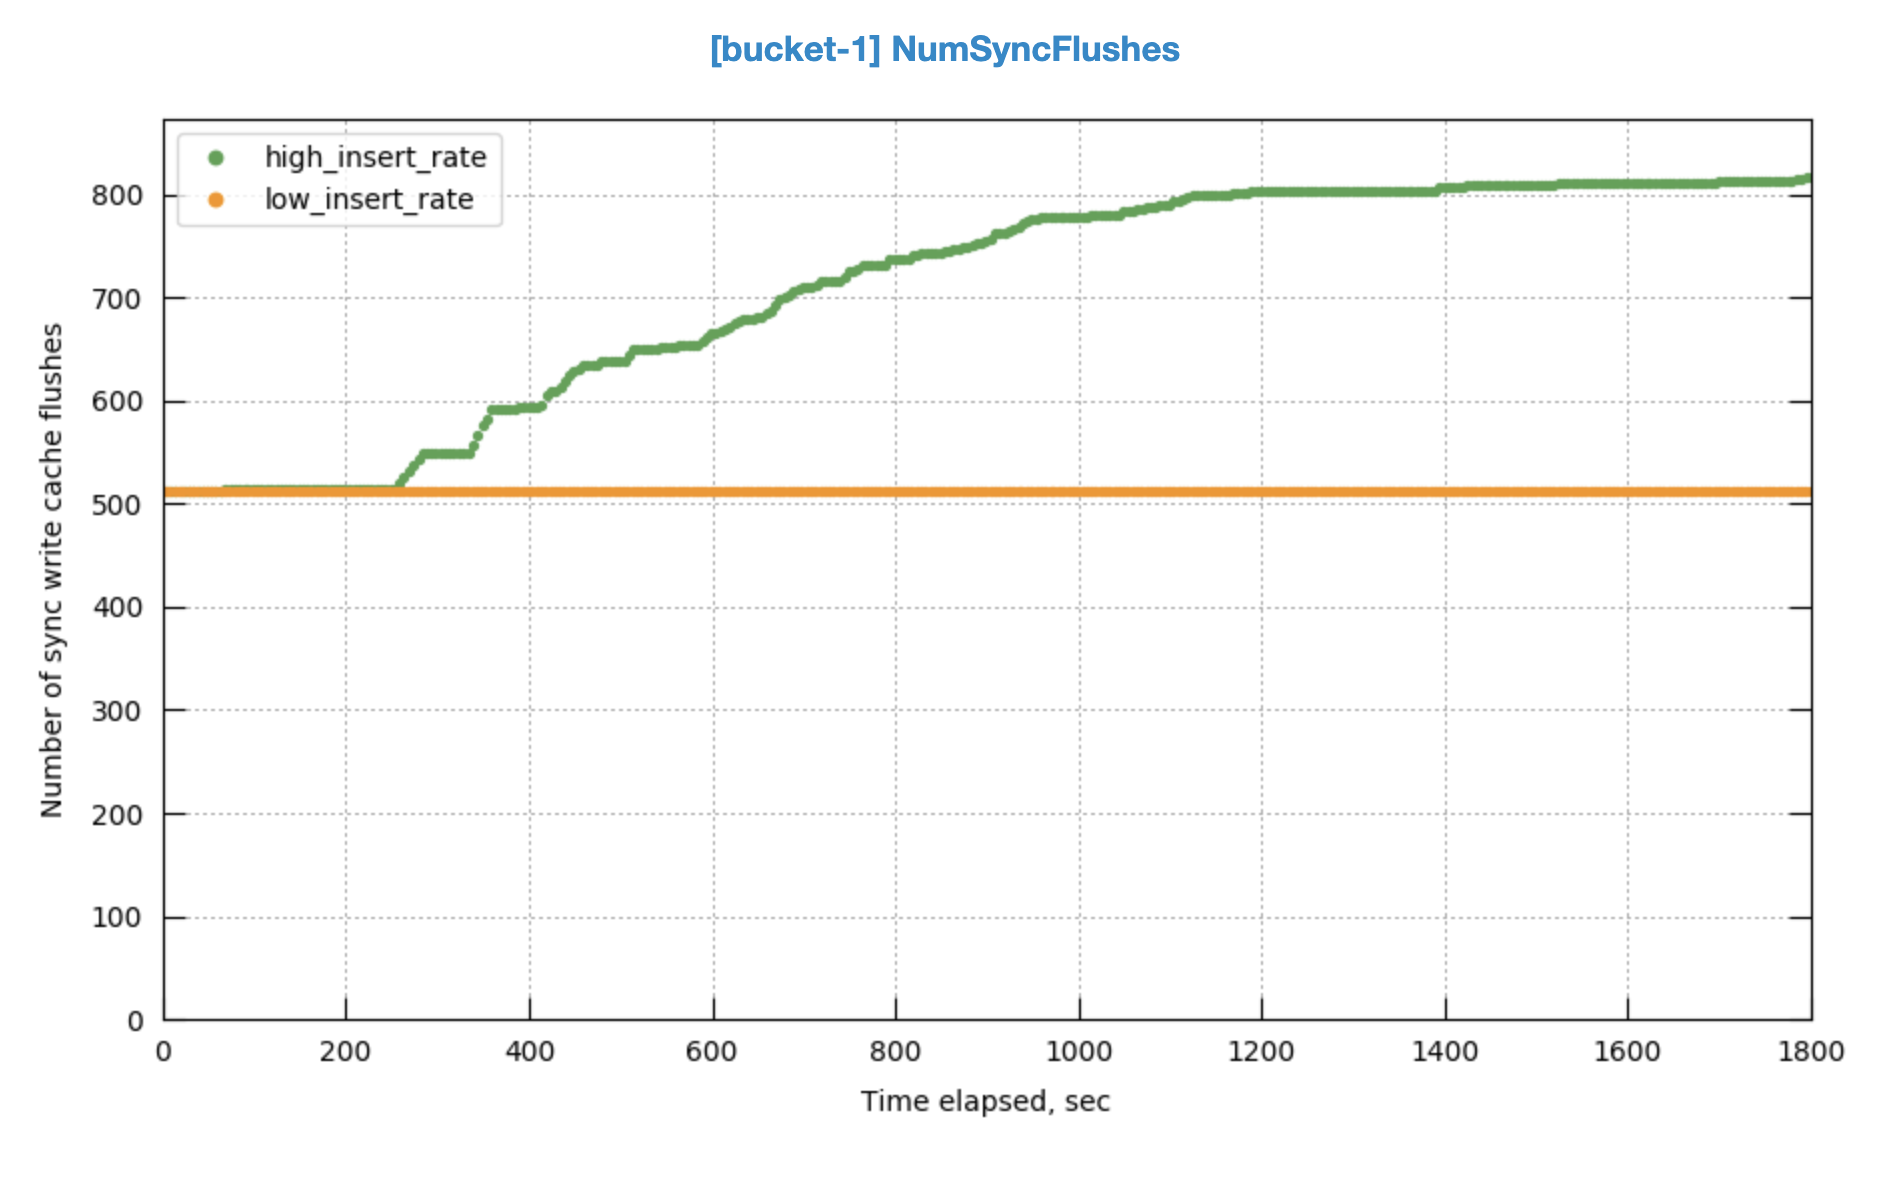
There are more sync write flushes after a certain point.
Sarath Lakshman
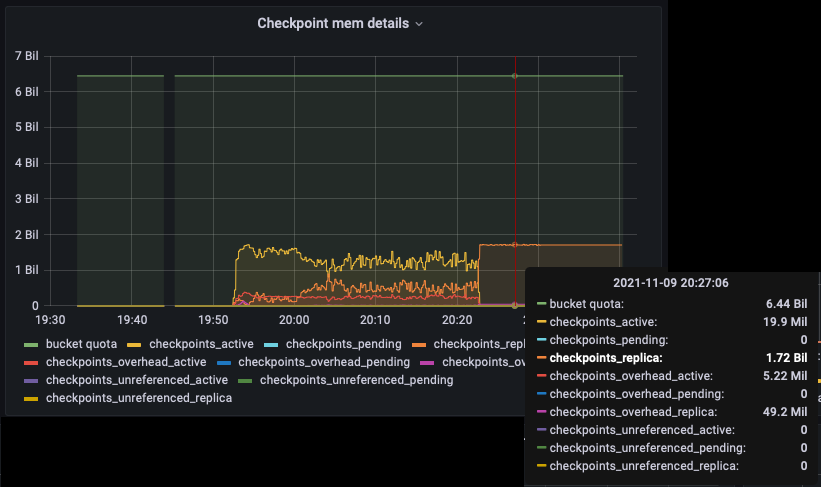
Please take a look. Is there a way we can change checkpoint settings? It looks like the runs can go to different modes (or code paths), even with the same build.
Attachments
- MB-49170_build-1729.png
- 485 kB
Issue Links
- relates to
-
MB-49262 Checkpoint expel stops before low mark
-
- Closed
-
Activity
I did the bisection. It looks like the issue started in build 1529.
Build 1528: http://perf.jenkins.couchbase.com/job/rhea-5node2/1563/
Build 1529: http://perf.jenkins.couchbase.com/job/rhea-5node2/1568/
There is no magma change between these builds. For kv-engine, there isn't any relevant change. Bo-Chun Wang Could you rerun the builds and disect further?
I have run both runs two times. I'm not able to bisect further.
Build | Throughput | Job |
---|---|---|
7.1.0-1528 | 288,031 | http://perf.jenkins.couchbase.com/job/rhea-5node2/1526/ |
7.1.0-1528 | 307,404 | http://perf.jenkins.couchbase.com/job/rhea-5node2/1563/ |
7.1.0-1529 | 120,653 | http://perf.jenkins.couchbase.com/job/rhea-5node2/1566/ |
7.1.0-1529 | 120,633 | http://perf.jenkins.couchbase.com/job/rhea-5node2/1568/ |
The write/read write throughput is improved due to block cache-related changes in the recent builds
We observe that replication is lagging behind significantly now.
http://cbmonitor.sc.couchbase.com/reports/html/?snapshot=rhea_710-1650_access_key_prefix_bd43
Daniel Owen It would be good if somebody from KV team can take a look at the reason for replication lagging behind.
Sarath Lakshman Not sure I follow the statement that replication is lagging behind "now" - from the above snapshot (http://cbmonitor.sc.couchbase.com/reports/html/?snapshot=rhea_710-1650_access_key_prefix_bd43) I see the following DCP replication queue graph:
i.e. there's a reasonable steady number of items waiting to be replicated from 600s onwards - between 0 and 600,000 at any one time.
Looking at the disk queue (i.e. how many items are sitting in CheckpointManager waiting to be persisted to disk, we see the following:
i.e. the number of outstanding items is hovering around 3-4 million; items just haven't been persisted yet.
Note also that earlier runs of this test are probably suffer from MB-47318 which results in problems with DCP replication - this affects builds 7.1.0-1571 to 7.1.0-1650 (thanks Dan).
We probably want a linux perf profile to see what the various threads are doing if we want to further see why disk queue is reasonably large.
We started observing replica_curr_items (410M) much lower than cur_items (800M) for the last couple of months since we removed the cursor_dropping_upper_mark=100 workaround (For last couple of builds pre 7.1.0-1620, we observed the replica and active curr items mostly matching. It could be due to slow writes in magma resulting in overall writes running at slower rates).
But in general, the test is close to saturating the SSD I/O bandwidth. The write queue growth is due to the I/O saturation. The active current items count is quickly increasing while the replica is catching up slowly. Maybe this is expected behavior for unthrottled write workload since we do not have an incoming mutation throttler for active vbucket while replica vbucket is lagging behind the active vbucket curr items.
Hi Bo-Chun Wang,
Discussed with Dave Rigby and agreed that would be good to get a rerun on a newer build that does not suffer from the DCP replication regression. (i.e. 7.1.0-1650+)
Be good to get 3 runs on the same build to gain confidence in the result.
thanks
I have re-run the test with build 7.1.0-1650, and the results are consistent.
The latest result is better, too.
Hi Bo-Chun Wang,
Thanks for setting off the runs. Given its a throughput test - I assume the higher the value the better.
Also given the results are consistent will mark as resolved.
Daniel Owen Is the replica curr_items lagging behind active curr_items expected behavior?
The value is higher because replica is lagging behind and active is able to process more items/sec.
Looking at the prometheus metrics via Grafana, it looks like the replica checkpoints are at the checkpoint high watermark (Checkpoint quota not shown is 30% of bucket quota or 1.93GB; the checkpoint high watermark is 90% of the checkpoint quota or 1.74GB:
(Node .27 is essentially the same)
i.e. the replica checkpoints are consuming essentially all of the Checkpoint memory quota. Typically this memory is freed either by deleting entire checkpoints once they are closed and unreferenced; or by expelling items which are clean (have been persisted) if the entire checkpoint isn't yet unreferenced (Thirdly by cursor-dropping but that only helps if the replication cursors are the ones holding up memory usage).
Note that checkpoint memory freeing (either entire checkpoint real or item expelling) has also stopped:
Re-opening this as while the perf variation seems gone there is an issue with active & replica item counts...
Suspect that the high replica checkpoint memory usage might be related to MB-49262 - as instead of replica checkpoint memory dropping to the checkpoint low watermark, it's hovering around the high...
Checkpoint memory state at the time of cbcollect, node .26:
ep_checkpoint_memory: 1718899382
|
ep_checkpoint_memory_ratio: 0.3
|
ep_checkpoint_memory_recovery_lower_mark: 0.6
|
ep_checkpoint_memory_recovery_upper_mark: 0.9
|
ep_checkpoint_memory_unreferenced: 0
|
ep_max_size: 6442450944
|
- cm_quota: 1932735283,2 (ep_max_size * ep_checkpoint_memory_ratio)
- recovery_upper_mark_bytes: 1739461754,88 (cm_quota * recovery_upper_mark)
(checkpoint_memory < recovery_upper_mark_bytes) so from the checkpoint PoV we aren't expected to recover anything in that state.
But, the run isn't stuck, replication is proceeding.
Update
Daniel Owen Is the replica curr_items lagging behind active curr_items expected behavior?
The value is higher because replica is lagging behind and active is able to process more items/sec.
That all depends on the particular test.
If we consider a single frontend connection load, then replication (which is handled on 1 connection per replication link) is expected to perform the same.
But, in general load tests (and this one isn't an exception) perform a bulk load over multiple frontend connections for reaching high throughput.
Imagine a 2-node cluster, 1 replica. Maybe you load the active items over 10 frontend connections, but replication still happens on a single connection, so the replication throughput is expected to be much lower than the frontend throughput.
In that case it's pretty normal to see replica-items lagging behind active-items during the bulk load.
I'm repeating the test on a build that contains the fix for MB-49262 for assessing the current state.
Sarath Lakshman
Run http://perf.jenkins.couchbase.com/job/rhea-5node2/1679/console on build 1729 (contains the fix for MB-49262).
That seems to run smooth. I confirm that replication is still in progress when the test is shut down, but that seems the only reason for replication not completing:
From the run console, the shutdown timing matches the time where we stop getting live stats from the cluster:
16:18:38 2021-11-22T07:18:40 [INFO] Terminating Celery workers
|
16:18:40 2021-11-22T07:18:40 [INFO] Killing the following process: celery
|
16:18:40 2021-11-22T07:18:40 [INFO] Running cbcollect_info with redaction
|
16:18:40 2021-11-22T07:18:40 [INFO] Running cbcollect_info with redaction
|
16:18:40 2021-11-22T07:18:40 [INFO] Running cbcollect_info with redaction
|
16:18:40 2021-11-22T07:18:40 [INFO] Running cbcollect_info with redaction
|
16:18:40 2021-11-22T07:18:40 [INFO] Running cbcollect_info with redaction
|
16:18:40 2021-11-22T07:23:11 [INFO] Resetting kernel memory settings
|
16:23:11 2021-11-22T07:23:11 [INFO] Changing GRUB configuration
|
16:23:11 2021-11-22T07:23:20 [INFO] Rebooting the node <-- !!
|
Sarath Lakshman I'm resolving this as "normal behaviour" as per previous comments.
Please see MB-36370 for details on the latest DCP performance assessment.
Thanks
Thanks Paolo Cocchi for looking into this.
Bo-Chun Wang Note that Paolo observed the following in the last test run:
I confirm that replication is still in progress when the test is shut down, but that seems the only reason for replication not completing:
I think we need to look into this - I would expect the that the test should wait until replication has completed. Otherwise we potentially tracking misleading metrics if the work to replicate fully is not included in the measurements..
As a concrete example, say we make some change in KV-Engine which means we can process client requests (and persist them to disk) 10% faster; but at the same time we slow down DCP replication by 20%. That might give a score on this test which is 10% better, however in reality we have overall regressed the system.
Thanks Paolo Cocchi Dave Rigby. I think we should update the test to wait for replication to finish for measuring throughput to report a realistic number.
Currently, our throughput tests are measuring how many client requests the cluster can handle, and I think the number is important. The same concept is applied to latency tests. We measure how fast client requests can be completed. The latency is measured when the requests are completed but not when replication is done. I agreed DCP replication performance is important, but we should measure the two things separately.
- client request process performance (the throughput we measure)
- dcp replication performance
If the client request process performance is 10% slower and DCP replication performance is 20% faster, I don't think it means the overall system performance is better.
Rebalance tests are one method we use to measure DCP replication performance. If there are any ideas about how we should measure DCP replication performance, please let me know. For this particular test (insert only), another thing we can try is to do a run without replication.
We ideally want to measure the sustainable write throughput (which includes replication not lagging). This will require the test framework to slow down and adjust the requests rate sufficient enough to balance replication. Maybe reducing the number of clients may slightly help here. If we wait for replication to complete for the measurement, the throughput number itself will not be relevant, but it can be used as a number for catching regressions.
Since this is a sanity test for the purpose of specially measuring storage engine insert rate, changing the test to no replica config also should be okay.
I agree with both of you - we want to see how fast KV-Engine can process client requests (and under what latency), but we also want to measure how fast KV-Engine can handle the full lifetime of a request (processing off network, writing to local disk; replicating to remote cluster and writing to disk there).
As Bo-Chun suggested, the first type of test doesn't really care about replication; so we could simply run without replicas; measuring the throughput where we just process the request on the active node and write it to disk.
The second type of test is pretty much the test we have here (I believe); however we do want to make sure the performance of the system can be sustained; and we are not building up backlogs which only recover when the workload stops running - i.e. if the test ran for a longer period we would see a drop in throughput long-term.
Note that KV-Engine will already apply backpressure to the client(s) if persistence / replication cannot keep up (and Bucket memory has been saturated). This back pressure should be better behaved in Neo due to the changes done by Paolo Cocchi and James Harrison recently - namely giving outstanding mutations to be written to disk / replicated (CheckpointManager) their own sub-quota of the overall Bucket quota. We are still tuning this, but currently the CheckpointManager gets a maximum of 30% of the overall Bucket quota in Neo; whereas previously it could in theory consume the entire Bucket quota (leaving essentially zero memory for caching recently accessed items / disk backfills for other DCP clients etc).
I mention this because if we have perf tests which KV-Engine cannot sustain the operation rate, but for the (short) duration they run there was sufficient Bucket Quota in 7.0.0 to cache dirty / queued for replication items, we could observe lower throughput under Neo as we would start applying back-pressure to clients "sooner". I would argue that this isn't really a regression, the test simply didn't run for long enough in the first place as a similar drop in throughput would be seen in 7.0.0, if the test duration was extended.
Just a small addition. I do get Bo's PoV on isolating "client request process performance" tests from "dcp replication performance". But the problem is that the frontend throughput is directly affected by replication being in place (for a number of reasons, eg frontend and replication race on Checkpoints). That is easily observable even on a very simple cluster_run. So I'm not sure how representative a 0-replica ingestion test would be.
Could you bisect this to the last good build where the numbers are stable?
It is not very obvious is any magma or kv change lead to inconsistent throughput.
The NumSyncFlushes is a side effect of large writes in active buckets and larger write queue when replica didn't catch up.