Details
-
Bug
-
Resolution: Fixed
-
 Critical
-
7.1.0
-
None
-
Triaged
-
1
-
Yes
-
KV 2021-Nov
Description
Ingestion stuck after entering a hard-oom phase, which seems caused by broken mem-usage stats:
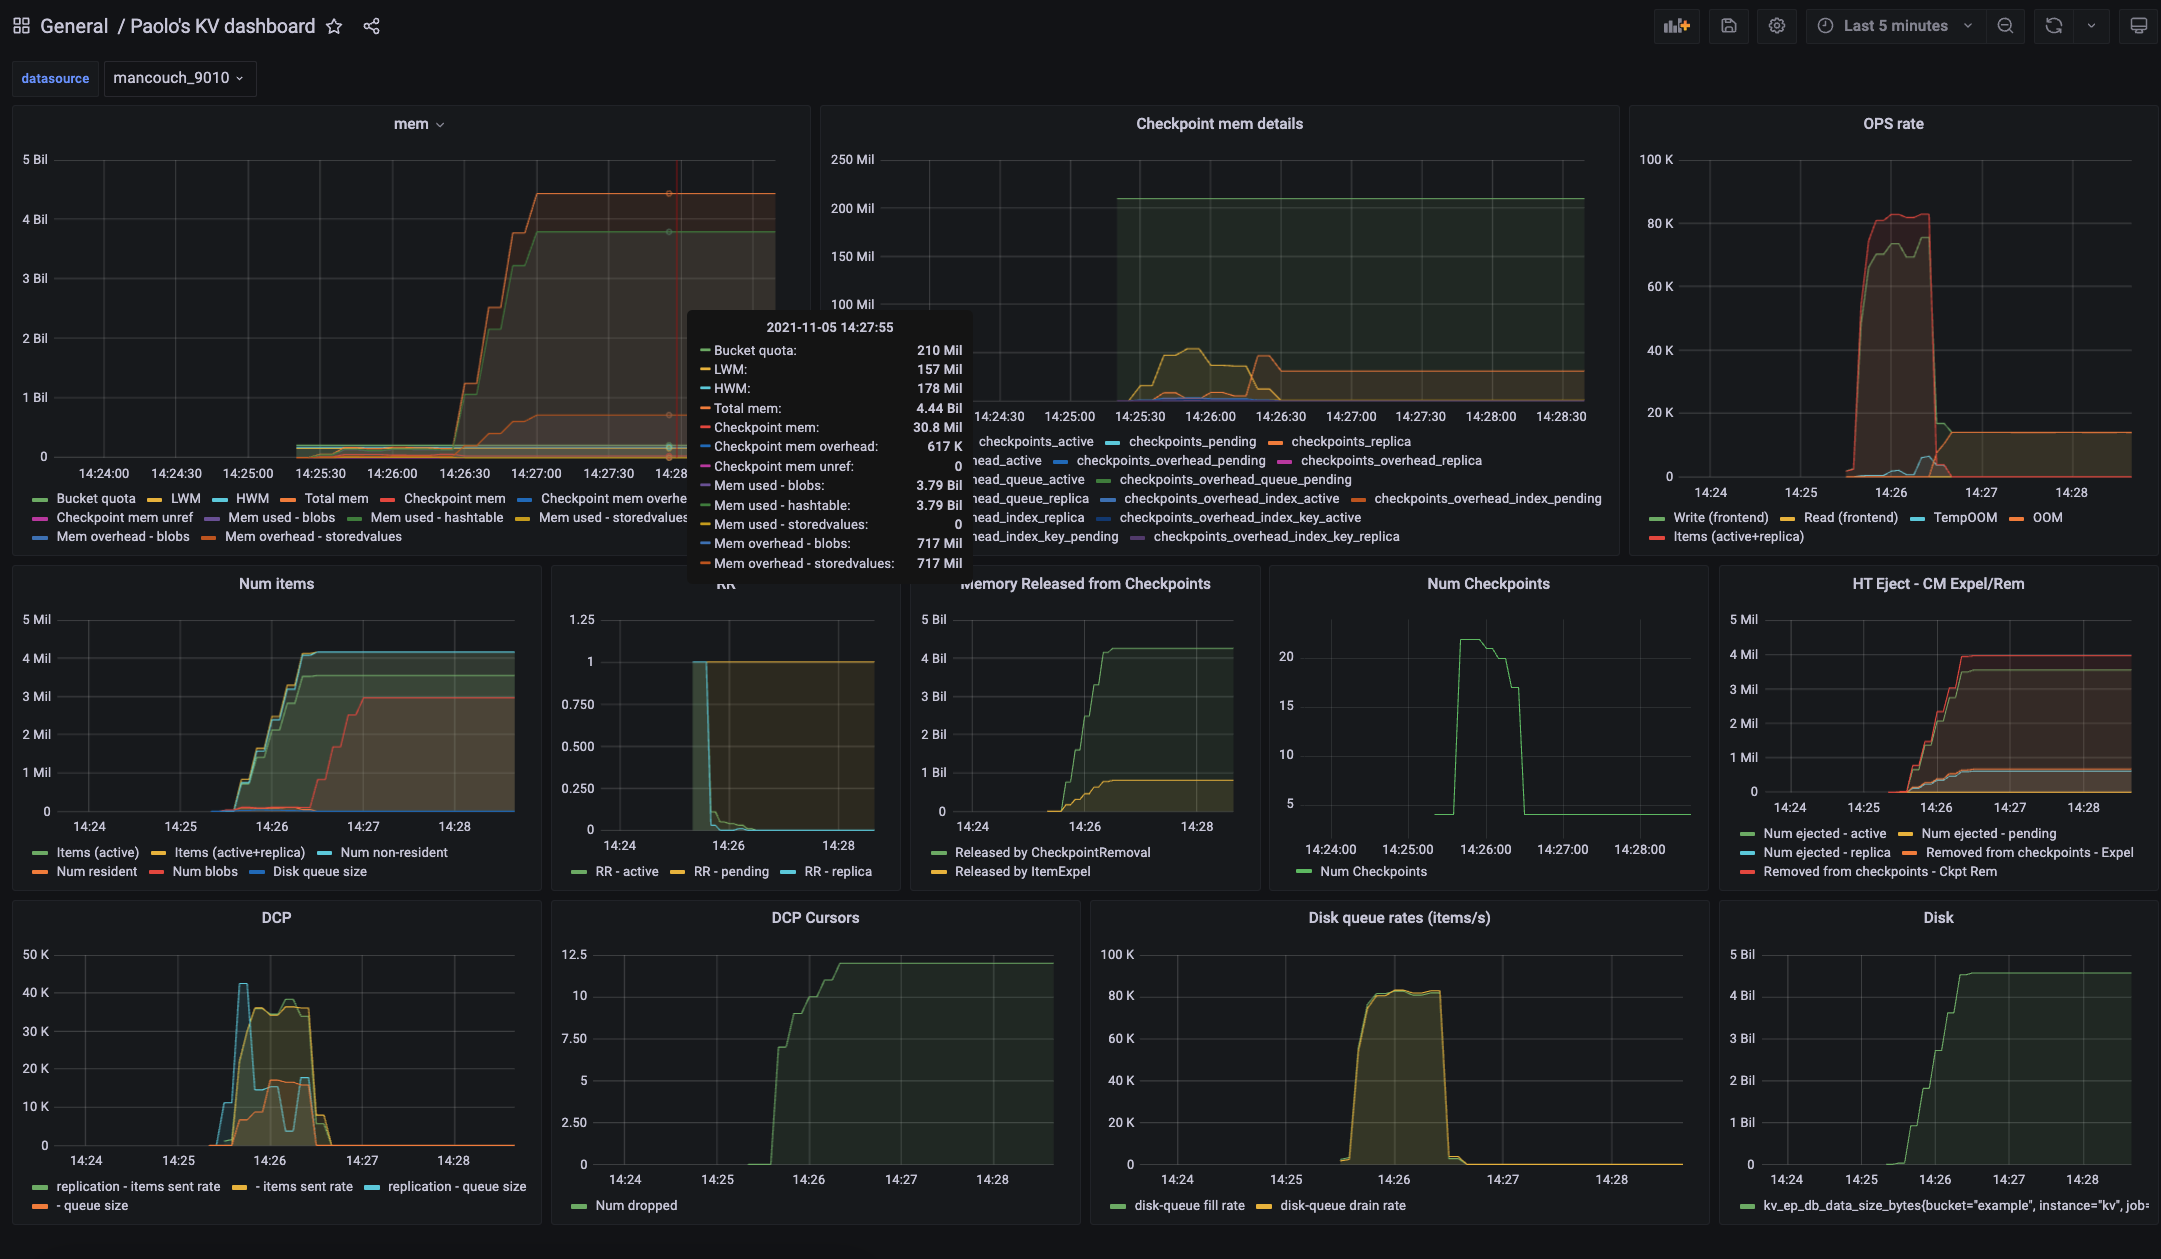
Note that the overall MemUsed spikes in conjunction with HashTable-MemUsed.
Also note that at first look CM mem tracking doesn't seem involved, as all shows up fine on the CM mem-usage charts.
Also, live-debugging shows that memory releasing from replica CMs doesn't happen just because that's not required by EPConfig params:
(gdb) p checkpointQuota
|
$4 = 62914564
|
(gdb) p usage
|
$5 = 38603864
|
(gdb) p recoveryThreshold
|
$6 = 56623108
|
size_t KVBucket::getRequiredCheckpointMemoryReduction() const {
|
const auto checkpointMemoryRatio = getCheckpointMemoryRatio();
|
const auto checkpointQuota = stats.getMaxDataSize() * checkpointMemoryRatio;
|
const auto recoveryThreshold =
|
checkpointQuota * getCheckpointMemoryRecoveryUpperMark();
|
const auto usage = stats.getCheckpointManagerEstimatedMemUsage();
|
|
|
if (usage < recoveryThreshold) {
|
return 0;
|
}
|
..
|
}
|
Code reference
[Bucket MemUsed]
STAT(mem_used, , bytes, , )
|
size_t memUsed = stats.getPreciseTotalMemoryUsed();
|
collector.addStat(Key::mem_used, memUsed);
|
size_t EPStats::getPreciseTotalMemoryUsed() const {
|
if (isMemoryTrackingEnabled()) {
|
return cb::ArenaMalloc::getPreciseAllocated(arena); <-- !!
|
}
|
return size_t(std::max(size_t(0), getCurrentSize() + getMemOverhead()));
|
}
|
|
|
static size_t getPreciseAllocated(const ArenaMallocClient& client) {
|
return trackingImpl::getPreciseAllocated(client);
|
}
|
|
|
size_t JEArenaCoreLocalTracker::getPreciseAllocated(
|
const ArenaMallocClient& client) {
|
for (auto& core : coreAllocated[client.index]) {
|
for (size_t domain = 0; domain < size_t(MemoryDomain::Count);
|
domain++) {
|
auto value = (*core.get())[domain].exchange(0);
|
clientData[client.index]->clientEstimatedMemory.fetch_add(value);
|
clientData[client.index]
|
->clientDomainEstimatedMemory[domain]
|
.fetch_add(value);
|
}
|
}
|
|
|
// See the comment in getEstimatedAllocated regarding negative counts, even
|
// in this case where we are summing up all core counters there is still
|
// the possibility of seeing a negative value based. After we've observed
|
// a core counter and summed it into the global count, it's not
|
// impossible for an allocation to occur on that core and then be
|
// deallocated on the next core, so our summation observes more
|
// deallocations than allocations.
|
return size_t(
|
std::max(int64_t(0),
|
clientData[client.index]->clientEstimatedMemory.load()));
|
}
|
The last change on that code was for introducing the MemoryDomains.
[HashTable MemUsed]
STAT(ep_kv_size, , bytes, memory_used, LABEL(for, hashtable))
|
collector.addStat(Key::ep_kv_size, stats.getCurrentSize());
|
//! Total size of stored objects.
|
Counter currentSize;
|
|
|
size_t EPStats::getCurrentSize() const {
|
int64_t result = 0;
|
for (const auto& core : coreLocal) {
|
result += core->currentSize;
|
}
|
return std::max(int64_t(0), result);
|
}
|
And for persistent bucket the related code is:
void ObjectRegistry::onCreateBlob(const Blob* blob) {
|
EventuallyPersistentEngine* engine = th;
|
if (verifyEngine(engine)) {
|
auto& coreLocalStats = engine->getEpStats().coreLocal.get();
|
|
|
size_t size = cb::ArenaMalloc::malloc_usable_size(blob);
|
coreLocalStats->blobOverhead.fetch_add(size - blob->getSize());
|
coreLocalStats->currentSize.fetch_add(size);
|
coreLocalStats->totalValueSize.fetch_add(size);
|
coreLocalStats->numBlob++;
|
}
|
}
|
|
|
void ObjectRegistry::onDeleteBlob(const Blob* blob) {
|
EventuallyPersistentEngine* engine = th;
|
if (verifyEngine(engine)) {
|
auto& coreLocalStats = engine->getEpStats().coreLocal.get();
|
|
|
size_t size = cb::ArenaMalloc::malloc_usable_size(blob);
|
coreLocalStats->blobOverhead.fetch_sub(size - blob->getSize());
|
coreLocalStats->currentSize.fetch_sub(size);
|
coreLocalStats->totalValueSize.fetch_sub(size);
|
coreLocalStats->numBlob--;
|
}
|
}
|
|
|
void HashTable::clear_UNLOCKED(bool deactivate) {
|
if (deactivate) {
|
setActiveState(false);
|
}
|
const auto metadataMemory = valueStats.getMetaDataMemory();
|
for (auto& chain : values) {
|
chain.reset();
|
}
|
stats.coreLocal.get()->currentSize.fetch_sub(metadataMemory);
|
valueStats.reset();
|
}
|
|
|
void HashTable::Statistics::epilogue(StoredValueProperties pre,
|
const StoredValue* v) {
|
..
|
if (pre.metaDataSize != post.metaDataSize) {
|
local.metaDataMemory.fetch_add(post.metaDataSize - pre.metaDataSize);
|
epStats.coreLocal.get()->currentSize.fetch_add(post.metaDataSize -
|
pre.metaDataSize);
|
}
|
..
|
}
|
