Details
-
Bug
-
Resolution: Fixed
-
 Major
Major
-
7.0.2, 7.1.0
-
None
-
Untriaged
-
1
-
Yes
-
KV 2021-Nov, KV 2021-Dec
Description
The auto tuning in the Defragmenter has been observed to be too aggressive when the percevied fragmentation is above threshold but the majority of memory in use is not hash-table data (StoredValue/Blob).
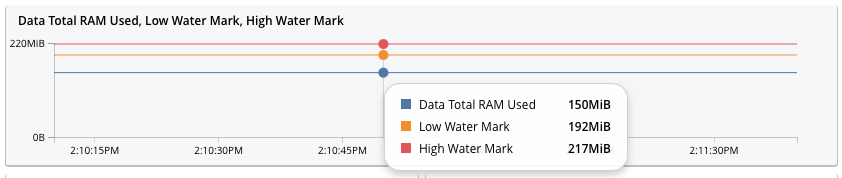
When attempting to reproduce MB-43460 on a local cluster_run (logs below), the defragmenter appeared to be running constantly (memcached %CPU was at ~100%).
However mem_used was below the high watermark, as was the RSS:
$ ./install/bin/mcstat localhost -p 12000 -u Administrator -P password -b default memory| rg '(a:allocated|a:resident|high_wat)'
|
ep_mem_high_wat 228170137
|
ep_mem_high_wat_percent 0.8499999977648258
|
ep_arena:allocated 163269408
|
ep_arena:resident 215244800
|
From Jim Walker via Slack discussion:
so with those numbers we compute a 0.22 score to send to the pid, 0,07 is the lower threshold so it wll be cranking up
Note also that Blob memory (ep_value_size) and StoredValue memory (ep_storedval_size ) are reasonably low, so not actually much memory to defrag - approx 78MB:
$ ./install/bin/cbstats localhost:12000 -u Administrator -p password -b default memory
|
bytes: 157938984
|
ep_arena:allocated: 163283032
|
ep_arena:arena: 2
|
ep_arena:base: 5109216
|
ep_arena:fragmentation_size: 51912616
|
ep_arena:internal: 0
|
ep_arena:large.allocated: 13139968
|
ep_arena:mapped: 216375296
|
ep_arena:resident: 215195648
|
ep_arena:retained: 0
|
ep_arena:small.allocated: 150143064
|
ep_arena_global:allocated: 21487680
|
ep_arena_global:arena: 0
|
ep_arena_global:base: 4767408
|
ep_arena_global:fragmentation_size: 9277376
|
ep_arena_global:internal: 3820256
|
ep_arena_global:large.allocated: 12918784
|
ep_arena_global:mapped: 38572032
|
ep_arena_global:resident: 30765056
|
ep_arena_global:retained: 0
|
ep_arena_global:small.allocated: 8568896
|
ep_blob_num: 223387
|
ep_blob_overhead: 3797579
|
ep_item_num: 4240
|
ep_kv_size: 75262141
|
ep_max_size: 268435456
|
ep_mem_high_wat: 228170137
|
ep_mem_high_wat_percent: 0.8499999977648258
|
ep_mem_low_wat: 201326592
|
ep_mem_low_wat_percent: 0.75
|
ep_mem_used_primary: 97836408
|
ep_mem_used_secondary: 60102576
|
ep_oom_errors: 0
|
ep_overhead: 4720614
|
ep_storedval_num: 223149
|
ep_storedval_overhead: 3797579
|
ep_storedval_size: 21422304
|
ep_tmp_oom_errors: 0
|
ep_value_size: 57187072
|
ht_mem_used_replica: 0
|
mem_used: 157938984
|
mem_used_estimate: 157938984
|
mem_used_merge_threshold: 111848
|
replica_checkpoint_memory_overhead: 0
|
The defragmenter needs to cope with these situations and should consider the hashtable usage as that's the only thing it can actually affect.
Logs:
https://cb-engineering.s3.amazonaws.com/daver/49525/collectinfo-2021-11-12T141709-n_0%40127.0.0.1.zip
https://cb-engineering.s3.amazonaws.com/daver/49525/collectinfo-2021-11-12T141709-n_1%40127.0.0.1.zip
https://cb-engineering.s3.amazonaws.com/daver/49525/collectinfo-2021-11-12T141709-n_2%40127.0.0.1.zip
https://cb-engineering.s3.amazonaws.com/daver/49525/collectinfo-2021-11-12T141709-n_3%40127.0.0.1.zip
https://cb-engineering.s3.amazonaws.com/daver/49525/collectinfo-2021-11-12T141709-n_4%40127.0.0.1.zip
Attachments

Issue Links
- is caused by
-
MB-29928 Defragmenter: Only run when fragmentation is high
-
- Closed
-