Details
-
Bug
-
Resolution: Fixed
-
 Major
Major
-
7.1.0
-
Untriaged
-
1
-
Unknown
Description
Raising this issue after analysing some memory stats from another MB, this is by no way 100% conclusive analysis but worthy of logging as an issue.
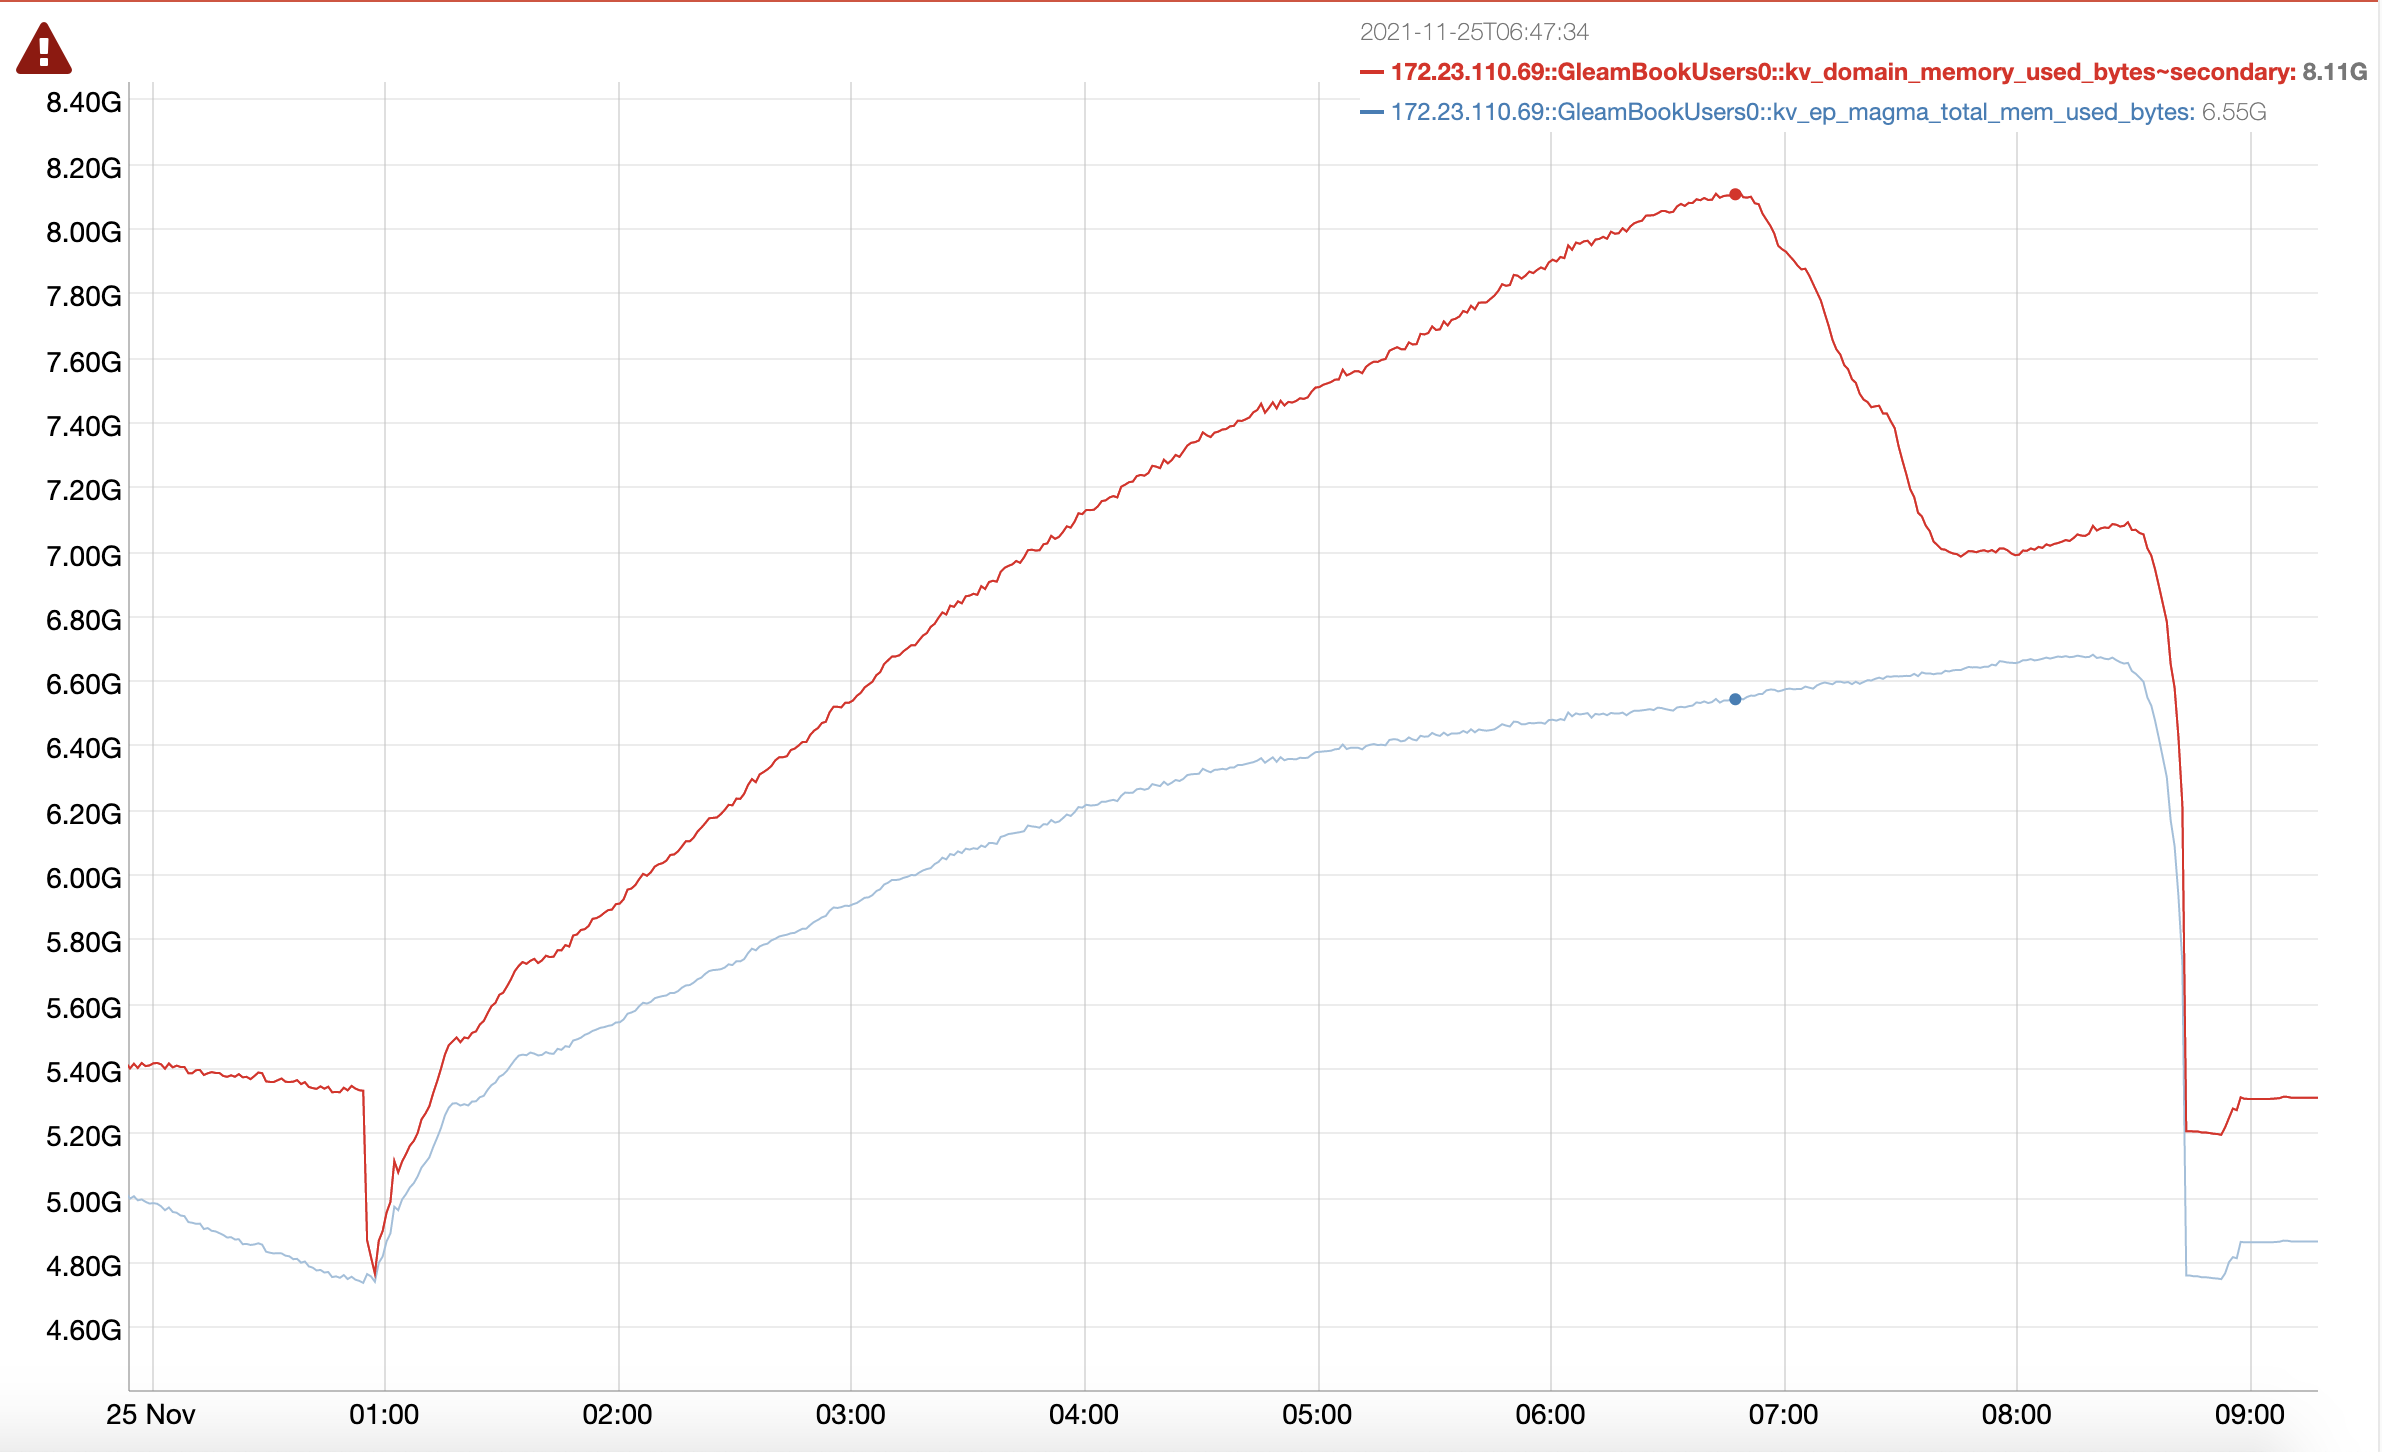
Logs from MB-49702 suggest that the memory allocated to magma is contributing to high fragmentation.
Here are my observations that lead to that conclusion, this is all from the following node.
- s3://cb-customers-secure/rebalance_failed/2021-11-22/collectinfo-2021-11-22t083450-ns_1@172.23.121.123.zip
In MB-49702 DaveR noted that the NonIO thread(s) were heavily utilised due to the similar issues logged in MB-49525.
However this is a much more heavily utilised node so I didn't expect to see the DefragmenterTask still continually trying
to reduce the bucket's resident memory.
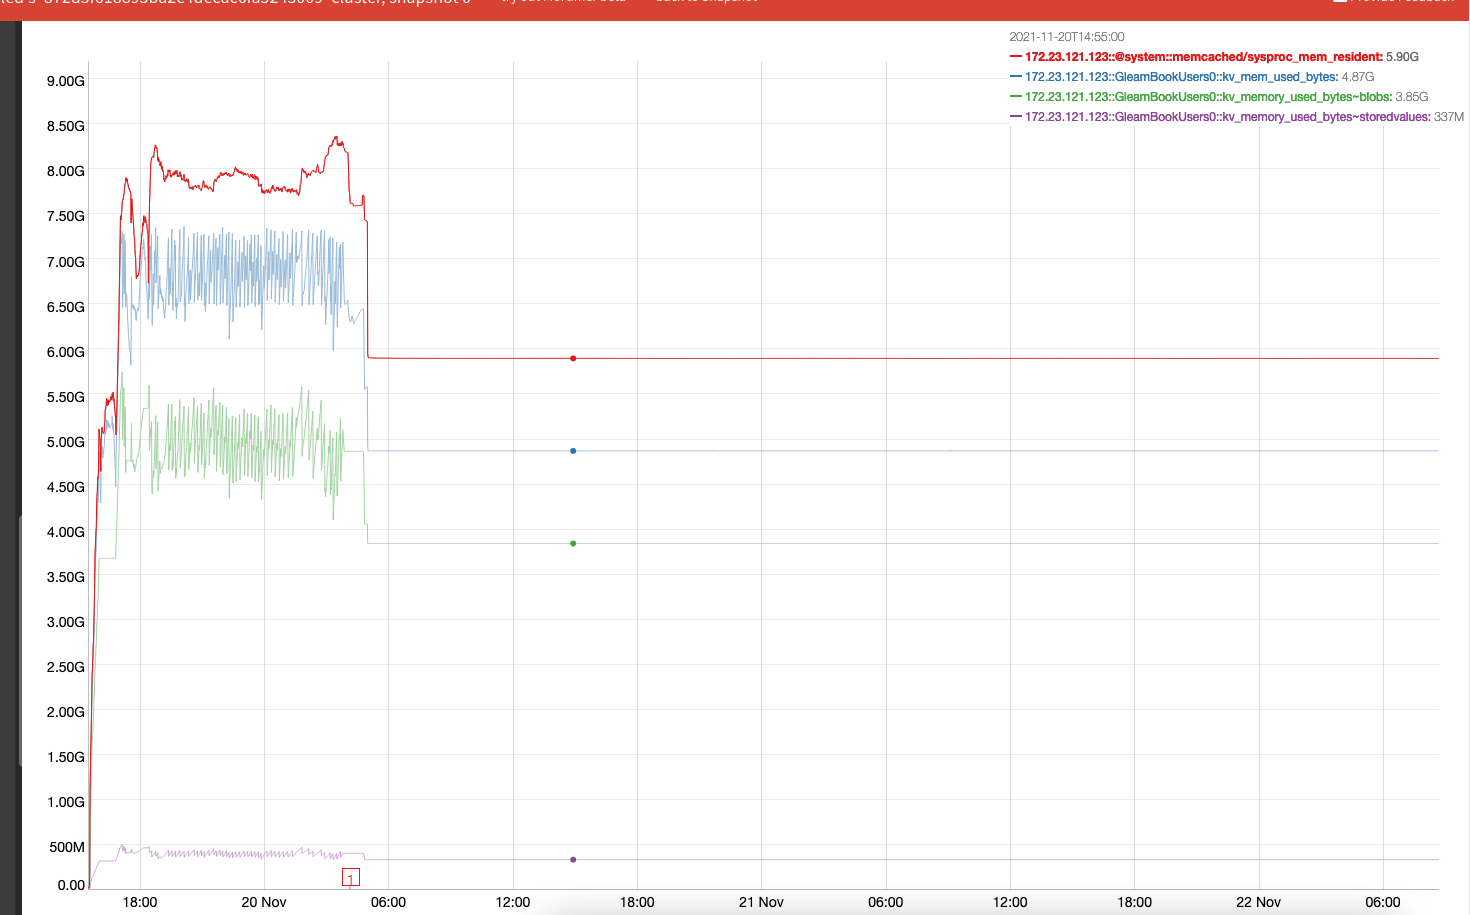
The interesting points from stats.log memory are:
- 5.42 GiB resident ep_arena:resident: 5821845504
- 4.54 GiB bucket allocated ep_arena:allocated: 4878246744
- 0.94 GiB of unallocated bytes ep_arena:fragmentation_size: 943598760
- This yields a fragmentation 'ratio' of 0.16 or 16% fragmented
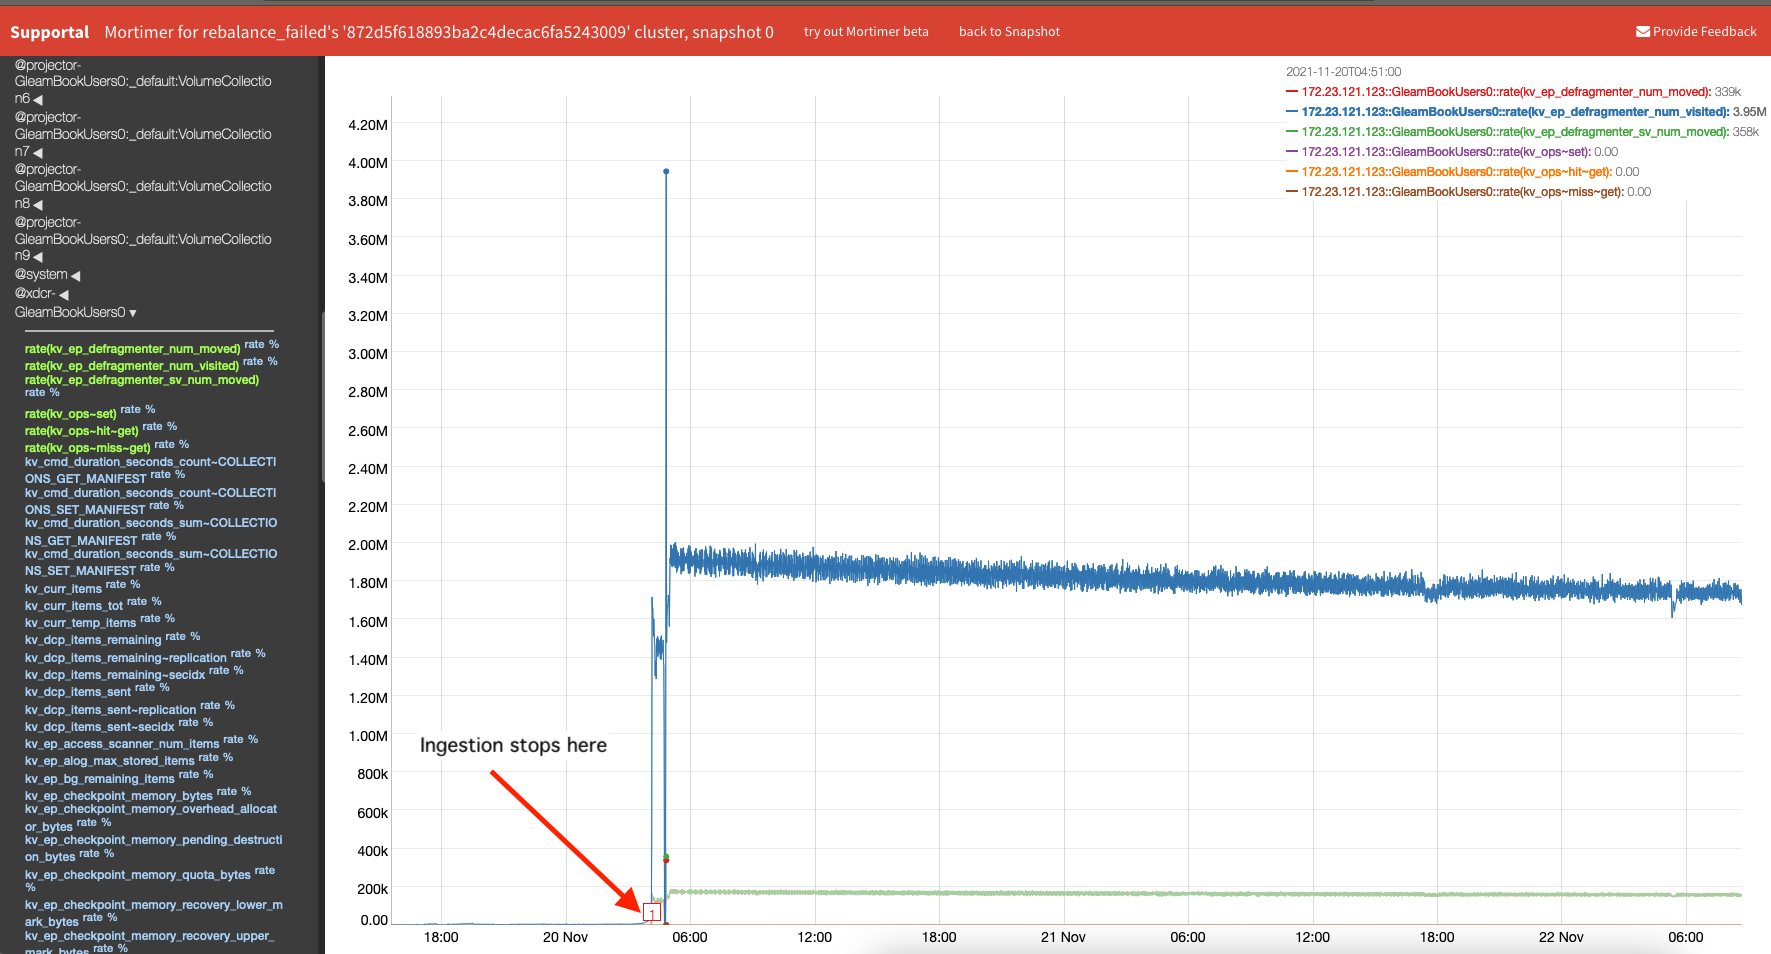
The DefragmentTask finally calculates a 'score' of 0.10 when it takes the 0.16 and multiples by allocated as a ratio of high-water mark, I.e. the DefragementerTask is above the lower threshold so will reduce its sleep time. This happened continually and the DefragmenterTask has reduced sleep to 0 (i.e. constantly re-scheduled). This results in a very high-rates of visiting to the bucket HashTable and from mortimer we can observe that the majority of StoredValues have been visited and reallocated.
- 4.2m StoredValues (the things which get reallocated) ep_storedval_num: 4209311
- DefragmenterTask reached reallocation rates of ~170k StoredValue's a minute (and this goes on for a while)
- No new mutations are arriving
- Conclusion is that we must of reallocated everything many times (see mortimer graph) and the HashTable should be quite well packed/utilised.
So with that, why do we still have quite a high level of fragmentation?
KV-engine's mem_used seems to mostly be HashTable data, I don't see that KV has say lots of overheads at play
- 3.52 GiB KV-engine's mem_used ep_mem_used_primary: 3780091208
- 3.88 GiB HashTable memory ep_kv_size: 4165293460
- Note that the memory stats are not a snapshot, there can be skew as we read and process each stat, this is why I think ep_mem_used_primary is showing less than the HashTable data
The next biggest user of memory is magma, we see that in the secondary mem_used
- 1.09 GiB allocated by magma ep_mem_used_secondary: 1093367712
So my conclusion comes from
- KV has 3.88 GiB of memory used by HashTable and we are actively 'repacking' that data, as that's what the DegramenterTask does
- Magma has 1.09 GiB of memory, with no active defragging
The 1.09 GiB must be the main contributor to the 0.94 GiB of fragmentation
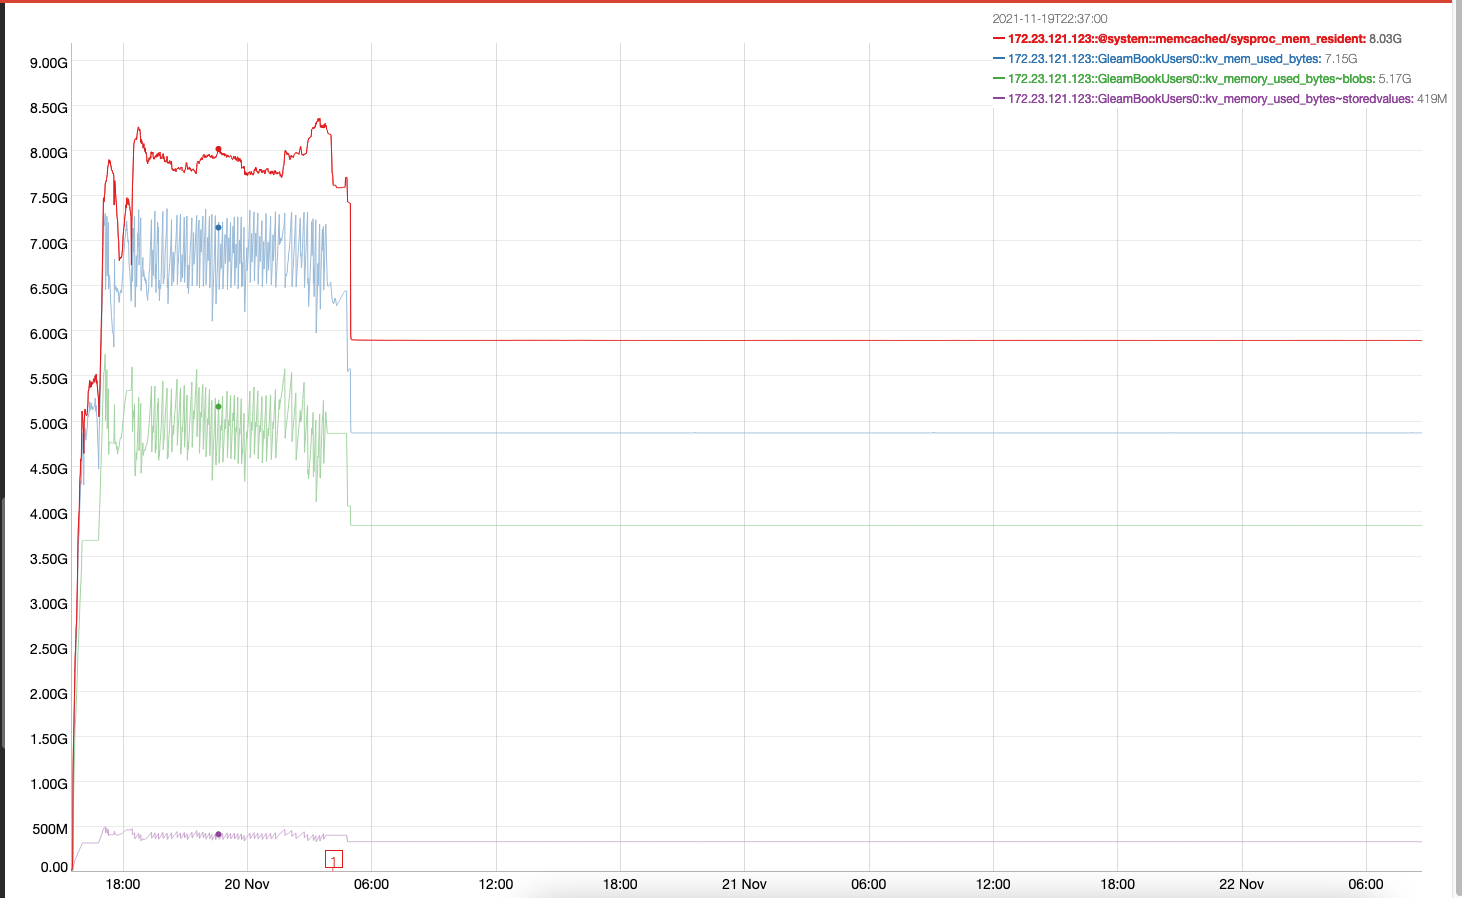
Mortimer graph showing overall memory stays stable
Attachments


Issue Links
- relates to
-
MB-50195 Magma memory defragmenter
-
- Open
-