Details
-
Bug
-
Resolution: Not a Bug
-
Critical
-
None
-
7.0.0, 7.0.1, 7.0.2
-
OS - Debian GNU/Linux 10
Couchbase Server 7.0.0-5302 (CE)
-
Ubuntu 64-bit
-
Impediment
-
1
-
Unknown
Description
We recently noticed issues with excessive resource consumption of some subsystems within Couchbase.
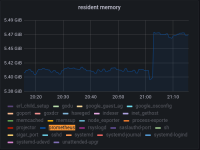
According to the images attached, Prometheus processes are consuming a lot of RAM and CPU memory, it is even the process that consumes the most resources within the virtual machine.
Doing a research, I noticed that Prometheus using in Couchbase 7.0 has version 2.22.0 (branch: HEAD, revision: a6239a377d49104ac7253a99aef8feb8dee0a7c2)
There are some bug reports that indicate high resource consumption and that some limit parameters are not being respected, according to the problem: https://github.com/prometheus/prometheus/issues/9744
Our first approach, as the issue suggests, is to update to version 2.22.1 where the bug is fixed, but since Couchbase uses a custom version of Prometheus, there is a custom flag that runs along with the parent process of Couchbase, you can see the error below when changing the Prometheus version:
Error parsing commandline arguments: unknown long flag '--storage.tsdb.no-lockfile'
prometheus: error: unknown long flag '--storage.tsdb.no-lockfile'
The version that Prometheus uses within Couchbase is different from the release in the official Prometheus repository, where:
prometheus, version 2.22.0 (branch: HEAD, revision: a6239a377d49104ac7253a99aef8feb8dee0a7c2) is the custom version of Couchbase
prometheus, version 2.22.0 (branch: HEAD, revision: 0a7fdd3b76960808c3a91d92267c3d815c1bc354) is the same version as Prometheus but without the custom flags.
The Workaround we got is to remove the Prometheus binary and restart the child process, this way the Prometheus binary doesn't load and doesn't overload the cluster, on the other hand, we lose all visibility of queries, index, and cluster activities that are important for operation.
Also attached is a screenshot of the process monitors with the high levels of RAM and CPU that the process consumes over time, causing unavailability in our environment.


