Details
-
Bug
-
Resolution: Fixed
-
 Major
Major
-
2.0
-
Security Level: Public
-
None
Description
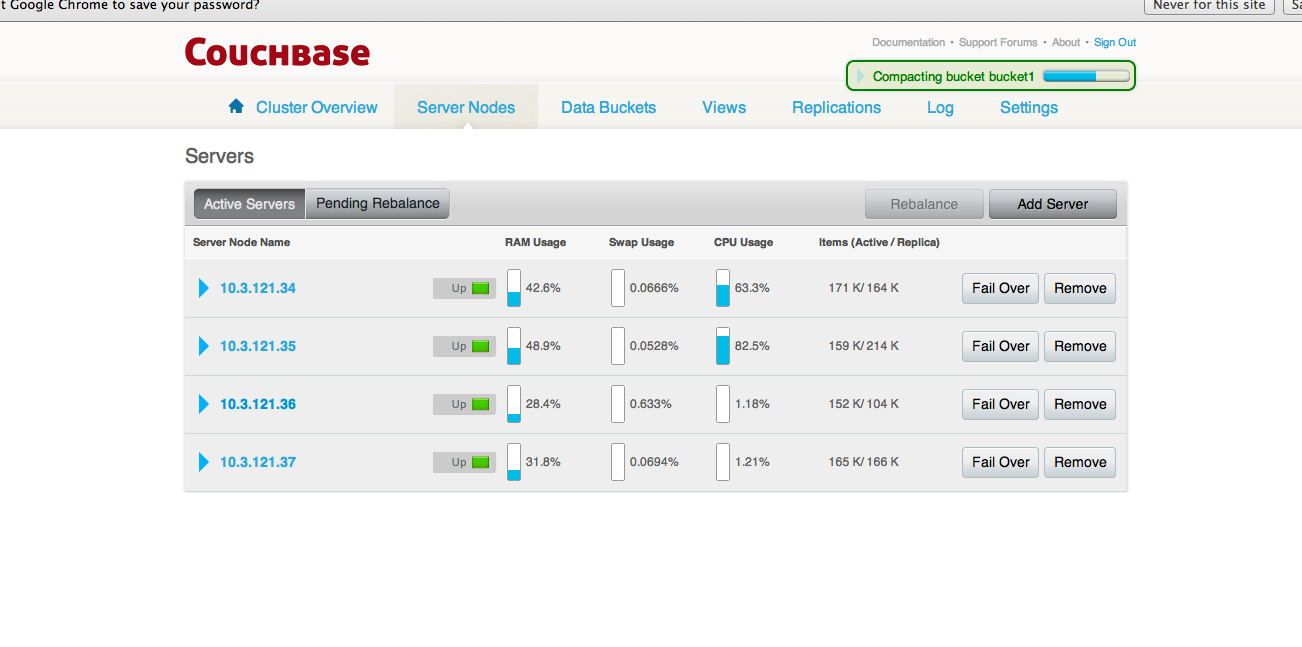
- Setup a 2:2 node xdcr replication, keep loading items on the source cluster.
- Create 2 nodecluster. CPU stats are as expected 60-70% on both the nodes.
-Rebalance in 2 more nodes on the cluster.
Seeing uneven CPU utilization on cluster nodes, some nodes show high CPU (80-90%, expected) and some show very low (0.4 %)
Nodes CPU
34 -90%
35 -80%
36 -0.5%
37-0.4%
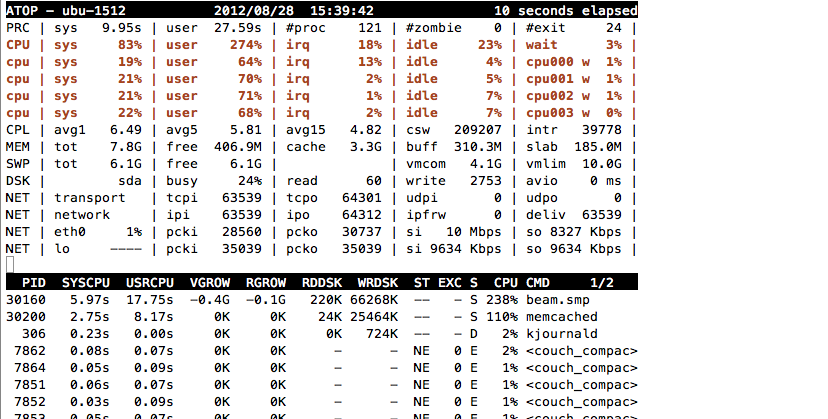
Output from atop commands on
34
------
ATOP - ubu-1512 2012/08/28 15:43:42 10 seconds elapsed
PRC | sys 9.66s | user 27.16s | #proc 120 | #zombie 0 | #exit 0 |
CPU | sys 79% | user 273% | irq 21% | idle 26% | wait 1% |
cpu | sys 19% | user 63% | irq 14% | idle 5% | cpu000 w 0% |
cpu | sys 19% | user 70% | irq 3% | idle 7% | cpu003 w 0% |
cpu | sys 21% | user 70% | irq 2% | idle 7% | cpu002 w 0% |
cpu | sys 20% | user 70% | irq 2% | idle 7% | cpu001 w 1% |
CPL | avg1 6.02 | avg5 6.05 | avg15 5.15 | csw 210926 | intr 38986 |
MEM | tot 7.8G | free 484.2M | cache 3.2G | buff 312.4M | slab 177.3M |
SWP | tot 6.1G | free 6.1G | | vmcom 4.3G | vmlim 10.0G |
DSK | sda | busy 15% | read 0 | write 2158 | avio 0 ms |
NET | transport | tcpi 72204 | tcpo 74571 | udpi 0 | udpo 0 |
NET | network | ipi 72202 | ipo 74577 | ipfrw 0 | deliv 72202 |
NET | eth0 1% | pcki 31429 | pcko 34934 | si 10 Mbps | so 8947 Kbps |
NET | lo ---- | pcki 40833 | pcko 40833 | si 11 Mbps | so 11 Mbps |
PID SYSCPU USRCPU VGROW RGROW RDDSK WRDSK ST EXC S CPU CMD 1/1
30160 6.41s 17.95s 36520K 64032K 0K 6040K – - S 249% beam.smp
30200 2.88s 9.15s 6160K 6468K 0K 23696K – - S 123% memcached
306 0.21s 0.00s 0K 0K 0K 656K – - S 2% kjournald
30193 0.02s 0.05s 0K 0K 0K 0K – - S 1% ssl_esock
30195 0.04s 0.00s 0K 0K 0K 0K – - S 0% inet_gethost
7790 0.03s 0.00s 0K 0K 0K 0K – - R 0% atop
6215 0.02s 0.01s 0K 0K 0K 0K – - S 0% inet_gethost
30847 0.02s 0.00s 0K 0K 0K 0K – - S 0% flush-252:0
30218 0.01s 0.00s 0K 0K 0K 0K – - S 0% sigar_port
15 0.01s 0.00s 0K 0K 0K 0K – - S 0% events/0
18 0.01s 0.00s 0K 0K 0K 0K – - S 0% events/3
30290 0.00s 0.00s 0K 0K 0K 0K – - S 0% moxi
1025 0.00s 0.00s 0K 0K 0K 0K – - S 0% vmtoolsd
30190 0.00s 0.00s 0K 0K 0K 0K – - S 0% memsup
825 0.00s 0.00s 0K 0K 0K 0K – - S 0% irqbalance
270 0.00s 0.00s 0K 0K 0K 0K – - S 0% mpt_poll_0
@Junyi - Beam.smp taking much lesser CPU on 2 nodes, does this indicate that XDCR is not runnning on these nodes? [typical xdcr nodes have cpu ~70 percent.]
Can I get more stats/ commands to debug this further?
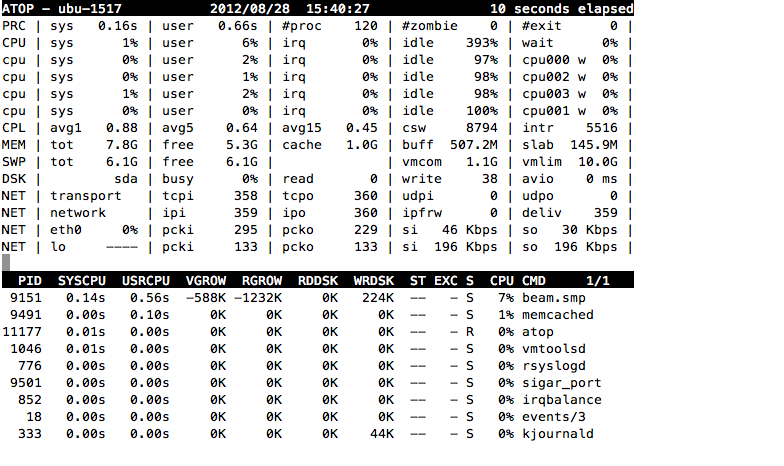
37
---------
ATOP - ubu-1517 2012/08/28 15:43:57 10 seconds elapsed
PRC | sys 0.22s | user 0.52s | #proc 120 | #zombie 0 | #exit 0 |
CPU | sys 2% | user 5% | irq 0% | idle 393% | wait 0% |
cpu | sys 0% | user 1% | irq 0% | idle 98% | cpu000 w 0% |
cpu | sys 1% | user 2% | irq 0% | idle 97% | cpu003 w 0% |
cpu | sys 0% | user 1% | irq 0% | idle 99% | cpu002 w 0% |
cpu | sys 0% | user 1% | irq 0% | idle 99% | cpu001 w 0% |
CPL | avg1 0.16 | avg5 0.37 | avg15 0.38 | csw 9368 | intr 5718 |
MEM | tot 7.8G | free 5.3G | cache 1.0G | buff 507.2M | slab 146.4M |
SWP | tot 6.1G | free 6.1G | | vmcom 1.0G | vmlim 10.0G |
DSK | sda | busy 0% | read 0 | write 34 | avio 0 ms |
NET | transport | tcpi 585 | tcpo 587 | udpi 0 | udpo 0 |
NET | network | ipi 585 | ipo 587 | ipfrw 0 | deliv 585 |
NET | eth0 0% | pcki 513 | pcko 452 | si 94 Kbps | so 39 Kbps |
NET | lo ---- | pcki 137 | pcko 137 | si 197 Kbps | so 197 Kbps |
PID SYSCPU USRCPU VGROW RGROW RDDSK WRDSK ST EXC S CPU CMD 1/1
9151 0.22s 0.42s 2128K 120K 0K 180K – - S 6% beam.smp
9491 0.00s 0.08s 0K 0K 0K 0K – - S 1% memcached
11177 0.00s 0.01s 0K 0K 0K 0K – - R 0% atop
1046 0.00s 0.01s 0K 0K 0K 0K – - S 0% vmtoolsd
9490 0.00s 0.00s 0K 0K 0K 0K – - S 0% moxi
9501 0.00s 0.00s 0K 0K 0K 0K – - S 0% sigar_port
852 0.00s 0.00s 0K 0K 0K 0K – - S 0% irqbalance
333 0.00s 0.00s 0K 0K 0K 12K – - S 0% kjournald
What does beam.smp taking 1 or 0% indicate? Is this something we expect on rebalancing more nodes on a cluster?