Details
-
Bug
-
Resolution: Duplicate
-
 Critical
-
2.0-beta-2
-
Security Level: Public
-
None
-
2.0-1778
Ubuntu
4G, 4Core VMs.
Small DGM ~ 70-80% resident on source.
Description
-Setup a 2:4 unidirectional replication between 2 clusters.
- Replicate 4M data from source to destination.
- Keep continous load on the source, ( < 1k ops/sec) load includes create/update/deletes
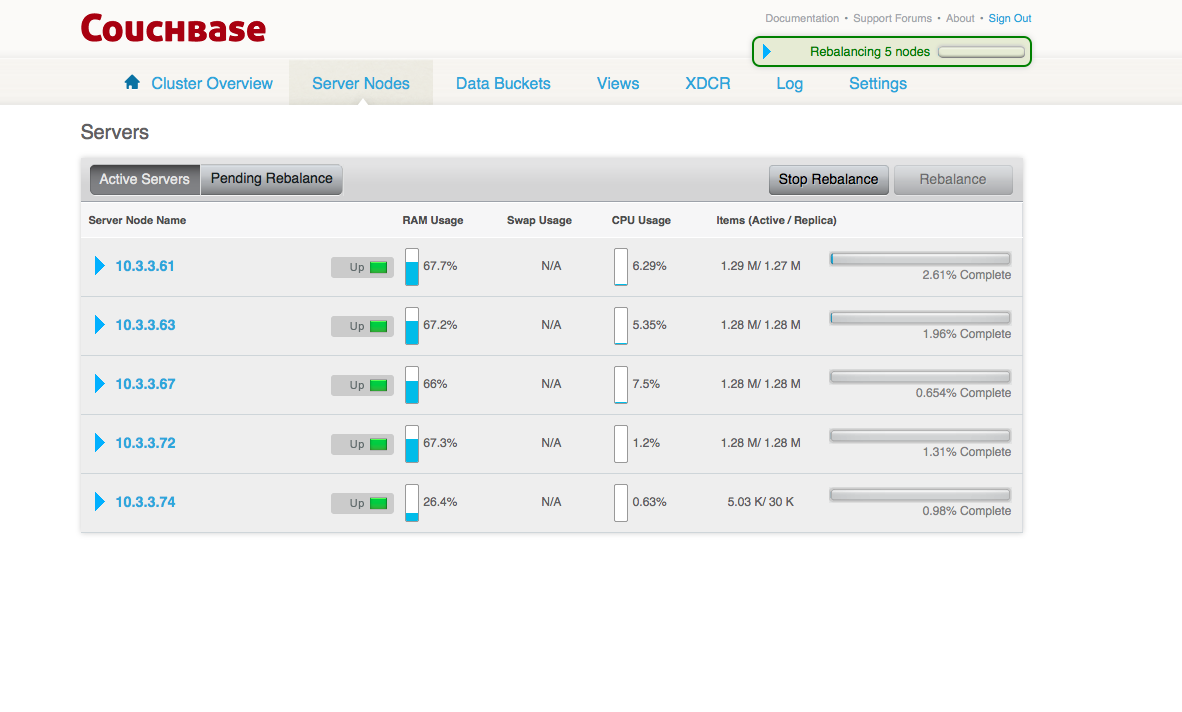
-Rebalance in 1 node on the source cluster
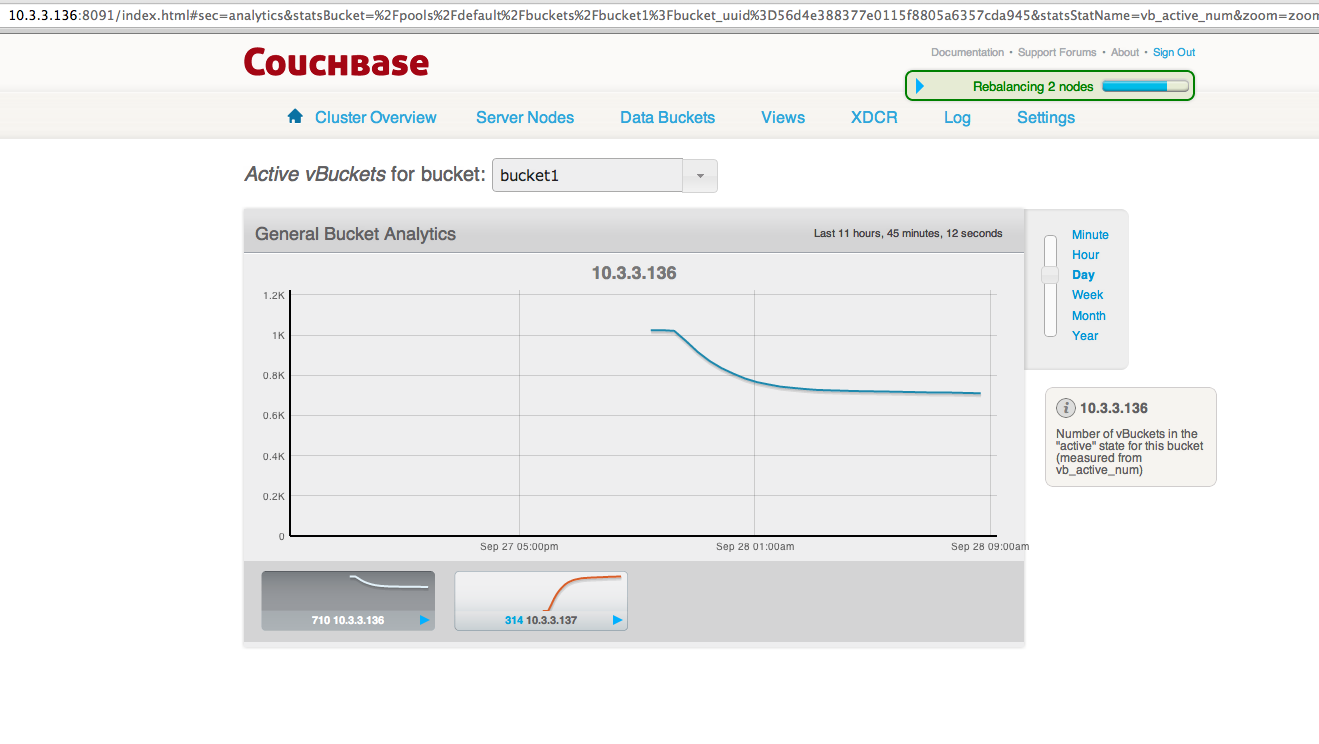
After 1 hour, rebalance progress is less than 10 percent.
Seeing 1 Rebalance Tap sender intermittently on the Tap Stats.
Very slow vbucket movement on source cluster.
- Disk Write Queue < 100k
- The memory usage by beam.smp/ memcached is not very high.
- CPU is not very high.
- Not seeing any major backoffs on the TAP stats.
Node : 10.3.3.136
--------------------------------------------------
ATOP - ubuntu-1004 2012/09/27 17:41:59 1591711 seconds elapsed
PRC | sys 281m14s | user 358m32s | #proc 128 | #zombie 0 | #exit 0 |
CPU | sys 3% | user 6% | irq 0% | idle 390% | wait 1% |
cpu | sys 1% | user 2% | irq 0% | idle 96% | cpu000 w 0% |
cpu | sys 1% | user 1% | irq 0% | idle 98% | cpu001 w 0% |
cpu | sys 1% | user 1% | irq 0% | idle 98% | cpu002 w 0% |
cpu | sys 1% | user 1% | irq 0% | idle 98% | cpu003 w 0% |
CPL | avg1 3.24 | avg5 3.63 | avg15 3.74 | csw 173898e4 | intr 52905e4 |
MEM | tot 5.8G | free 41.5M | cache 2.4G | buff 142.7M | slab 119.1M |
SWP | tot 6.1G | free 6.1G | | vmcom 3.4G | vmlim 9.1G |
PAG | scan 2614e3 | stall 0 | | swin 7282 | swout 12643 |
DSK | sda | busy 1% | read 253419 | write 8256e3 | avio 1 ms |
NET | transport | tcpi 85479e3 | tcpo 82289e3 | udpi 5850 | udpo 5822 |
NET | network | ipi 85556067 | ipo 82296481 | ipfrw 0 | deliv 8556e4 |
NET | eth0 0% | pcki 55583e3 | pcko 43085e3 | si 115 Kbps | so 132 Kbps |
NET | lo ---- | pcki 46050e3 | pcko 46050e3 | si 264 Kbps | so 264 Kbps |
-
-
- system and process activity since boot ***
PID SYSCPU USRCPU VGROW RGROW RDDSK WRDSK ST EXC S CPU CMD 1/5
15352 209m20s 262m06s 847.4M 581.7M 5.5G 14.5G N- - S 2% beam.smp
15683 42m31s 78m44s 2.6G 2.4G 1.7G 8.2G N- - S 0% memcached
1064 5m52s 14m01s 68840K 1796K 64K 12K N- - S 0% vmtoolsd
- system and process activity since boot ***
-
Node : 10.3.3.138
--------------------------------------------------
ATOP - ubuntu-1004 2012/09/27 17:41:03 10 seconds elapsed
PRC | sys 8.34s | user 13.41s | #proc 121 | #zombie 0 | #exit 1 |
CPU | sys 70% | user 130% | irq 19% | idle 137% | wait 45% |
cpu | sys 17% | user 34% | irq 12% | idle 27% | cpu000 w 11% |
cpu | sys 20% | user 33% | irq 2% | idle 36% | cpu002 w 9% |
cpu | sys 16% | user 31% | irq 4% | idle 34% | cpu003 w 15% |
cpu | sys 17% | user 31% | irq 2% | idle 40% | cpu001 w 10% |
CPL | avg1 5.67 | avg5 4.36 | avg15 3.85 | csw 144074 | intr 32594 |
MEM | tot 5.8G | free 50.8M | cache 2.3G | buff 131.8M | slab 117.1M |
SWP | tot 6.1G | free 6.1G | | vmcom 3.5G | vmlim 9.1G |
PAG | scan 13696 | stall 0 | | swin 8 | swout 98 |
DSK | sda | busy 76% | read 933 | write 701 | avio 4 ms |
NET | transport | tcpi 12182 | tcpo 12085 | udpi 0 | udpo 0 |
NET | network | ipi 12182 | ipo 12086 | ipfrw 0 | deliv 12182 |
NET | eth0 0% | pcki 10415 | pcko 11808 | si 2194 Kbps | so 6165 Kbps |
NET | lo ---- | pcki 1841 | pcko 1841 | si 1340 Kbps | so 1340 Kbps |
PID SYSCPU USRCPU VGROW RGROW RDDSK WRDSK ST EXC S CPU CMD 1/1
29285 6.58s 11.12s 10688K 11724K 32K 1636K – - S 178% beam.smp
29325 1.34s 2.26s 0K -392K 23940K 9412K – - S 36% memcached
52 0.25s 0.00s 0K 0K 0K 0K – - S 3% kswapd0
304 0.09s 0.00s 0K 0K 0K 340K – - S 1% kjournald
3631 0.02s 0.02s 0K 0K 0K 0K – - R 0% atop
Tap stats from Node 10.3..3136
---------------------------------------------
ketaki@ubuntu-1004:~$ /opt/couchbase/bin/cbstats 10.3.3.136:11210 -b bucket1 tap | grep ep_tap
ep_tap_ack_grace_period: 300
ep_tap_ack_interval: 1000
ep_tap_ack_window_size: 10
ep_tap_backoff_period: 5
ep_tap_bg_fetch_requeued: 0
ep_tap_bg_fetched: 101807
ep_tap_bg_max_pending: 500
ep_tap_count: 6
ep_tap_deletes: 14446
ep_tap_fg_fetched: 3393648
ep_tap_noop_interval: 20
ep_tap_queue_backfillremaining: 0
ep_tap_queue_backoff: 0
ep_tap_queue_drain: 3325903
ep_tap_queue_fill: 0
ep_tap_queue_itemondisk: 0
ep_tap_throttle_queue_cap: 1000000
ep_tap_throttle_threshold: 90
ep_tap_throttled: 0
ep_tap_total_backlog_size: 61
ep_tap_total_fetched: 3521139
ep_tap_total_queue: 0
Tap stats from Node 10.3.3.138
---------------------------------------------
ketaki@ubuntu-1004:~$ /opt/couchbase/bin/cbstats 10.3.3.138:11210 -b bucket1 tap | grep ep_tap
ep_tap_ack_grace_period: 300
ep_tap_ack_interval: 1000
ep_tap_ack_window_size: 10
ep_tap_backoff_period: 5
ep_tap_bg_fetch_requeued: 0
ep_tap_bg_fetched: 150564
ep_tap_bg_max_pending: 500
ep_tap_count: 6
ep_tap_deletes: 14168
ep_tap_fg_fetched: 3423605
ep_tap_noop_interval: 20
ep_tap_queue_backfillremaining: 0
ep_tap_queue_backoff: 0
ep_tap_queue_drain: 3307441
ep_tap_queue_fill: 0
ep_tap_queue_itemondisk: 0
ep_tap_throttle_queue_cap: 1000000
ep_tap_throttle_threshold: 90
ep_tap_throttled: 0
ep_tap_total_backlog_size: 14
ep_tap_total_fetched: 3598703
ep_tap_total_queue: 0
Please let me know what additional relevant stats should I post for this.
The live cluster is accessible at
http://10.3.3.136:8091/
http://10.3.3.142:8091/
Attachments

Issue Links
- duplicates
-
-

- Closed
-