Details
-
Bug
-
Resolution: Fixed
-
 Test Blocker
-
3.0.4
-
None
-
1
-
SDK36: SearchFeat/Txns/Docs, SDK38: Txnβ-ready/Docs, SDK 44: Txns, SDK 3.1, Docs
Description
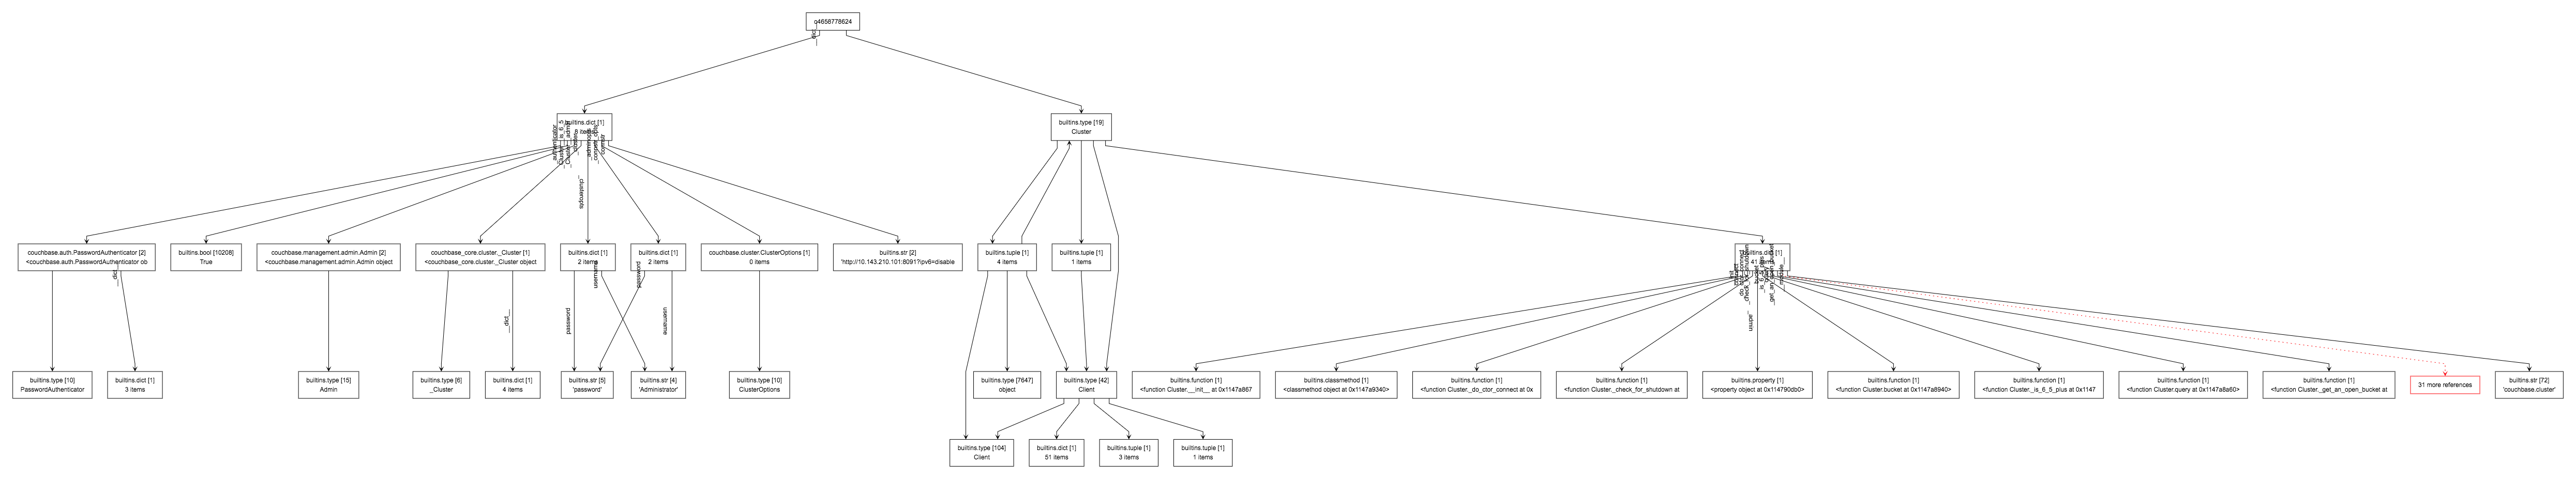
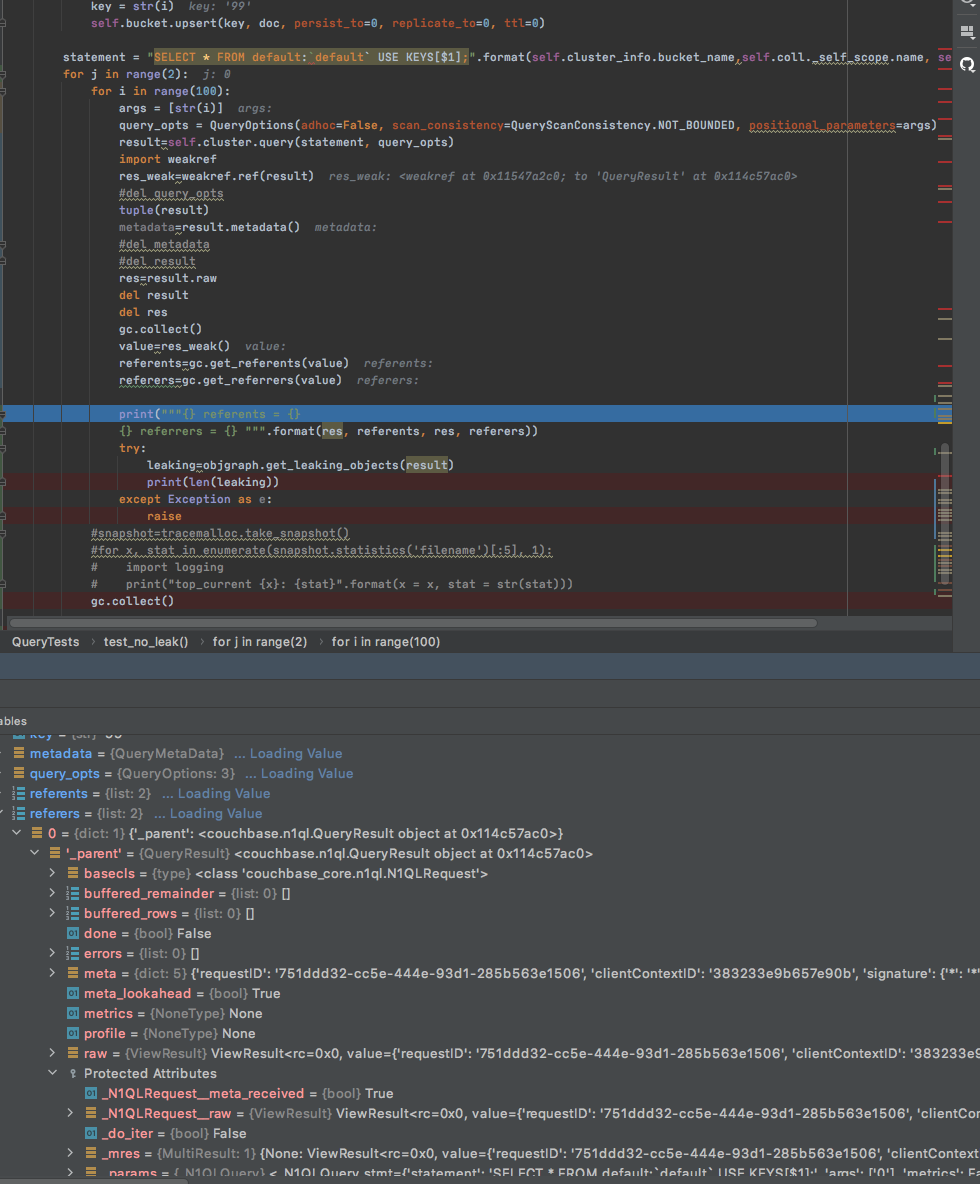
Running new collections n1ql tests requires we use python sdk3. All n1ql collections test run with 3.0.4. I was seeing some odd behavior after the test had run for about 10 minutes and the client side would freeze up. Using top, I could see that the client processes would continually grow in memory usage. By 10 minutes, the client machine would be out of memory. I ran tracemalloc to see where the memory could be leaking and it seem to be coming from here: https://github.com/couchbase/couchbase-python-client/blob/master/couchbase_core/n1ql.py#L529
This is a sample output of tracemalloc after 100 queries where submitted:
[2020-08-31 13:20:16,966: WARNING/Process-1:2] [ Top 20 differences ] |
[2020-08-31 13:20:16,966: WARNING/Process-1:2] /root/korry/perfrunner/env/lib/python3.5/site-packages/couchbase_core/n1ql.py:529: size=15.3 MiB (+193 KiB), count=153918 (+1900), average=104 B |
[2020-08-31 13:20:16,966: WARNING/Process-1:2] /usr/lib/python3.5/json/decoder.py:355: size=5703 KiB (+70.4 KiB), count=72901 (+900), average=80 B |
[2020-08-31 13:20:16,966: WARNING/Process-1:2] /root/korry/perfrunner/env/lib/python3.5/site-packages/couchbase_core/n1ql.py:417: size=1076 KiB (+13.3 KiB), count=8101 (+100), average=136 B |
[2020-08-31 13:20:16,966: WARNING/Process-1:2] /root/korry/perfrunner/env/lib/python3.5/site-packages/couchbase_core/__init__.py:262: size=1068 KiB (+13.3 KiB), count=16080 (+200), average=68 B |
[2020-08-31 13:20:16,966: WARNING/Process-1:2] /root/korry/perfrunner/env/lib/python3.5/site-packages/couchbase/cluster.py:595: size=506 KiB (+6400 B), count=8100 (+100), average=64 B |
[2020-08-31 13:20:16,967: WARNING/Process-1:2] /root/korry/perfrunner/env/lib/python3.5/site-packages/couchbase_core/__init__.py:292: size=505 KiB (+6400 B), count=8070 (+100), average=64 B |
[2020-08-31 13:20:16,967: WARNING/Process-1:2] /root/korry/perfrunner/env/lib/python3.5/site-packages/couchbase/n1ql.py:140: size=505 KiB (+6400 B), count=8066 (+100), average=64 B |
[2020-08-31 13:20:16,967: WARNING/Process-1:2] /root/korry/perfrunner/env/lib/python3.5/site-packages/couchbase_core/__init__.py:258: size=502 KiB (+6400 B), count=8040 (+100), average=64 B |
[2020-08-31 13:20:16,967: WARNING/Process-1:2] /root/korry/perfrunner/env/lib/python3.5/site-packages/couchbase/cluster.py:178: size=419 KiB (+6208 B), count=6704 (+97), average=64 B |
[2020-08-31 13:20:16,967: WARNING/Process-1:2] /root/korry/perfrunner/spring/reservoir.py:28: size=285 KiB (+3600 B), count=8099 (+100), average=36 B |
[2020-08-31 13:20:16,967: WARNING/Process-1:2] /root/korry/perfrunner/spring/cbgen_helpers.py:92: size=188 KiB (+2376 B), count=8028 (+99), average=24 B |
[2020-08-31 13:20:16,967: WARNING/Process-1:2] /root/korry/perfrunner/env/lib/python3.5/site-packages/couchbase_core/__init__.py:267: size=86.8 KiB (+192 B), count=1381 (+3), average=64 B |
[2020-08-31 13:20:16,967: WARNING/Process-1:2] /root/korry/perfrunner/spring/reservoir.py:31: size=67.5 KiB (+0 B), count=1 (+0), average=67.5 KiB |
[2020-08-31 13:20:16,967: WARNING/Process-1:2] /usr/lib/python3.5/tracemalloc.py:113: size=14.2 KiB (+0 B), count=165 (+0), average=88 B |
[2020-08-31 13:20:16,967: WARNING/Process-1:2] /usr/lib/python3.5/tracemalloc.py:123: size=13.2 KiB (+0 B), count=170 (+0), average=80 B |
[2020-08-31 13:20:16,967: WARNING/Process-1:2] /usr/lib/python3.5/tracemalloc.py:425: size=8408 B (+0 B), count=167 (+0), average=50 B |
[2020-08-31 13:20:16,967: WARNING/Process-1:2] /usr/lib/python3.5/multiprocessing/reduction.py:50: size=3556 B (+0 B), count=52 (+0), average=68 B |
[2020-08-31 13:20:16,968: WARNING/Process-1:2] /root/korry/perfrunner/env/lib/python3.5/site-packages/couchbase/options.py:73: size=3344 B (+0 B), count=46 (+0), average=73 B |
[2020-08-31 13:20:16,968: WARNING/Process-1:2] /root/korry/perfrunner/env/lib/python3.5/site-packages/couchbase/options.py:38: size=2384 B (+0 B), count=31 (+0), average=77 B |
[2020-08-31 13:20:16,968: WARNING/Process-1:2] /usr/lib/python3.5/tracemalloc.py:349: size=1944 B (+0 B), count=26 (+0), average=75 B |
The top one is:
/root/korry/perfrunner/env/lib/python3.5/site-packages/couchbase_core/n1ql.py:529: size=15.3 MiB (+193 KiB), count=153918 (+1900), average=104 B
You can see that it is adding around 193 KiB ever 100 queries, or 1.93 KiB per query. Our test do upwards of 10k queries/sec which would result in 19 MB per second or around 1 GB per minute. This causes our tests to quickly run out of memory on the client machines.