Details
-
Epic
-
Resolution: Unresolved
-
Major
-
None
-
None
-
None
-
Config Service
Description
Motivation
Various components need to know the hosts of all the nodes of all the clusters that CMOS monitors - Prometheus needs to know what to scrape, and the Cluster Monitor needs to know what nodes to check. We have attempted to tie them together in both directions, making one dependent on the other, but no matter which way we do it we run into issues:
- Prom->CM means that, without out-of-band information about cluster ports, we have to guess what the management port is (as the Prometheus Exporter will be on a different port for 6.x hosts) (
CMOS-85, CMOS-101, CMOS-91). We also need to externally specify the authentication credentials for Couchbase Server, as these are (rightly so) not exposed through the Prometheus API.- To put it bluntly, it's a bit of a hack
- CM->Prom is useless when running without CM, and it would flood the Prometheus log with alerts about failed service discovery - and we still need out-of-band information about the cluster version (same issue around Exporter ports) (CMOS-90)
We could use a static file with cluster information, but the nature of Couchbase Server is that nodes come and go all the time, and we need to stay up to date. The most flexible solution is a separate service, that runs within the CMOS Microlith (or on a separate host in the future) and gives everything its configuration.
High-Level Design

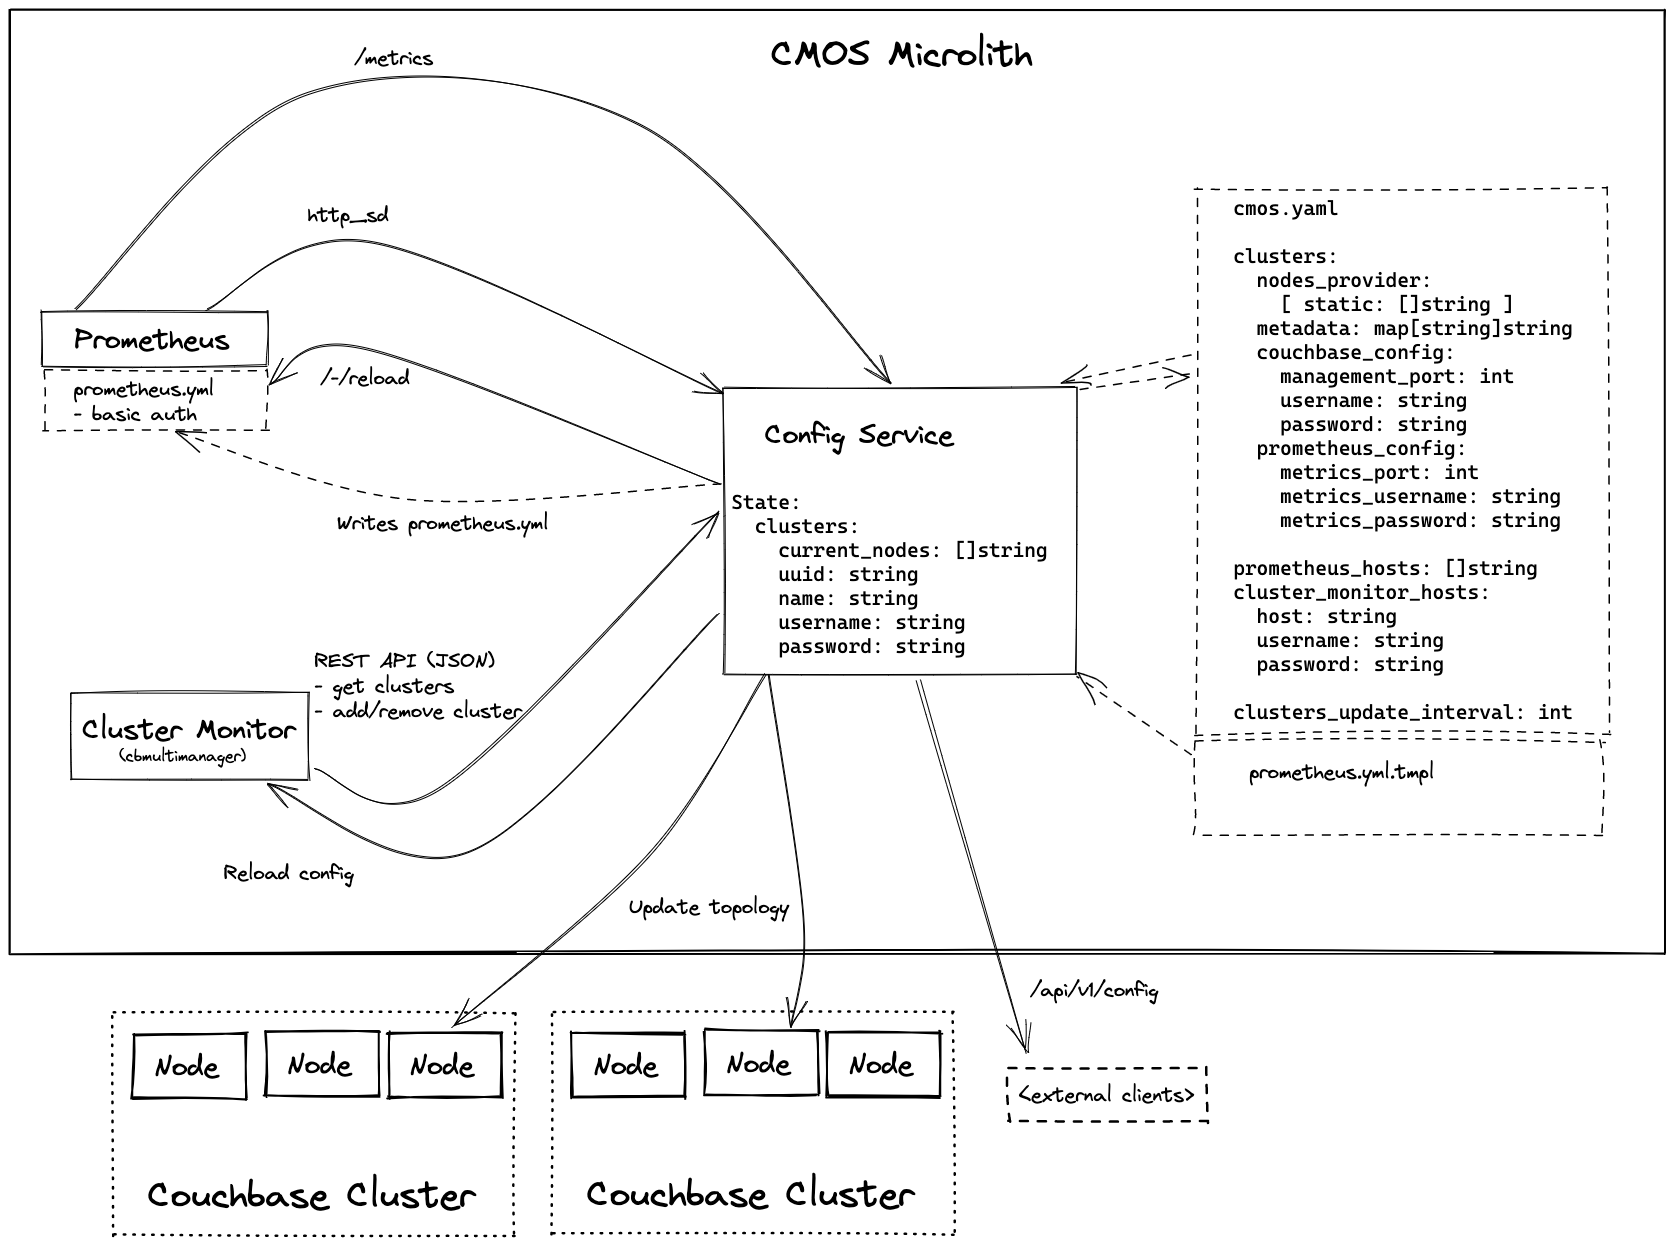
A service that runs within the microlith, keeps the state of what clusters are monitored, and exposes it to the other components - Prometheus via HTTP Service Discovery, and Cluster Monitor via its own REST API. It is designed to be stateless where possible, however maintaining enough state to function between restarts.
Bootstrapping can be handled through a .yaml configuration file, which gives it a list of clusters to monitor, authentication credentials, metrics ports (if non-default), and a set of seed nodes. The service connects to one node in each cluster and loads all the other nodes in it, then watches them periodically for changes to the cluster configuration. (Note that the bootstrapping file is optional, in which case the service starts with no known clusters - see below.)
We should also have the option for alternative sources of discovery - for example, querying the Kubernetes API for pods matching labels. Thus the "yaml bootstrapping" should be a pluggable interface (taking the example of Prometheus, which has static_config for hard-coded targets, as well as a variety of other mechanisms for discovering targets). For the time being, "static" and "k8s" should be sufficient - we can add others later when the time comes.
(Note that this is intended to replace the prom->CMOS mechanism currently in the Cluster Monitor, as that has a number of flaws enumerated above).
It provides a REST API to get the current nodes in the cluster. It also exposes this information in the format expected by Prometheus HTTP service discovery. To speed up update times and avoid components getting out of sync, it will also have a way of notifying components that they need to reload their configuration (Prometheus has /-/reload, Cluster Monitor should have something similar).
It should stream cluster topology updates from at least one node in the cluster to ensure it always stays up to date.
It is intentionally designed to care about as little as is necessary to do its job - the only required information about a cluster is its UUID (to distinguish nodes), list of nodes, and arbitrary metadata for labelling.
It should have a GUI for ease of configuration. However, writing up our own GUI for it is a lot of effort. Instead, I propose we reuse cluster monitor as a GUI, but instead of writing clusters to its sqlite database it uses the config service's REST API to notify it about changes.
Being able to do this implies some amount of mutability of the configuration, which I propose we handle through its .yaml configuration file (the same as mentioned above for bootstrapping). When told to add a new cluster, it updates this configuration file with the cluster and saves it to disk (which will often be a volume mount). There are cases where this file will not be writeable (for example Kubernetes ConfigMaps) - in these cases it should have a "read-only" flag in its REST API, to tell the Cluster Monitor that the list of clusters is immutable (which it should represent, for example, by greying out the "Add Cluster" button).
Couchbase Server 7's Prometheus /metrics endpoint requires HTTP basic authentication, which in Prometheus can only be configured in prometheus.yml. This implies that the Config Service has to be able to write an up-to-date prometheus.yml file with the credentials (which may be different for each cluster). However, customers will likely want to customise the Prometheus configuration to their needs. The most flexible solution I can think of is a Go template which the config service uses as a basis for the prometheus.yml.
The REST API implementation would ideally be auto-generated based on an OpenAPI spec or similar - for consistency, extensibility, and ease of external use.
Finally, the config service should expose some reasonable metrics for monitoring - likely in standard Prometheus format on /metrics. A config endpoint as well will be provided.
Cluster Monitor Changes
In short, the cluster store should be replaced by querying the config service's API. (We should likely keep a cache to avoid overloading it, but the config service should be the source of truth). For flexibility (e.g. local development / testing), we should separate the cluster information interface from the rest of the store interface, so that we can have multiple implementations. All other aspects of the store can remain unchanged.
Attachments
Issue Links
- is duplicated by
-
CMOS-58 Generic Couchbase cluster discovery framework
-
- Done
-
- is parent task of
-
CMOS-90 Provide a HTTP Service Discovery source
-
- To Do
-
-
CMOS-11 Add tags to clusters
-
- To Do
-
-
CMOS-96 Validate Cluster Monitor works in a "ship of Theseus" situation (all nodes replaced)
-
- Done
-
- relates to
-
CMOS-85 Prometheus discover assumes 7.x metrics
-
- Done
-
-
CMOS-101 Prometheus discovery: trying multiple ports is expensive
-
- To Do
-
-
CMOS-91 Prometheus Discovery doesn't handle non-default ports
-
- To Do
-
1.
|
Integrate Prometheus with config-svc |
|
To Do | Unassigned |
2.
|
Integrate Cluster Monitor with config-svc |
|
To Do | Unassigned |
3.
|
Generate Prometheus configuration from config-svc |
|
To Do | Unassigned |
4.
|
Config Service: Allow loading cluster credentials from k8s secrets |
|
To Do | Unassigned |
5.
|
Config Service: Change notifications |
|
To Do | Unassigned |
6.
|
Document cmos.yaml format |
|
To Do | Unassigned |
7.
|
Automated testing for the config service |
|
To Do | Unassigned |
