Description
I've got one node (101) down and one (102) up, and this is what the dashboard looks like:
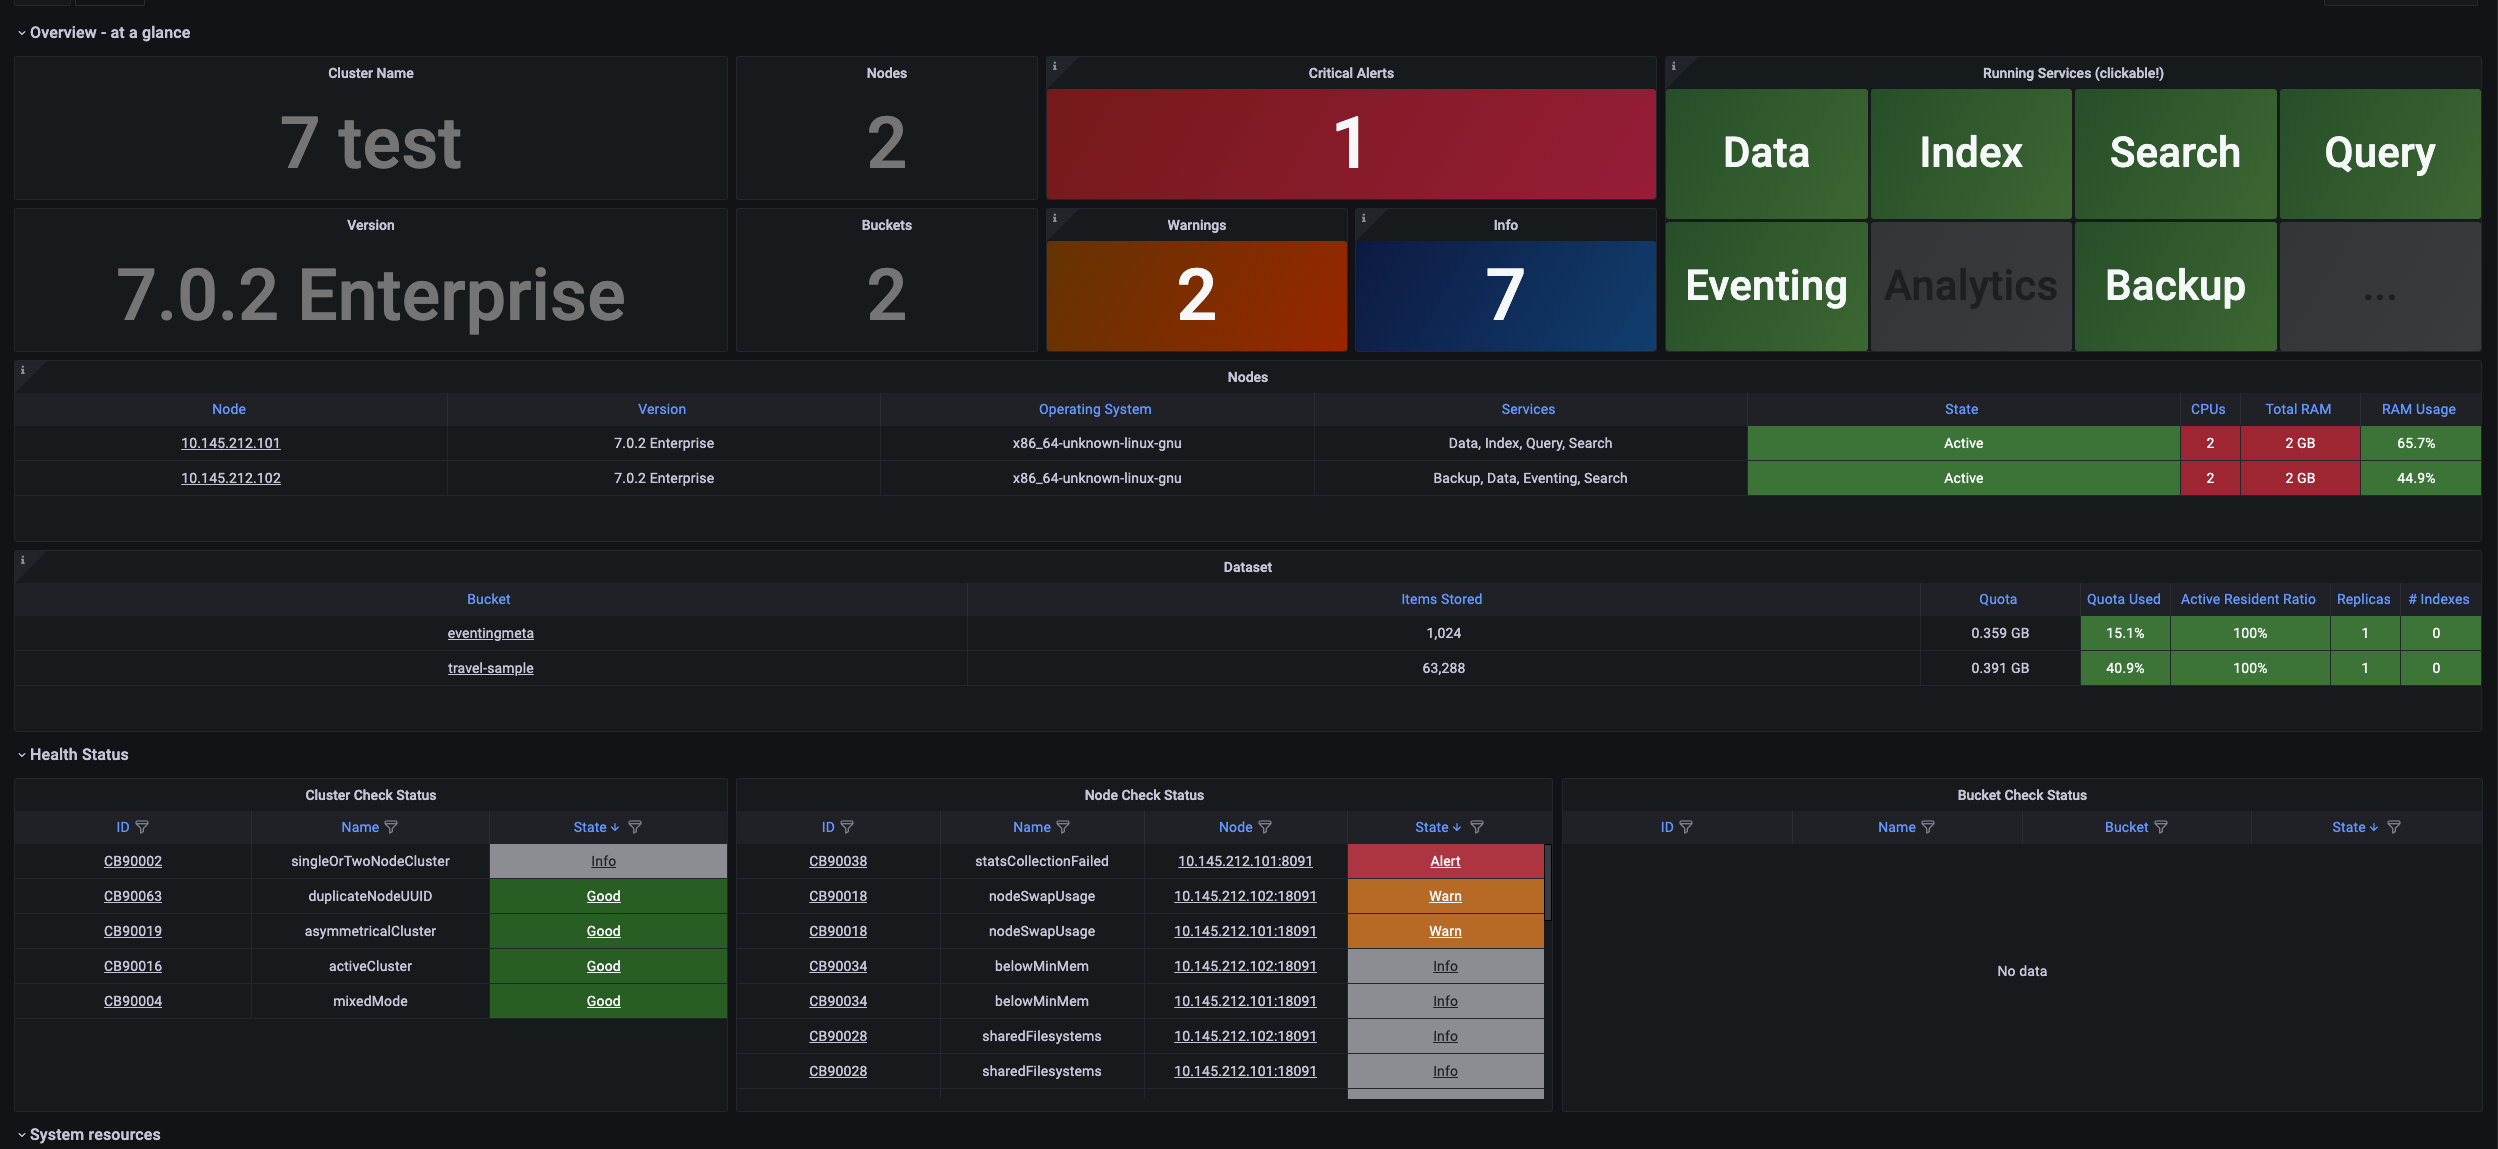
It's correctly identified that the Prometheus target is down (statsCollectionFailed), but the nodes table still says the node is Active.
I've got one node (101) down and one (102) up, and this is what the dashboard looks like:
It's correctly identified that the Prometheus target is down (statsCollectionFailed), but the nodes table still says the node is Active.
