Details
-
Improvement
-
Resolution: Done
-
 Major
Major
-
None
-
None
Description
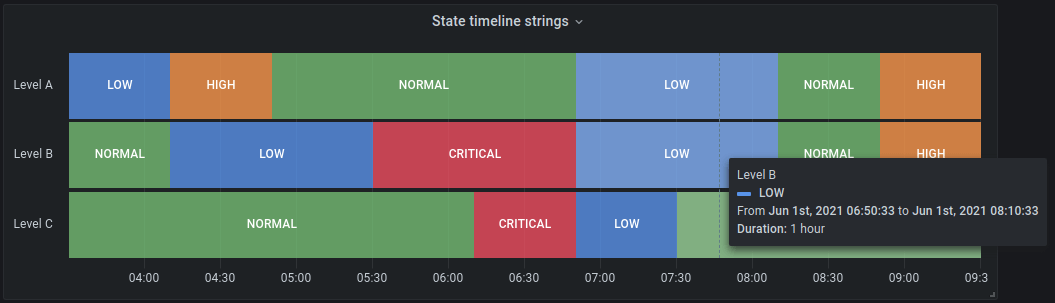
Grafana 8 has "State timeline" and "Status History" panels that would be perfect to plug our checker results into:

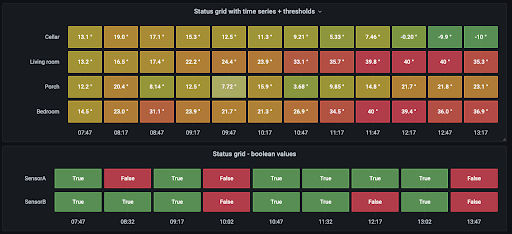
Unfortunately, the way we're currently outputing checker results (an incrementing gauge every time it changes) makes it difficult to work with this, because Grafana wants a single value to be the state to display (you can change what it represents using value mappings, for example "0 = good, 1 = bad", but it still expects a fixed set of values - and getting the current value out of the label using PromQL is an exercise in frustration).
I suggest that, instead of the current approach (an ever-incrementing gauge where the current state is a label), we have the current state be the value of the gauge, with the usual set of cluster/node/checker-name labels - for example, output 0 for good, 1 for warn, 2 for alert, etc.
/cc Patrick Stephens
Attachments

Issue Links
| For Gerrit Dashboard: CMOS-71 | ||||||
|---|---|---|---|---|---|---|
| # | Subject | Branch | Project | Status | CR | V |
| 162647,2 | CMOS-71 Change Prometheus stats to be enumerations | master | cbmultimanager | Status: MERGED | +2 | +1 |