Details
-
Task
-
Resolution: Resolved
-
 Major
Major
-
None
-
None
-
None
-
None
-
0
-
SDK06
Description
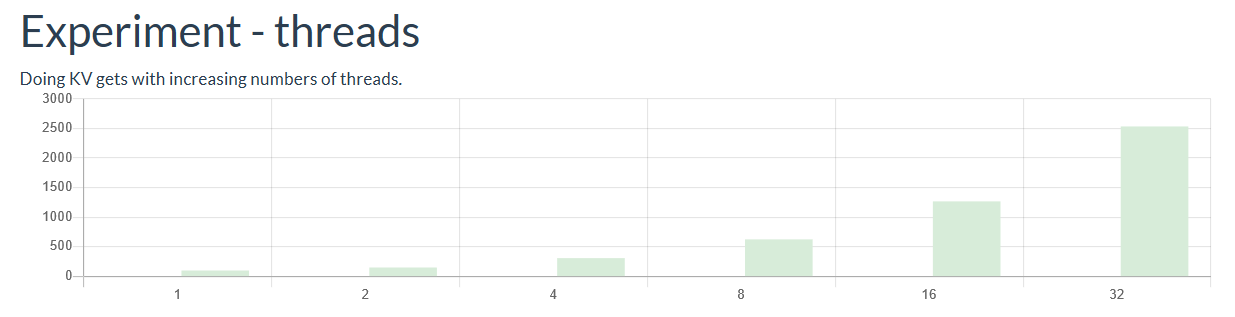
Results from running the Node performer with an increasing number of threads show performance to degrade more than expected, e.g. running a KV Get in a single-threaded scenario averages to a fast <100µs, but increases to ~2500µs at 32 threads, with a ~linear relationship between latency & number of threads.
It would be worthwhile to run the Node performer through with a profiler to see where that time is being lost, and find any obvious performance issues with the performer, or the SDK.
Attached are a generated flame graph and output from the built-in Node profiler, from running KV gets with 20 threads for 60 seconds. Seemingly there is nothing obvious that the performer is doing wrong, the majority of the time is spent in the SDK as we would expect, the rest of the time being batching and GRPC, which aren't taking any more time than expected. Node's event loop concurrency just doesn't seem to scale as well as the multithreading/multiprocessing used in the other performers, Node's multiprocessing capabilities should be looked into as a solution to this scaling issue.