Details
-
Bug
-
Resolution: Fixed
-
 Critical
-
3.0.2, 4.0.0
-
Security Level: Public
-
None
-
Untriaged
-
Yes
-
Mar 9 - Mar 27
Description
Attempting to load up a very large dataset, running 4 cbc-pillowfight commands:
cbc-pillowfight -U couchbase://ec2-54-193-209-18.us-west-1.compute.amazonaws.com/event_stream -t 16 -m 5120 -M 5120 -I 400000000 -B 1000 --sequential -r 100 -p `hostname`
Cluster is 4 nodes (c3.2.xlarge), ~16GB of RAM per node, bucket quota set to 11.9GB/node.
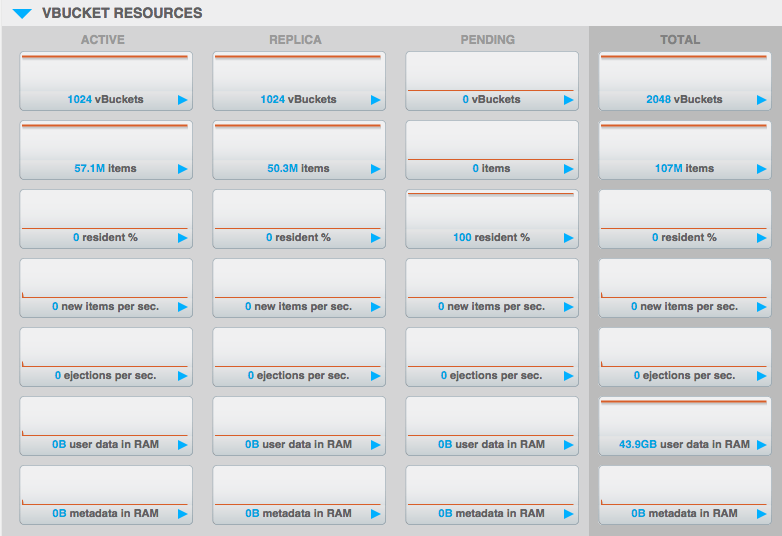
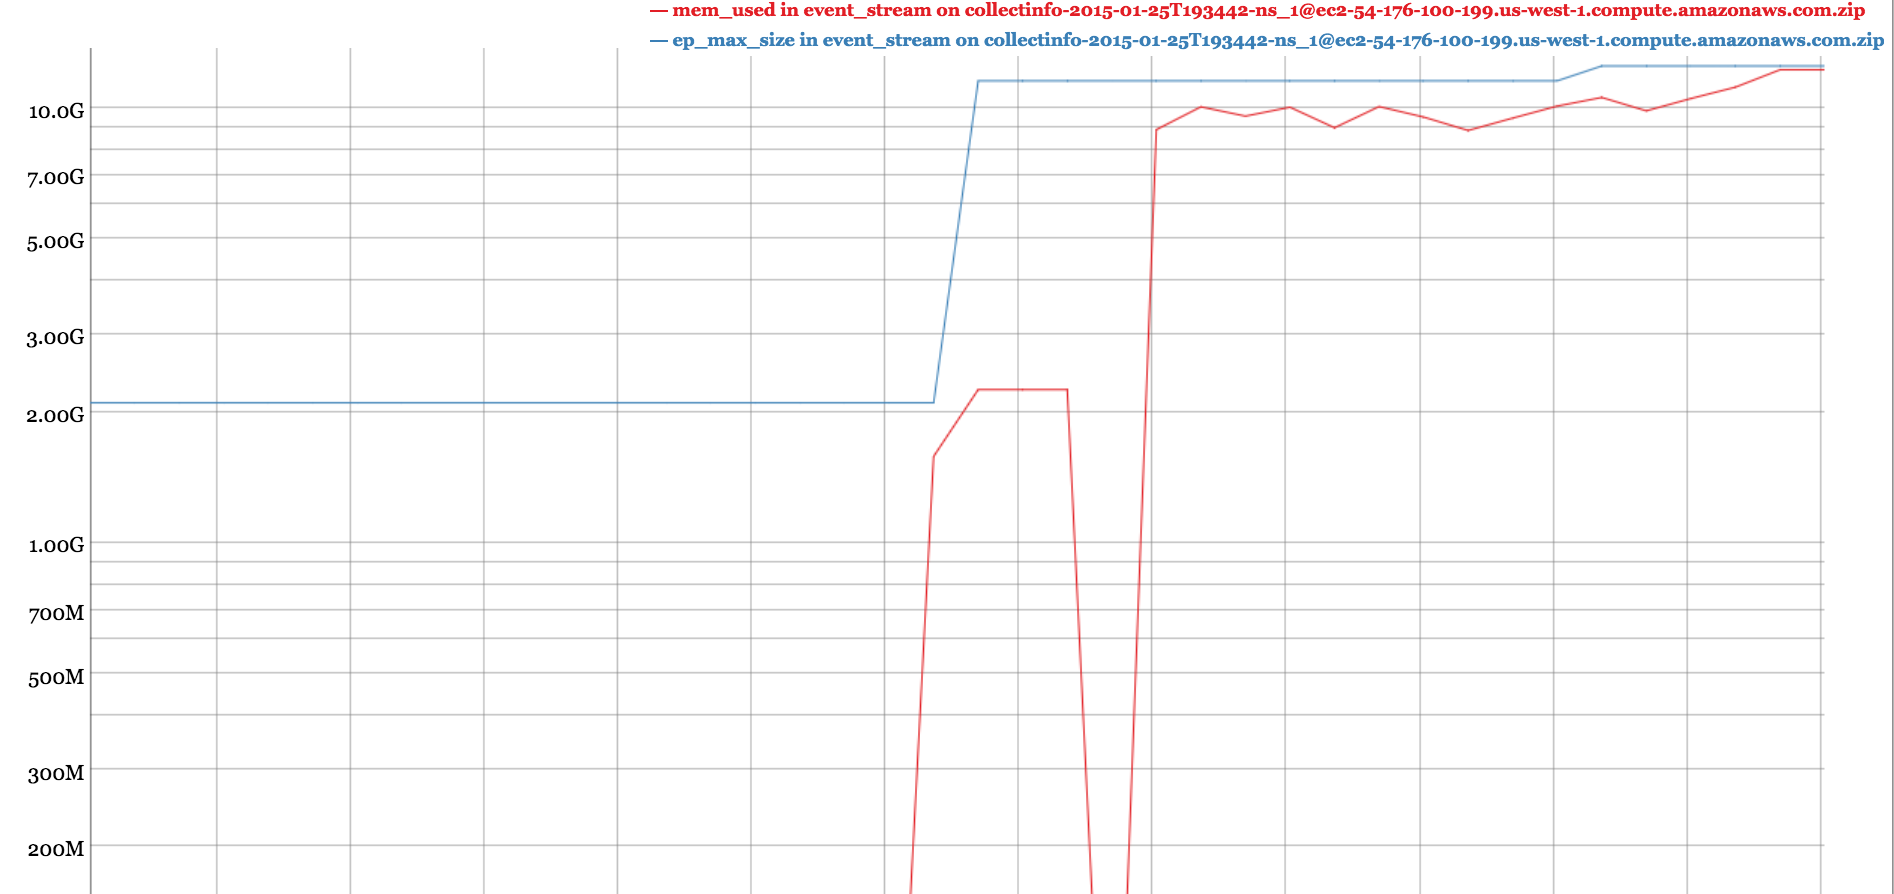
Ingestion of data was proceeding very well, around 50k sets/sec and draining to disk fine. The resident ratio was dropping as expected, but at some point the memory started to shoot up above the high watermark and eventually resulted in hard OOM.
See attached screenshot...all "user data" and "metadata" has been ejected, yet there is still >40GB listed as "user data" in the total which corresponds to how much memory memcached is holding onto.
Is this a known tcmalloc issue or something else?
Logs are at:
https://s3.amazonaws.com/cb-customers/perry/hardoom/collectinfo-2015-01-25T193442-ns_1%40ec2-54-176-100-199.us-west-1.compute.amazonaws.com.zip
https://s3.amazonaws.com/cb-customers/perry/hardoom/collectinfo-2015-01-25T193442-ns_1%40ec2-54-176-187-33.us-west-1.compute.amazonaws.com.zip
https://s3.amazonaws.com/cb-customers/perry/hardoom/collectinfo-2015-01-25T193442-ns_1%40ec2-54-193-209-18.us-west-1.compute.amazonaws.com.zip
https://s3.amazonaws.com/cb-customers/perry/hardoom/collectinfo-2015-01-25T193442-ns_1%40ec2-54-219-36-68.us-west-1.compute.amazonaws.com.zip
Attachments
Issue Links
- blocks
-
-

- Closed
-