Details
Description
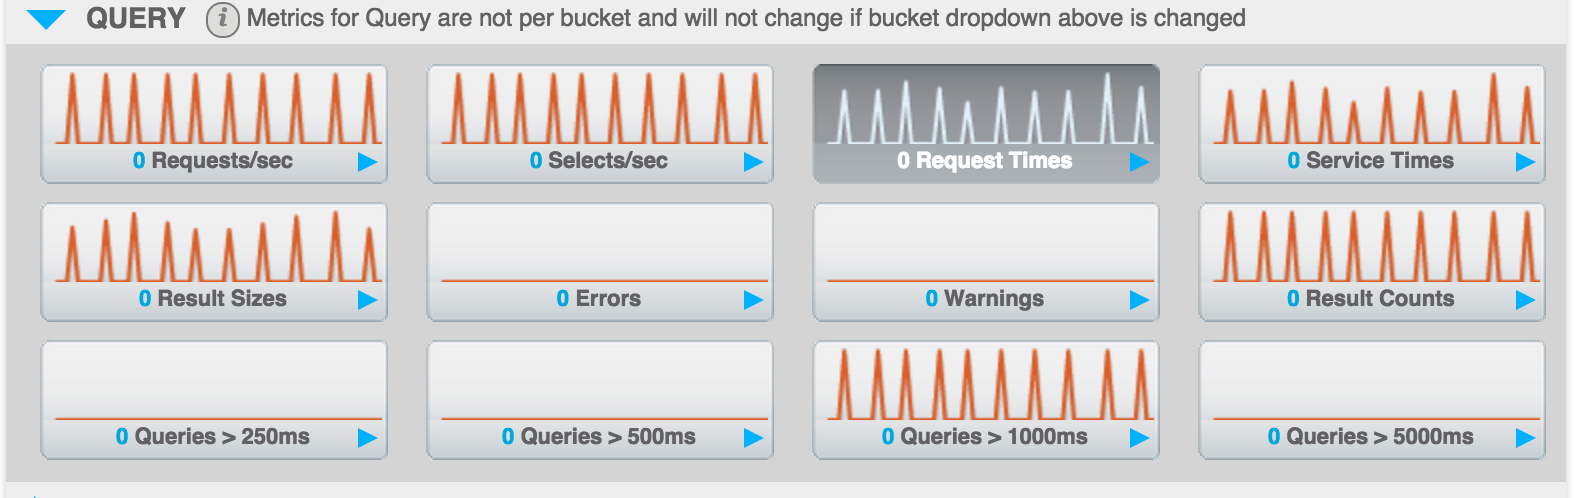
I've been doing some client testing and from the UI you can see a query which takes longer than a second shows up in the > 1s stats but not in the 250 and 500ms ones.. but from a logical point of view a request that takes longer than 1 second also takes longer than 250 and 500.
Attachments
| For Gerrit Dashboard: MB-14247 | ||||||
|---|---|---|---|---|---|---|
| # | Subject | Branch | Project | Status | CR | V |
| 49951,1 | If a query takes > y, update all > x metrics for y > x. MB-14247. | master | query | Status: ABANDONED | +1 | 0 |
| 52893,4 | MB-14247 : Merge Colms changes to include all results in UI metrics | master | query | Status: MERGED | +2 | +1 |