Details
Description
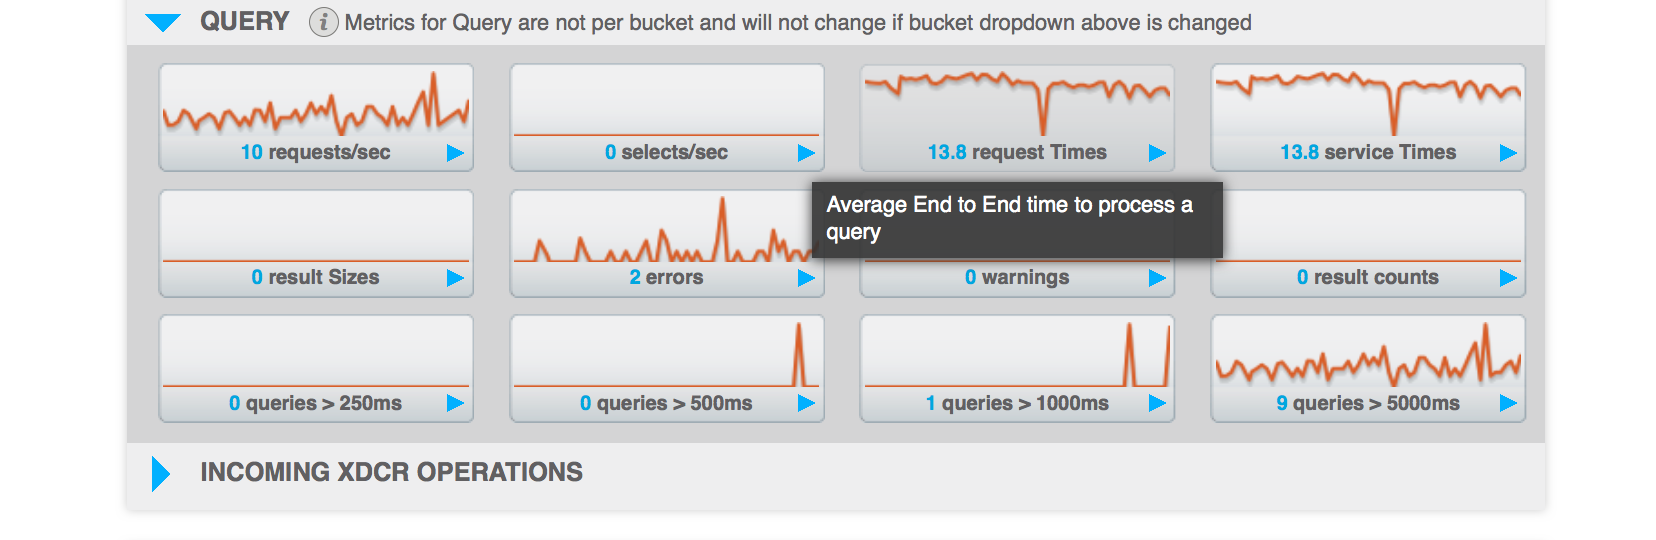
Noticed that the 2 columns
- request Times - Average end to end time to process query
- service Times - Average time to execute query
actually represent the time and not times( which can be interpreted as a multiple etc)
Attached screenshot
Attachments
| For Gerrit Dashboard: MB-14938 | ||||||
|---|---|---|---|---|---|---|
| # | Subject | Branch | Project | Status | CR | V |
| 51118,2 | MB-14938: Fix some typos and format. | master | ns_server | Status: MERGED | +2 | +1 |