Description
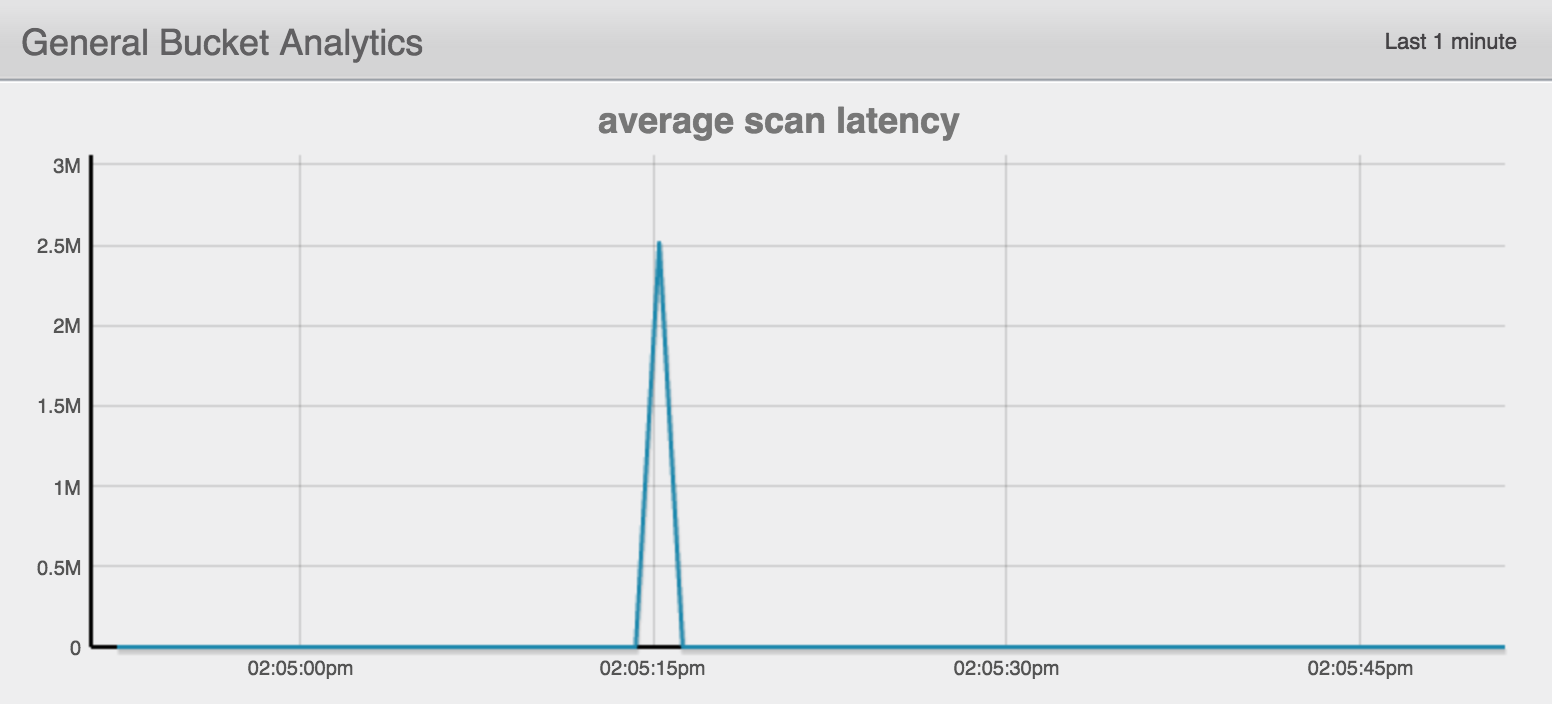
See the image above. I assume this is returning some sort of absolute time, but in any case the results are confusing.
Attachments
| For Gerrit Dashboard: MB-15104 | ||||||
|---|---|---|---|---|---|---|
| # | Subject | Branch | Project | Status | CR | V |
| 51364,3 | MB-15104: average scan latency time in nanoseconds | master | ns_server | Status: MERGED | +2 | +1 |