Details
Description
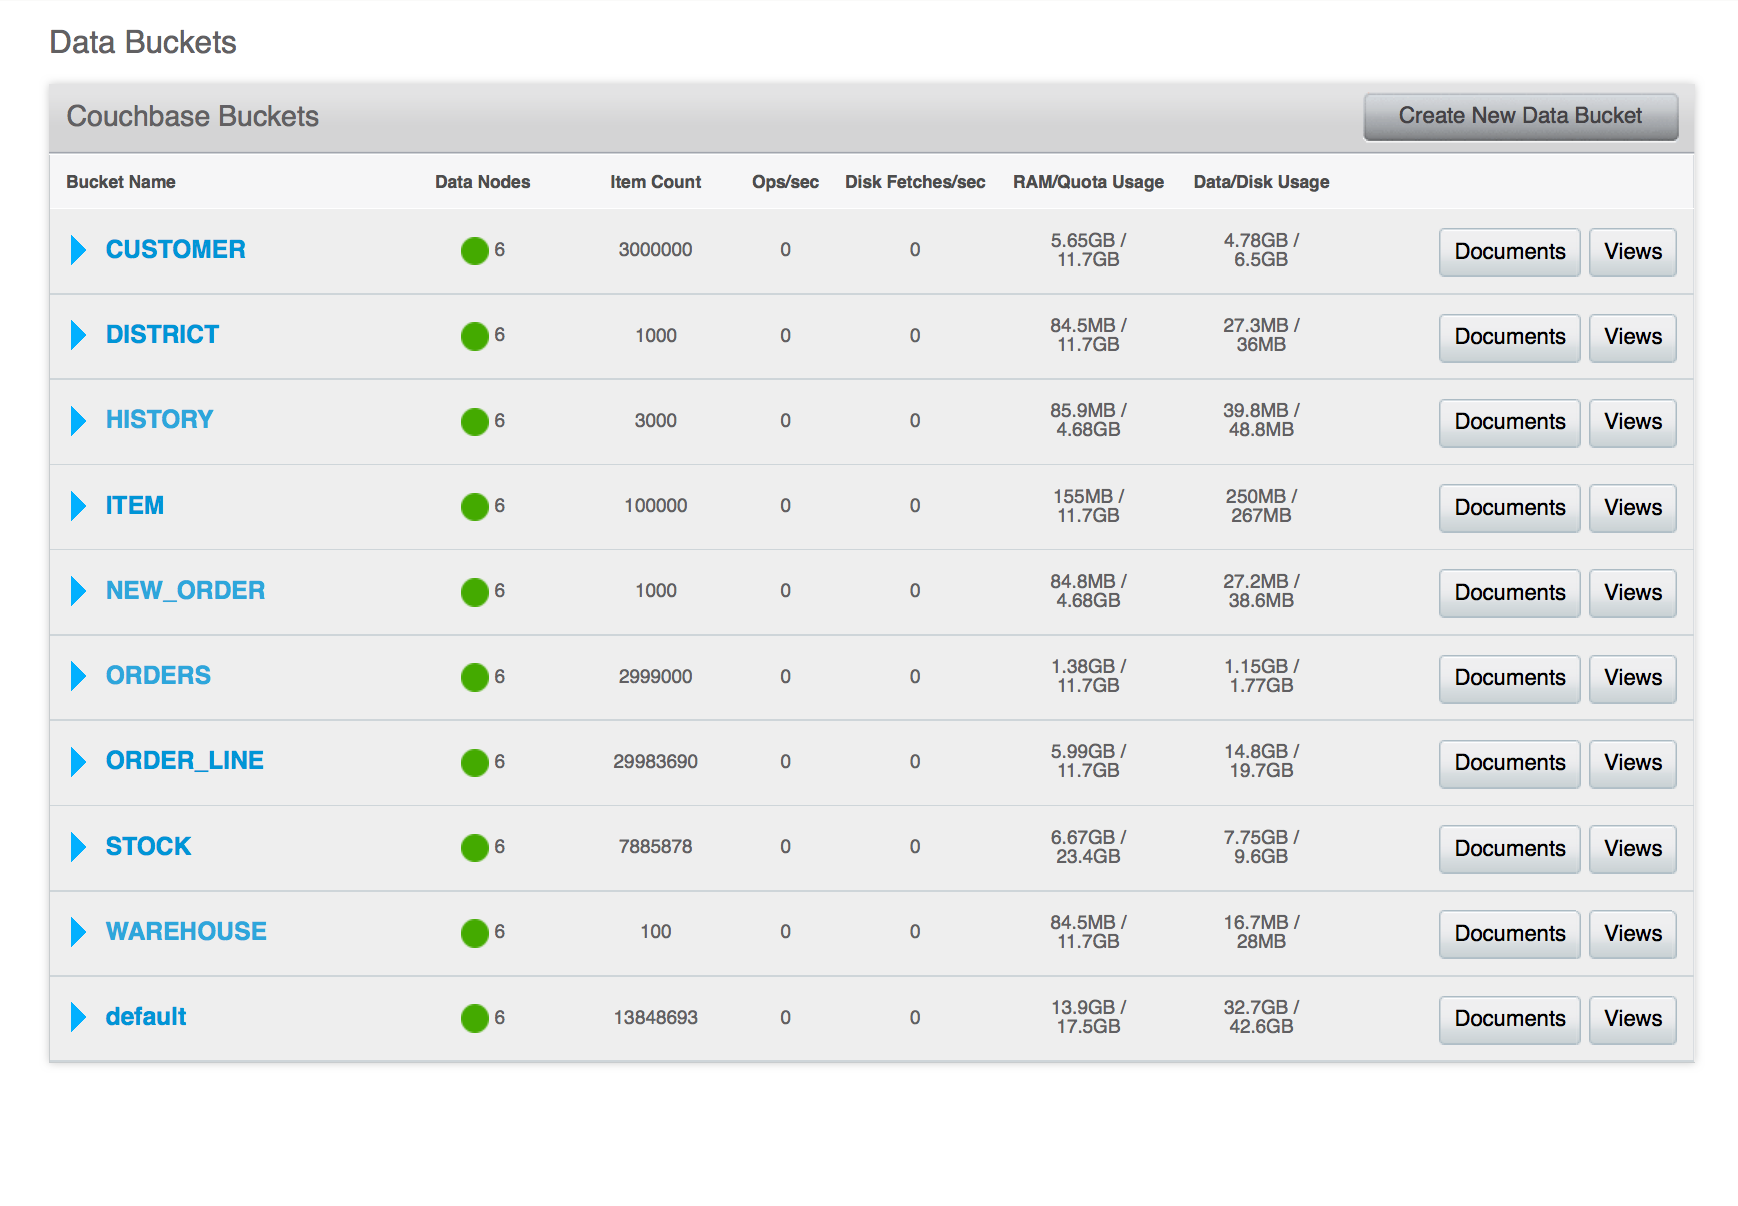
1. Load data using tpcc workload on the buckets
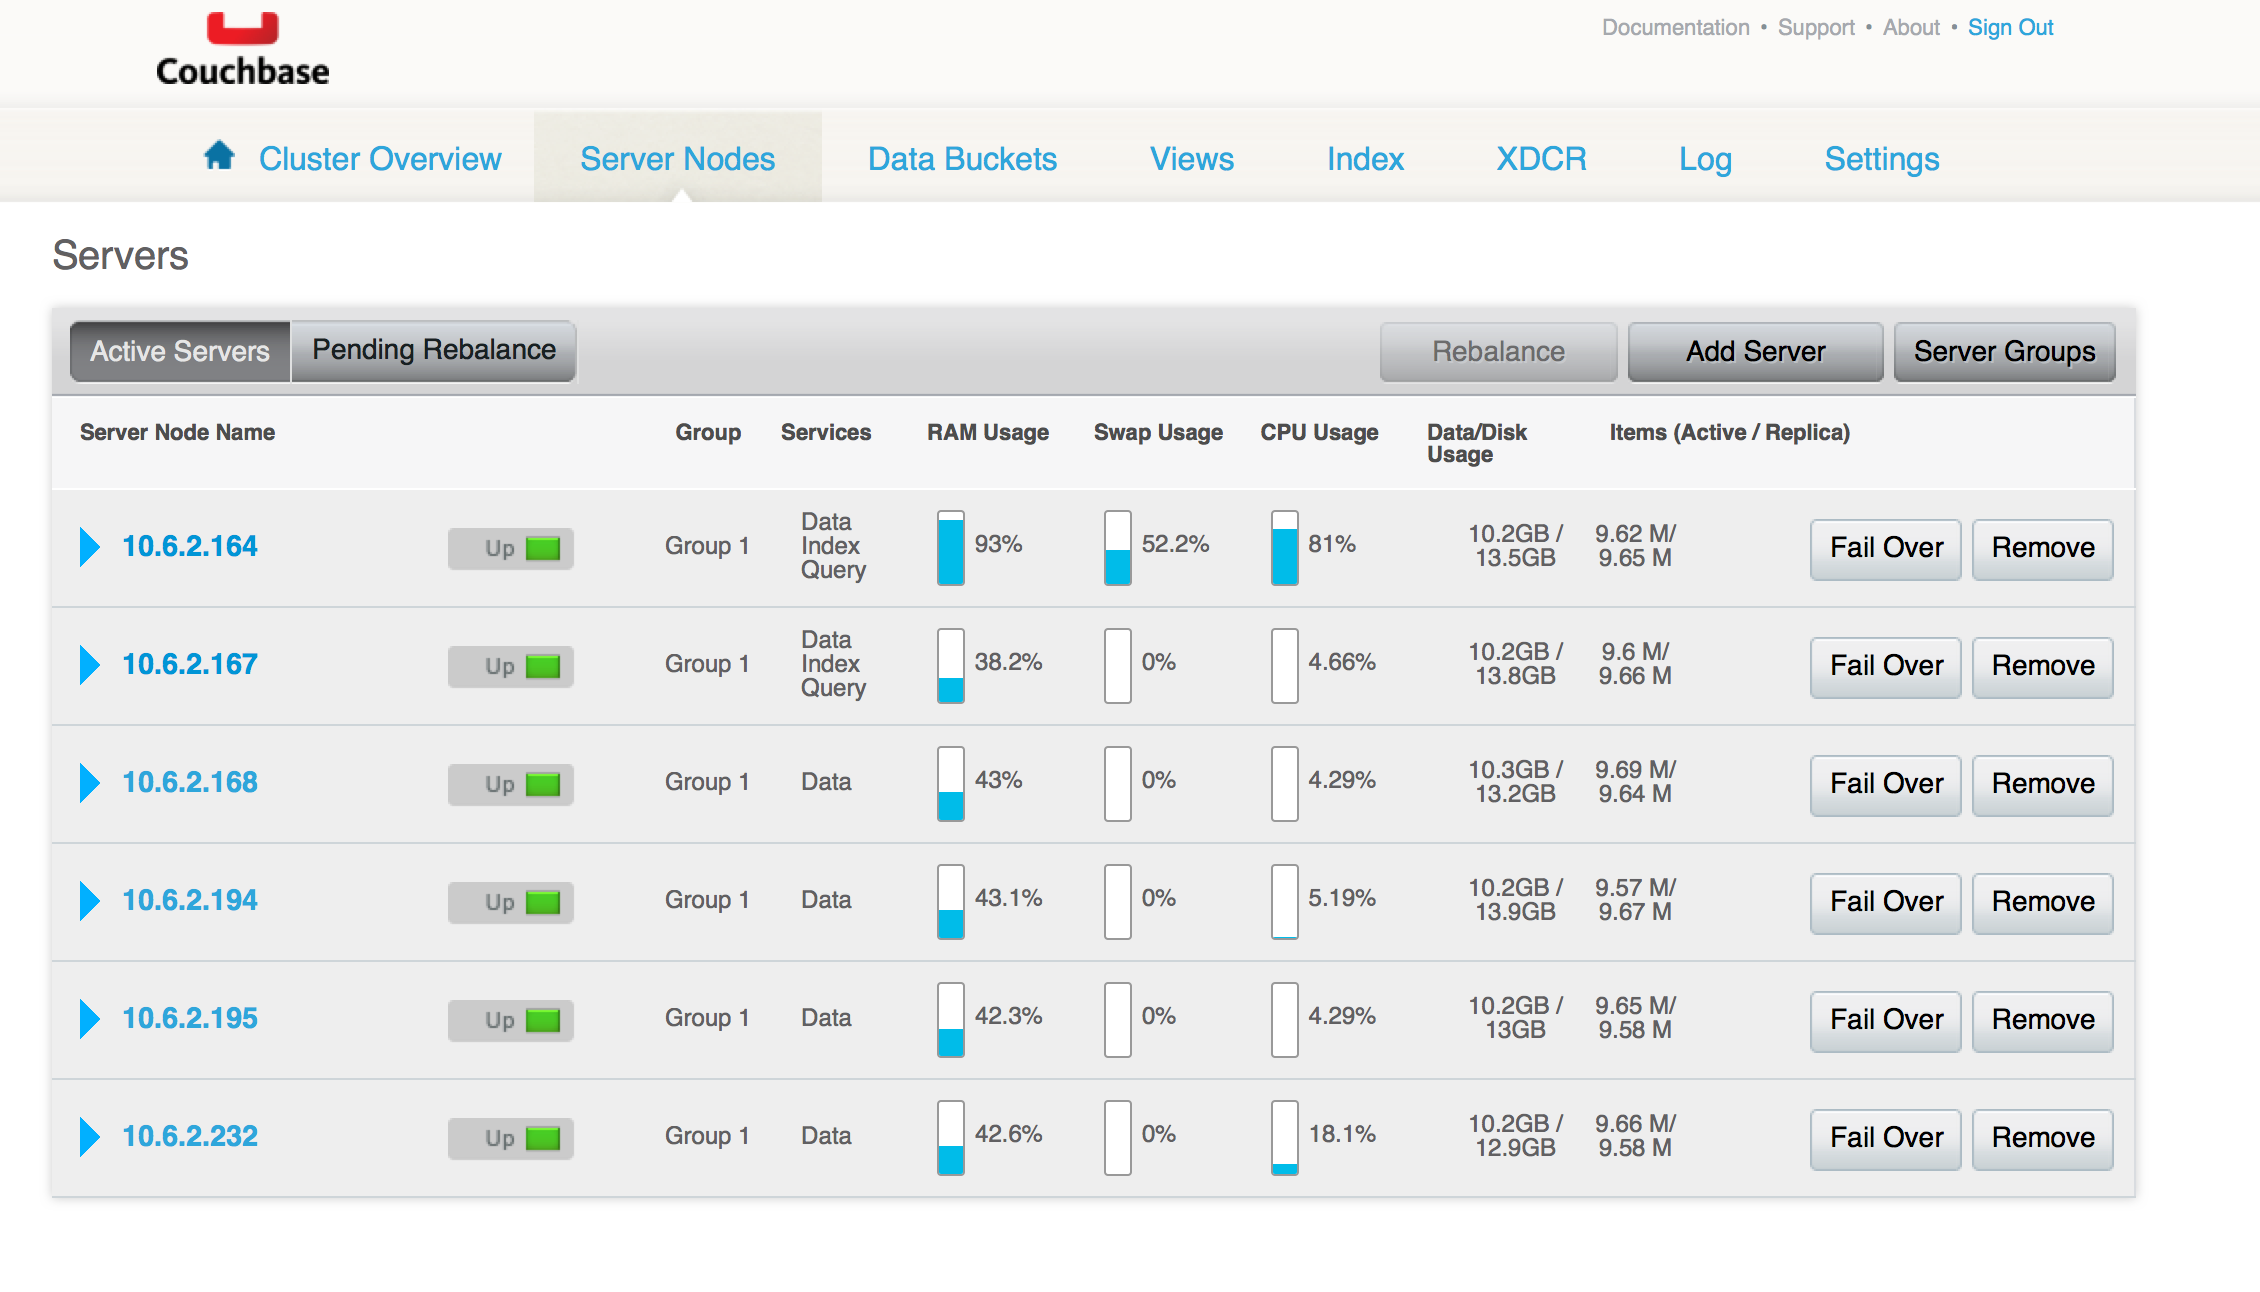
2. The UI appears to be consistent when I started the run on Friday, today most of the buckets ( 3 days after) have empty stats for index stats.
The getIndexStatus shows "Failed to retrieve metadata from one of the index nodes 10.6.2.167"
Ketakis-MacBook-Pro:~ ketaki$ curl -v -u Administrator:password 10.6.2.164:9102/getIndexStatus | jq '.'
- About to connect() to 10.6.2.164 port 9102 (#0)
- Trying 10.6.2.164...
- Adding handle: conn: 0x7fe9eb003a00
- Adding handle: send: 0
- Adding handle: recv: 0
- Curl_addHandleToPipeline: length: 1
- - Conn 0 (0x7fe9eb003a00) send_pipe: 1, recv_pipe: 0
% Total % Received % Xferd Average Speed Time Time Time Current
Dload Upload Total Spent Left Speed
0 0 0 0 0 0 0 0 -::- -::- -::- 0* Connected to 10.6.2.164 (10.6.2.164) port 9102 (#0) - Server auth using Basic with user 'Administrator'
> GET /getIndexStatus HTTP/1.1
> Authorization: Basic QWRtaW5pc3RyYXRvcjpwYXNzd29yZA==
> User-Agent: curl/7.30.0
> Host: 10.6.2.164:9102
> Accept: /
>
< HTTP/1.1 200 OK
< Content-Type: application/json
< Date: Tue, 26 May 2015 16:36:21 GMT
< Transfer-Encoding: chunked
<
{ [data not shown]
100 2585 0 2585 0 0 7504 0 -::- -::- -::- 7492 - Connection #0 to host 10.6.2.164 left intact
{
"code": "error",
"error": "Fail to retrieve cluster-wide metadata from index service",
"failedNodes": [
"10.6.2.167:9102"
],
"status": [
{ "defnId": 17888528285049684000, "name": "PX_ORDER_LINE", "bucket": "ORDER_LINE", "isPrimary": true, "status": "Ready", "definition": "CREATE PRIMARY INDEX PX_ORDER_LINE ON ORDER_LINE USING GSI", "hosts": [ "10.6.2.164:8091" ], "completion": 100 },
{ "defnId": 7231048663350699000, "name": "CU_ID_D_ID_W_ID", "bucket": "CUSTOMER", "secExprs": [ "`C_ID`", "`C_D_ID`", "`C_W_ID`" ], "status": "Ready", "definition": "CREATE INDEX CU_ID_D_ID_W_ID ON CUSTOMER(`C_ID`,`C_D_ID`,`C_W_ID`) USING GSI", "hosts": [ "10.6.2.164:8091" ], "completion": 100 }
,
{ "defnId": 9609226901563103000, "name": "IT_ID", "bucket": "ITEM", "secExprs": [ "`I_ID`" ], "status": "Ready", "definition": "CREATE INDEX IT_ID ON ITEM(`I_ID`) USING GSI", "hosts": [ "10.6.2.164:8091" ], "completion": 100 }
,
{ "defnId": 9632591663386833000, "name": "CU_W_ID_D_ID_LAST", "bucket": "CUSTOMER", "secExprs": [ "`C_W_ID`", "`C_D_ID`", "`C_LAST`" ], "status": "Ready", "definition": "CREATE INDEX CU_W_ID_D_ID_LAST ON CUSTOMER(`C_W_ID`,`C_D_ID`,`C_LAST`) USING GSI", "hosts": [ "10.6.2.164:8091" ], "completion": 100 }
,
{ "defnId": 11372528481751935000, "name": "px_history", "bucket": "HISTORY", "isPrimary": true, "status": "Ready", "definition": "CREATE PRIMARY INDEX px_history ON HISTORY USING GSI", "hosts": [ "10.6.2.164:8091" ], "completion": 100 }
,
{ "defnId": 14742045013308854000, "name": "seq_num", "bucket": "default", "secExprs": [ "`SequenceNumber`" ], "status": "Ready", "definition": "CREATE INDEX seq_num ON default(`SequenceNumber`) USING GSI", "hosts": [ "10.6.2.164:8091" ], "completion": 100 }
,
{ "defnId": 1503142693051335400, "name": "NO_D_ID_W_ID", "bucket": "NEW_ORDER", "secExprs": [ "`NO_O_ID`", "`NO_D_ID`", "`NO_W_ID`" ], "status": "Ready", "definition": "CREATE INDEX NO_D_ID_W_ID ON NEW_ORDER(`NO_O_ID`,`NO_D_ID`,`NO_W_ID`) USING GSI", "hosts": [ "10.6.2.164:8091" ], "completion": 100 }
,
{ "defnId": 15061203809293226000, "name": "PX_STOCK", "bucket": "STOCK", "isPrimary": true, "status": "Ready", "definition": "CREATE PRIMARY INDEX PX_STOCK ON STOCK USING GSI", "hosts": [ "10.6.2.164:8091" ], "completion": 100 }
,
{ "defnId": 5235702359980121000, "name": "PX_WAREHOUSE", "bucket": "WAREHOUSE", "isPrimary": true, "status": "Ready", "definition": "CREATE PRIMARY INDEX PX_WAREHOUSE ON WAREHOUSE USING GSI", "hosts": [ "10.6.2.164:8091" ], "completion": 100 }
,
{ "defnId": 7653756408553295000, "name": "OR_O_ID_D_ID_W_ID", "bucket": "ORDERS", "secExprs": [ "`O_ID`", "`O_D_ID`", "`O_W_ID`", "`O_C_ID`" ], "status": "Ready", "definition": "CREATE INDEX OR_O_ID_D_ID_W_ID ON ORDERS(`O_ID`,`O_D_ID`,`O_W_ID`,`O_C_ID`) USING GSI", "hosts": [ "10.6.2.164:8091" ], "completion": 100 }]
}
Also the error.log on the index node shows
ns_server:error,2015-05-26T09:40:19.513-07:00,ns_1@10.6.2.167:index_status_keeper_worker<0.424.0>:index_rest:get_json:45]Request to http://127.0.0.1:9102/getIndexStatus failed: {error,
{econnrefused,
[{lhttpc_client,
send_request,1,
[
{line,220}]},
{lhttpc_client,
execute,9,
[{file, "/home/couchbase/jenkins/workspace/sherlock-unix/couchdb/src/lhttpc/lhttpc_client.erl"}
,
]},
{lhttpc_client,
request,9,
[
,
]}]}}
To figure out the issue, I did a couchbase stop/start service, but I could see the missing stats issue much before I did any restarts of couchbase-server.
Logs
https://s3.amazonaws.com/cb-customers/indexer/1/collectinfo-2015-05-26T162139-ns_1%4010.6.2.164.zip
https://s3.amazonaws.com/cb-customers/indexer/1/collectinfo-2015-05-26T162139-ns_1%4010.6.2.168.zip
https://s3.amazonaws.com/cb-customers/indexer/1/collectinfo-2015-05-26T162139-ns_1%4010.6.2.194.zip
https://s3.amazonaws.com/cb-customers/indexer/1/collectinfo-2015-05-26T162139-ns_1%4010.6.2.195.zip