Details
-
Bug
-
Resolution: Cannot Reproduce
-
 Critical
-
4.5.0
-
None
-
Untriaged
-
Unknown
Description
Logs here:
https://s3.amazonaws.com/cb-engineering/davidH/collectinfo-2016-05-05T105949-ns_1%40dhaikney-server-1.c.cb-googbench-101.internal.zip
https://s3.amazonaws.com/cb-engineering/davidH/collectinfo-2016-05-05T105949-ns_1%40dhaikney-server-2.c.cb-googbench-101.internal.zip
https://s3.amazonaws.com/cb-engineering/davidH/collectinfo-2016-05-05T105949-ns_1%40dhaikney-server-3.c.cb-googbench-101.internal.zip
https://s3.amazonaws.com/cb-engineering/davidH/collectinfo-2016-05-05T105949-ns_1%40dhaikney-server-4.c.cb-googbench-101.internal.zip
4 node cluster, Watson Beta, Ubuntu-14, Running on Google Compute Engine. Full Eviction, 1 replica.
Loading 100M x 512 byte docs using the following pillowfight invocation:
cbc-pillowfight -U couchbase://dhaikney-server-1/charlie -I 102400000 -m 512 -M 512 -t 16 -B 10 --sequential --rate-limit 10000
|
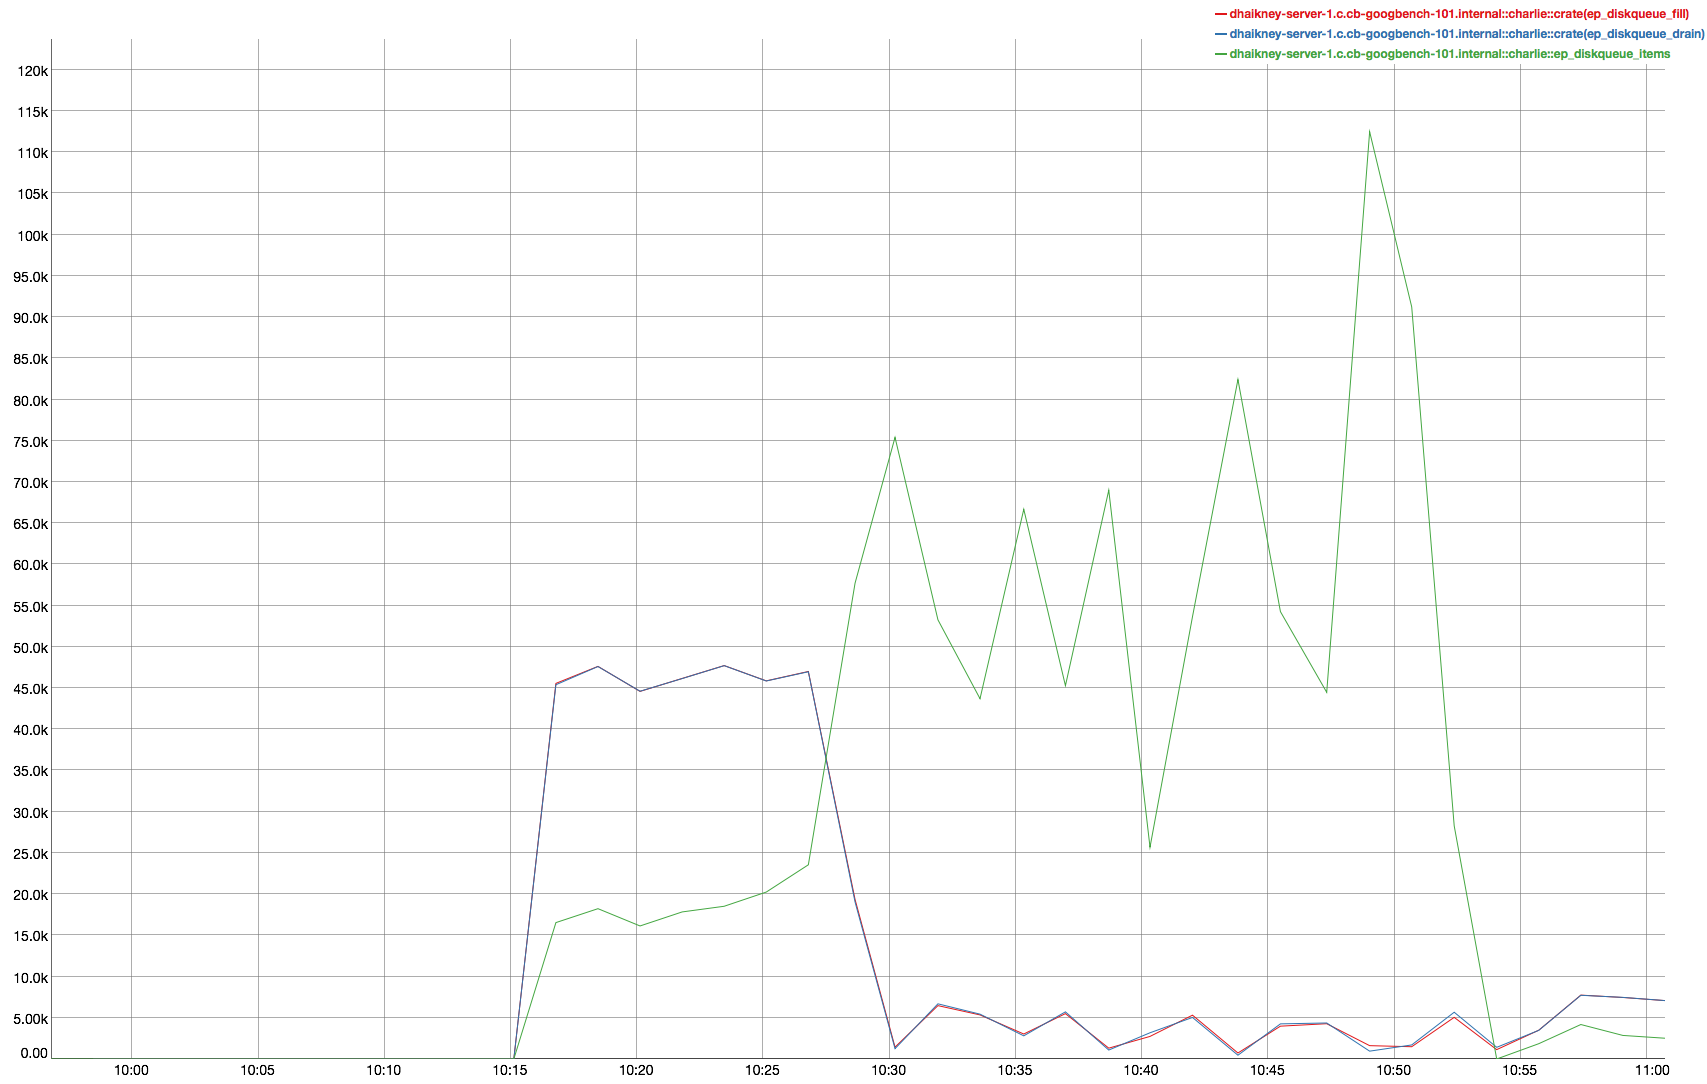
Ops started steady (~100K inserts/sec) but then at around 60M docs, the performance cratered and the rate dropped considerably. I initially suspected a client problem but the memcached logs were rife with warnings of slow ops (e.g.):
2016-05-05T11:02:39.650695Z WARNING 117: Slow SET operation on connection: 679 ms ([ 10.240.0.10:59579 - 10.240.0.2:11210 ])
|
2016-05-05T11:02:41.221269Z WARNING 117: Slow SET operation on connection: 1550 ms ([ 10.240.0.10:59579 - 10.240.0.2:11210 ])
|
2016-05-05T11:02:41.247627Z WARNING 119: Slow SET operation on connection: 1466 ms ([ 10.240.0.10:59584 - 10.240.0.2:11210 ])
|
2016-05-05T11:02:41.270983Z WARNING 101: Slow SET operation on connection: 2010 ms ([ 10.240.0.10:59629 - 10.240.0.2:11210 ])
|
- Data set was 100% resident and well below the Low Water Mark. DWQ and DCP queue looked healthy.
- A quick profile didn't show any obvious CPU bottlenecks (memcached threads were all comfortably under 100%).
- The workload didn't recover and eventually had to be killed. Restarting with a lighter workload seemed OK (logs captured whilst subsequent workload was running).