Details
-
Bug
-
Resolution: Fixed
-
 Major
Major
-
5.0.0
-
None
-
Untriaged
-
Centos 64-bit
-
Unknown
Description
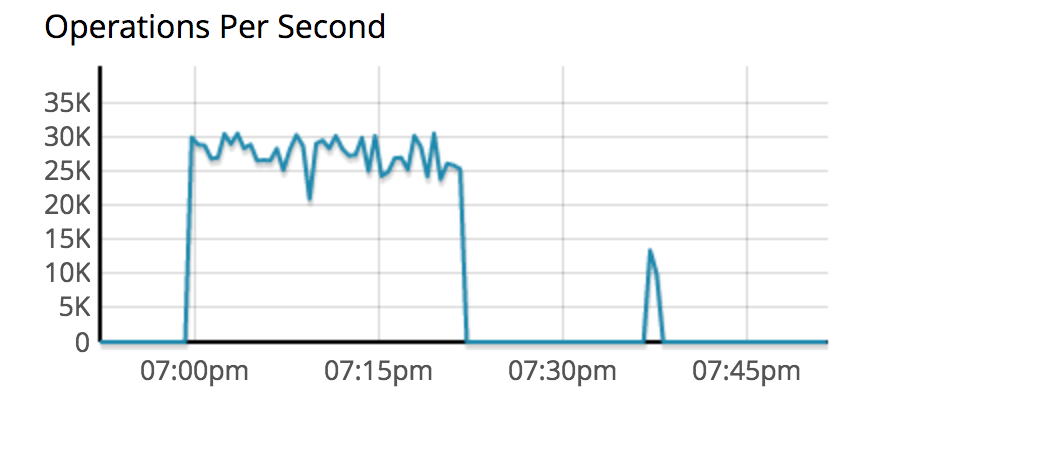
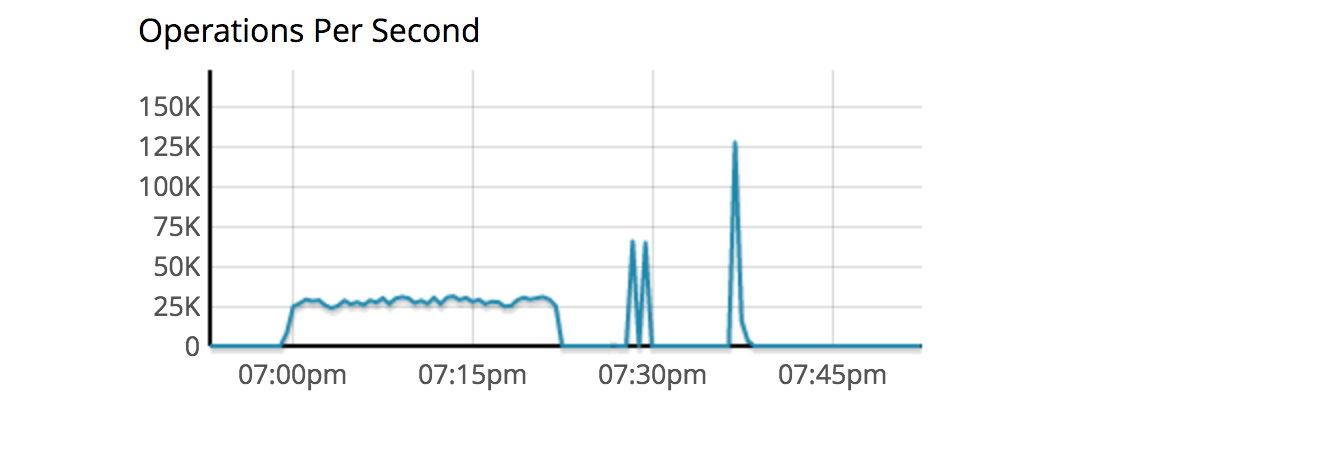
There is something really funky with the operations / second statistics and graphs on Spock.
I ran an update for over 7 minutes which updated over 2 million docs. The ops/sec on the UI didn't move from zero while viewing the "Bucket Screen"
cbq> update i360 set countrycode='US' where countrycode in["BZ","BS","BO","BT"];
{
"requestID": "de6c42a0-1608-459a-8ffc-672cd02ce016",
"signature": null,
"results": [
],
"status": "success",
"metrics": {
"elapsedTime": "7m11.804462689s",
"executionTime": "7m11.804403488s",
"resultCount": 0,
"resultSize": 0,
"mutationCount": 2535692
}
}
Now that the update is over and literally nothing is going on the the cluster (7:50 PM). The graph is continuously changing its scale from 30K to 150K there are no mutations hitting the cluster the graph is on the fritz.
Something seems to be wrong with the stats collection, this shouldn't be jumping around. Aggregate stats across the cluster for the bucket should be consistent