Details
-
Bug
-
Resolution: Fixed
-
 Major
Major
-
5.0.0
-
Firefox 52
-
Triaged
-
No
Description
Build : 5.0.0-2747
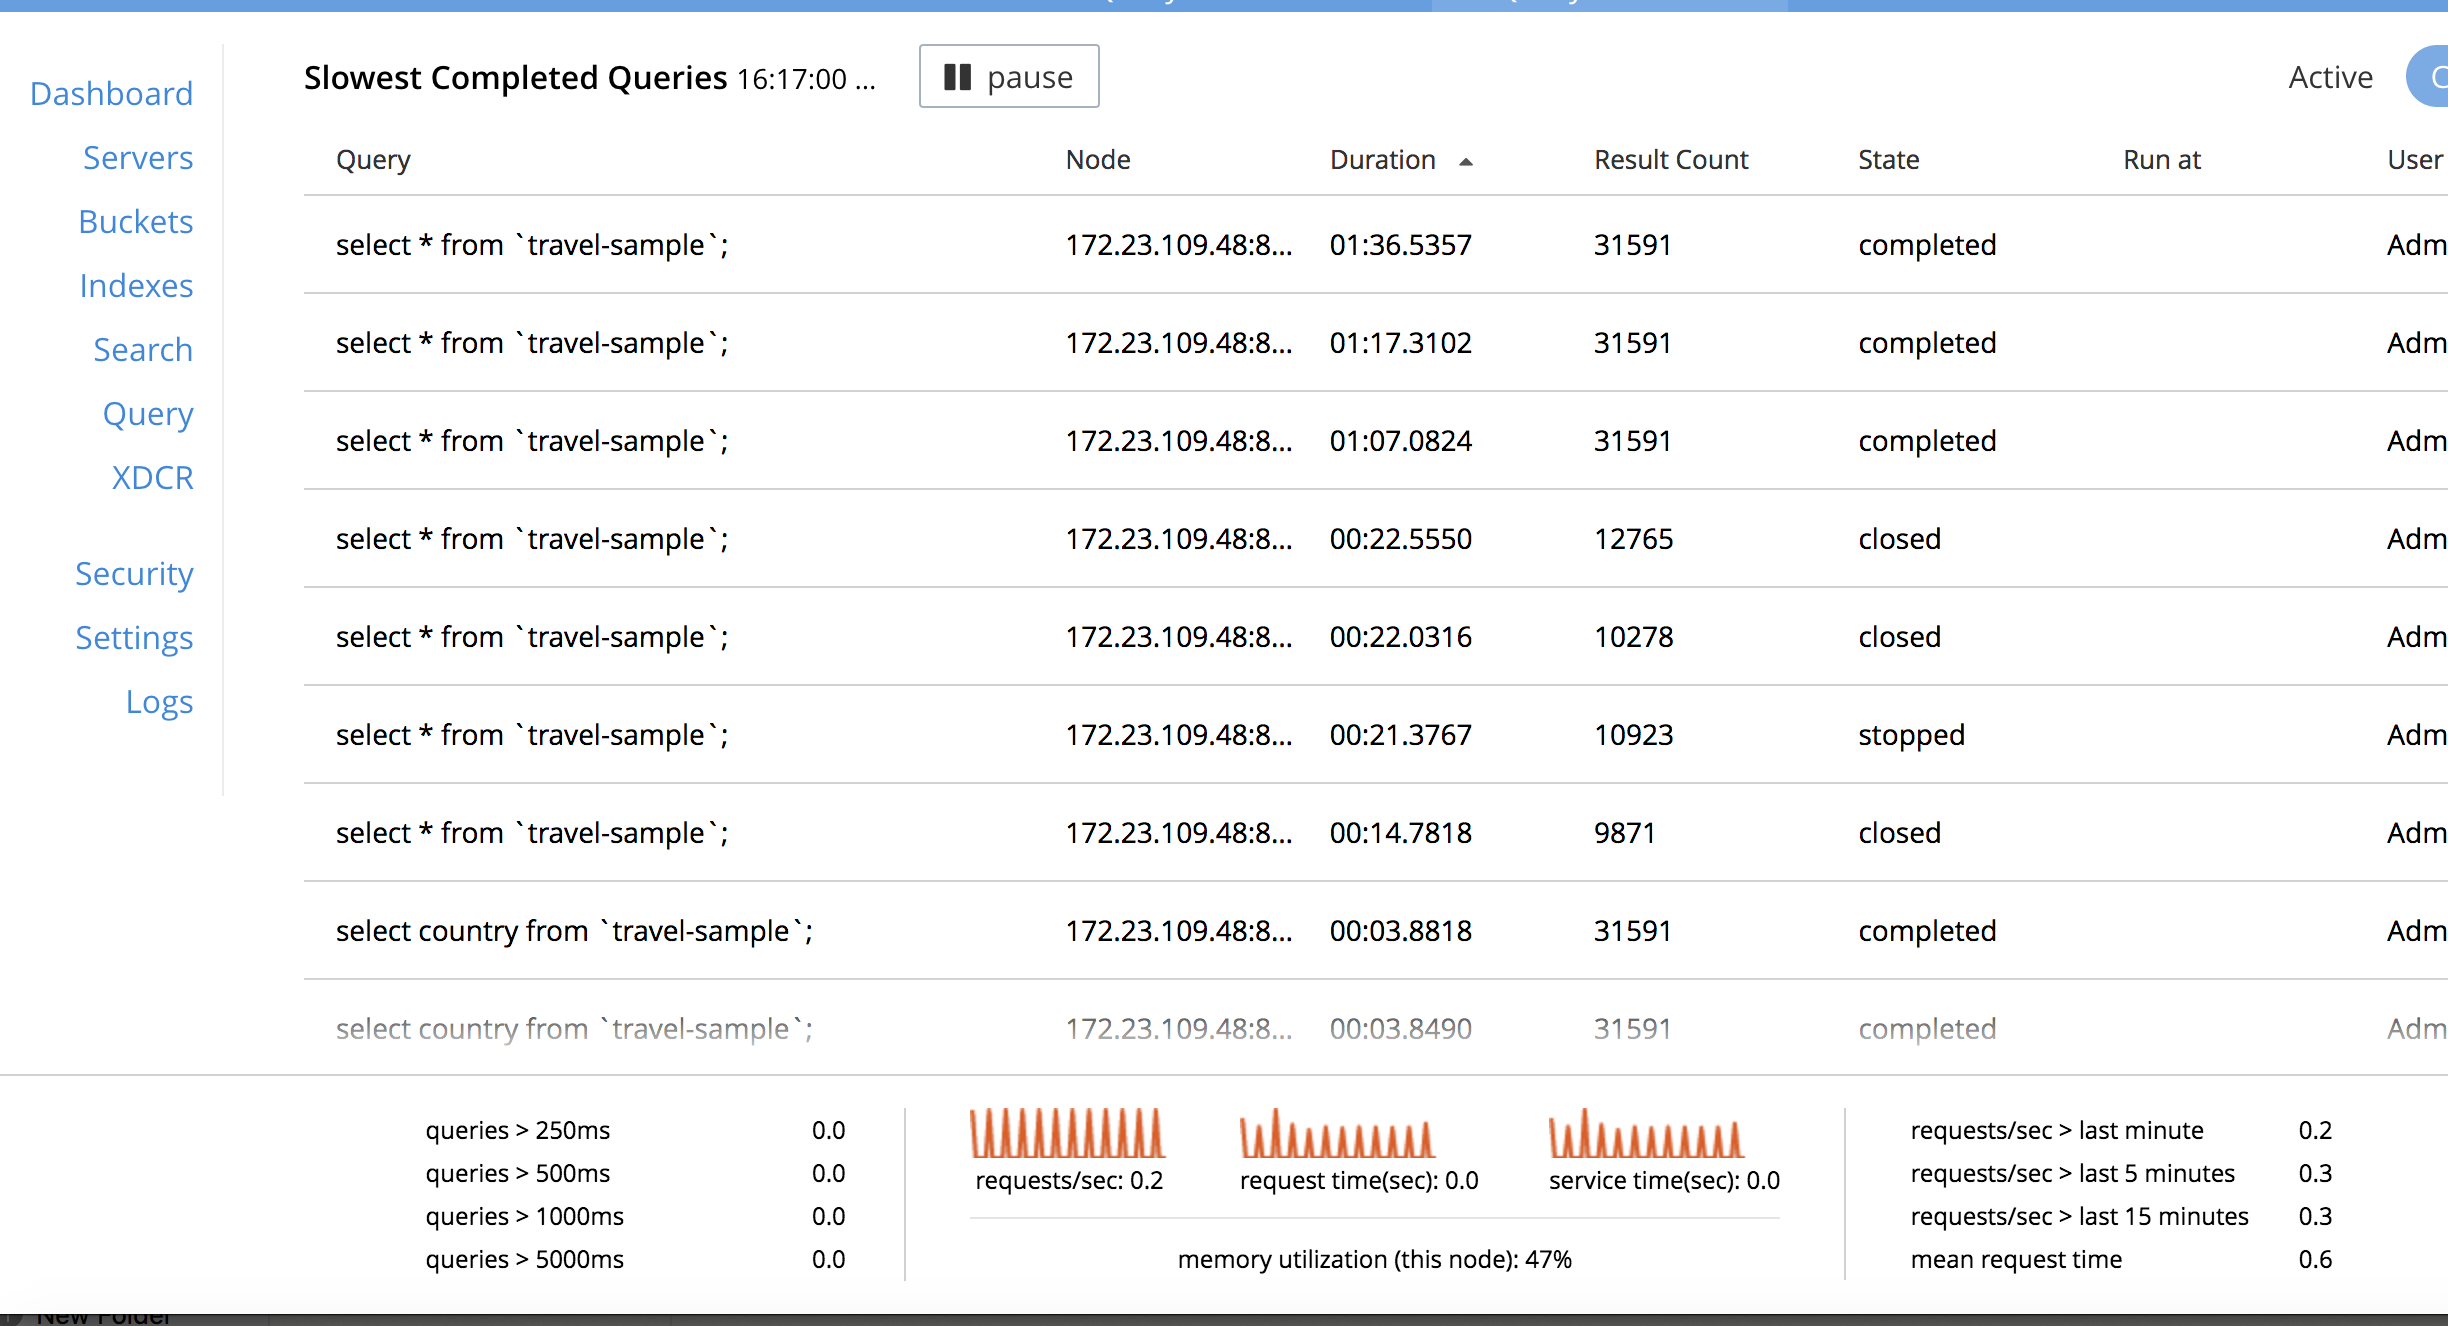
The aggregate stats for Query execution timings in the bottom panel of the Query monitoring screen is always zero. It should derive the numbers from the execution times of the completed and active queries.
Attachments
| For Gerrit Dashboard: MB-24134 | ||||||
|---|---|---|---|---|---|---|
| # | Subject | Branch | Project | Status | CR | V |
| 77505,2 | MB-24134 - The numbers shown for aggregate stats were the last number from the array of values coming back from the service. Since this number is noisy, it was often but not always zero. Instead of showing the most recent value, now average over the numbers for the past minute. | master | query-ui | Status: MERGED | +2 | +1 |