Details
-
Improvement
-
Resolution: Unresolved
-
 Major
Major
-
5.5.0
-
None
Description
Running through a cbimport in order to check out a dataset (Green Taxi Data, 16.4M records) the import is moving at about 4k ops/s.
/opt/couchbase/bin/cbimport csv --cluster couchbase://localhost -u Administrator -p letmein -b taxis -t 16 --infer-types -omit-empty -d file:///root/2016_Green_Taxi_Trip_Data.csv -l /root/import.log -g green::%vendorID%::#MONO_INCR#
|
At the rate we're operating, the import will be 70-90 minutes. I raised parallelism to 16, and the CPU is saturated, appears to be in the memcached process. Might be compression related, as I took the defaults which got me "passive".
A view of the CPU from the 'hypervisor'…
39064 996 1808M 1655M run 1 0 1:44:59 47% memcached/31
|
39554 996 1875M 1721M cpu5 1 0 2:43:40 27% memcached/31
|
47429 root 267M 237M run 1 0 1:00:36 8.4% cbimport/17
|
38701 996 568M 537M run 7 0 0:34:59 6.2% beam.smp/29
|
42674 996 522M 491M run 1 0 0:25:48 5.7% beam.smp/29
|
A later run…
$ time /Applications/Couchbase\ Serv
|
er.app/Contents/Resources/couchbase-core/bin/cbimport csv --cluster couchbase:/
|
/centos7lx-55a -u Administrator -p letmein -b taxis -t 6 --infer-types -omit-em
|
pty -d file:///$PWD/2016_Green_Taxi_Trip_Data.csv -l import.log -g green::%vend
|
orID%::#MONO_INCR#
|
CSV `file:////Users/ingenthr/opt/gocode/src/github.com/chvck/gocb-taxi-analytics/2016_Green_Taxi_Trip_Data.csv` imported to `http://centos7lx-55a:8091` successfully, 16288868 documents loaded
|
|
|
real 31m47.965s
|
user 26m14.700s
|
sys 5m20.170s
|
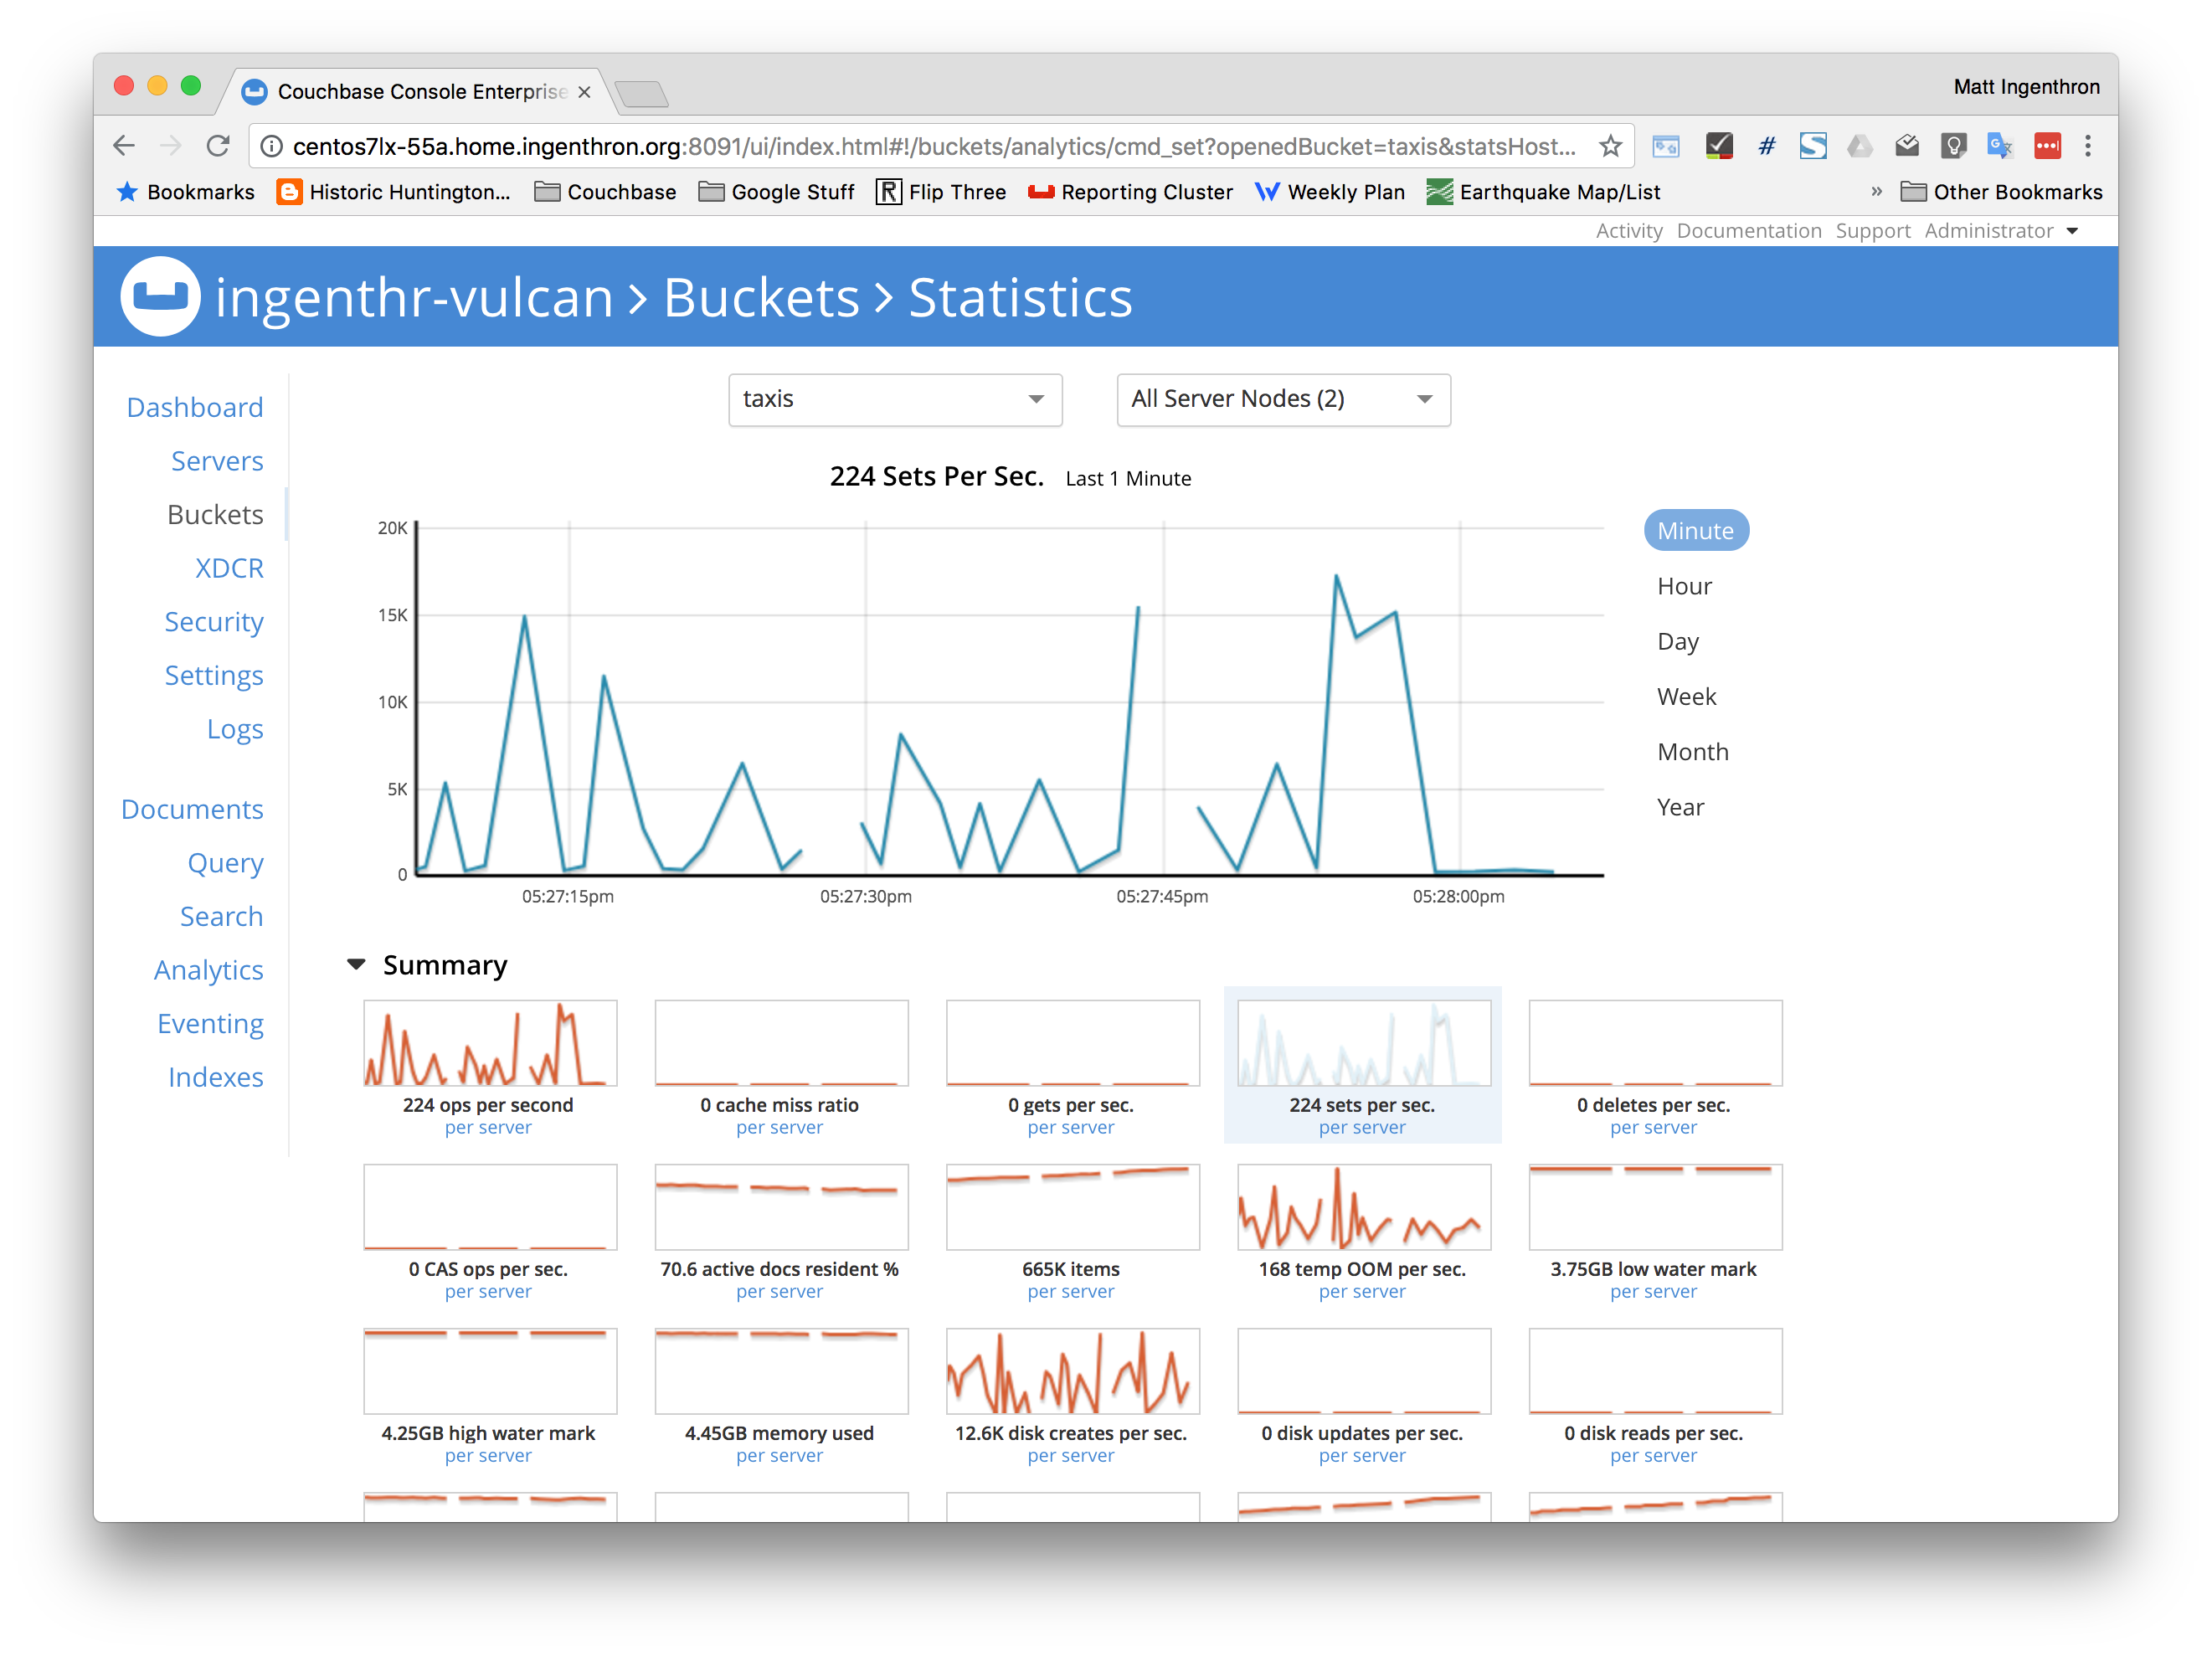
Seemed to be IO bound right after memory was consumed and TMPFAILs started being returned.
Interestingly the raw CSV is rather small.
$ ls -lh 2016_Green_Taxi_Trip_Data.c
|
sv
|
-rw-r--r-- 1 ingenthr staff 2.1G Aug 2 10:04 2016_Green_Taxi_Trip_Data.csv
|
And the bucket is 5GB.
After load though, the memory used is 1.85G. Curious.
Attachments

Issue Links
- mentioned in
-
Page Loading...