Details
-
Bug
-
Resolution: Fixed
-
 Major
Major
-
6.5.0
-
Enterprise Edition 6.5.0 build 4062
-
Untriaged
-
-
Unknown
Description
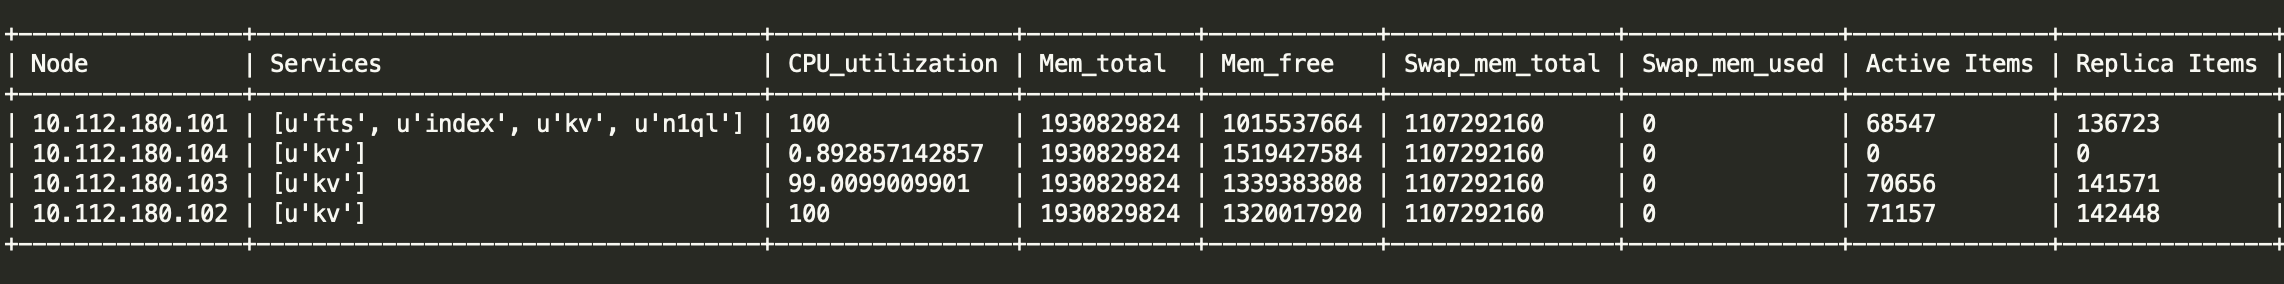
1. Initialize a 3 node cluster: [u'ns_1@10.112.180.101', u'ns_1@10.112.180.103', u'ns_1@10.112.180.102']
2. Create 2 buckets: bucket-0, bucket-1 with replica=2 for both.
3. Load 100k docs in each bucket with durability=Majority
4. Start loading another 100k docs in both the buckets. In parallel, do a swap rebalance:
Adding remote node 10.112.180.104
removing node 10.112.180.103
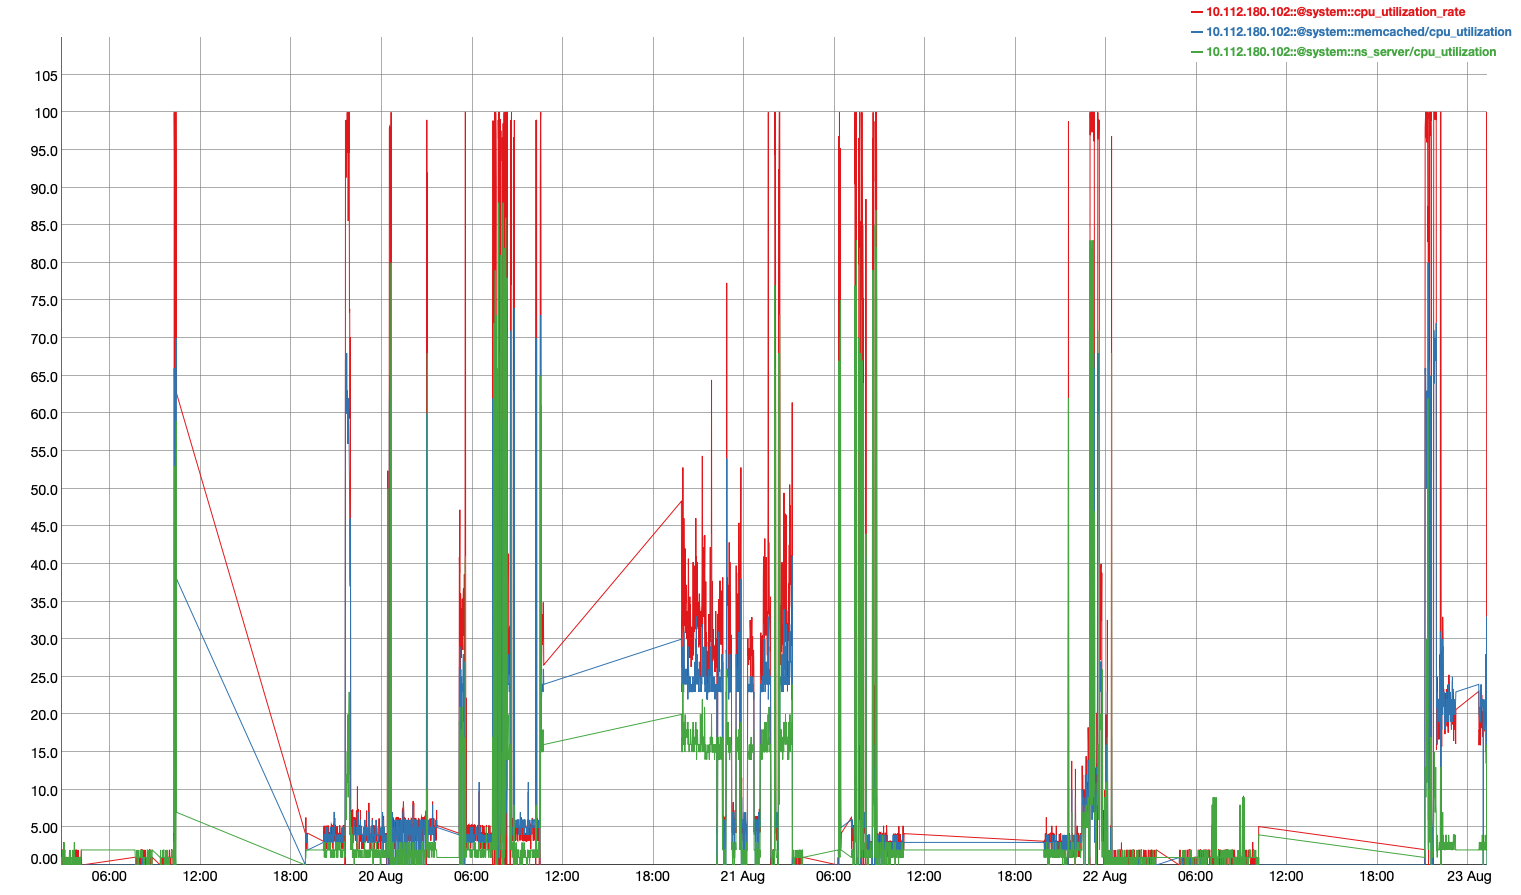
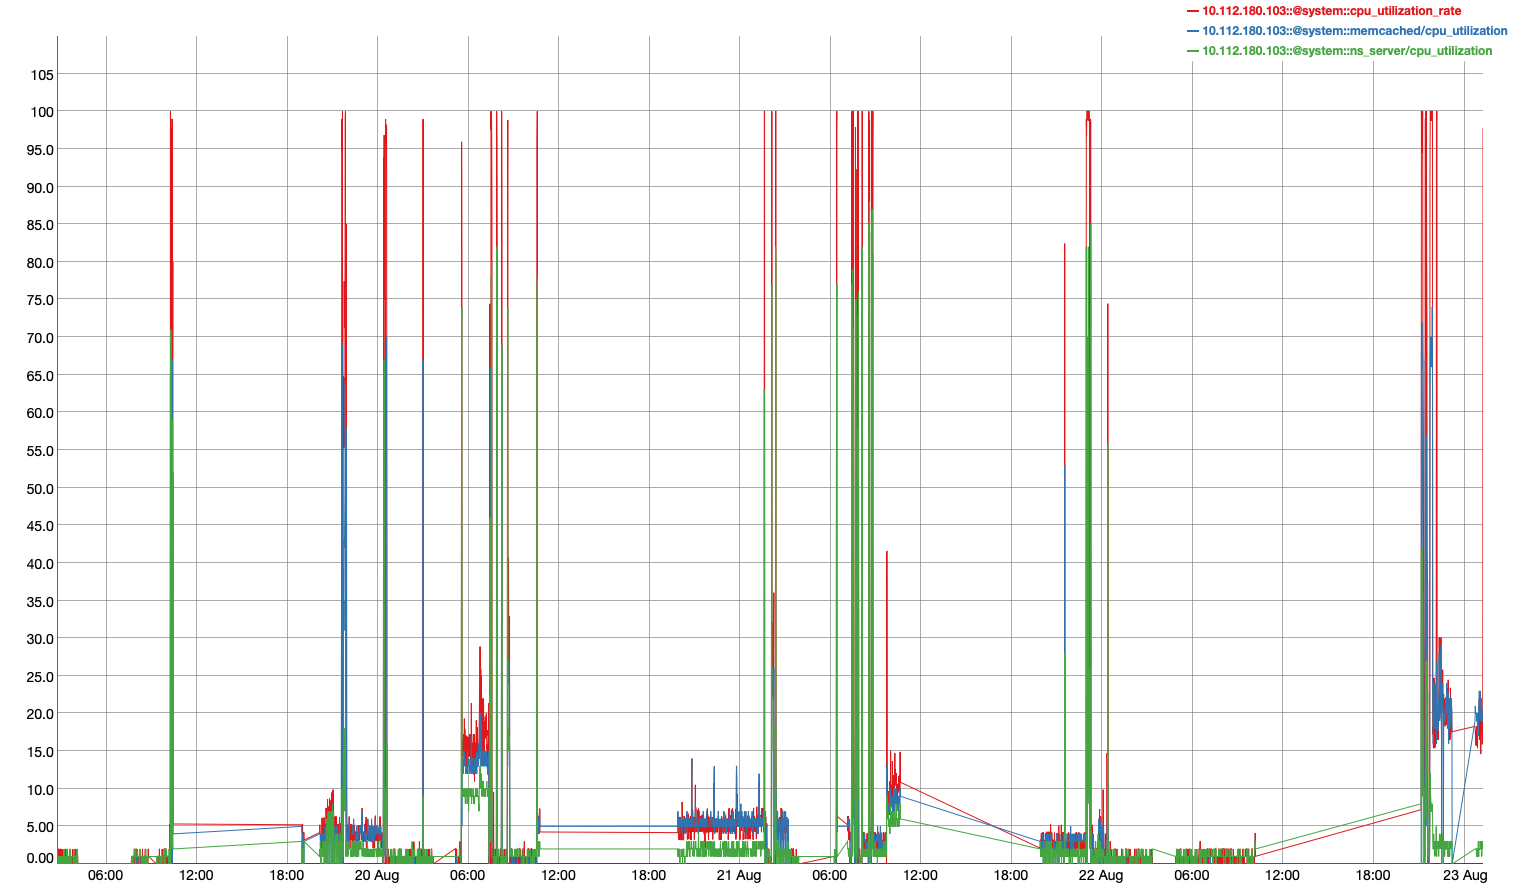
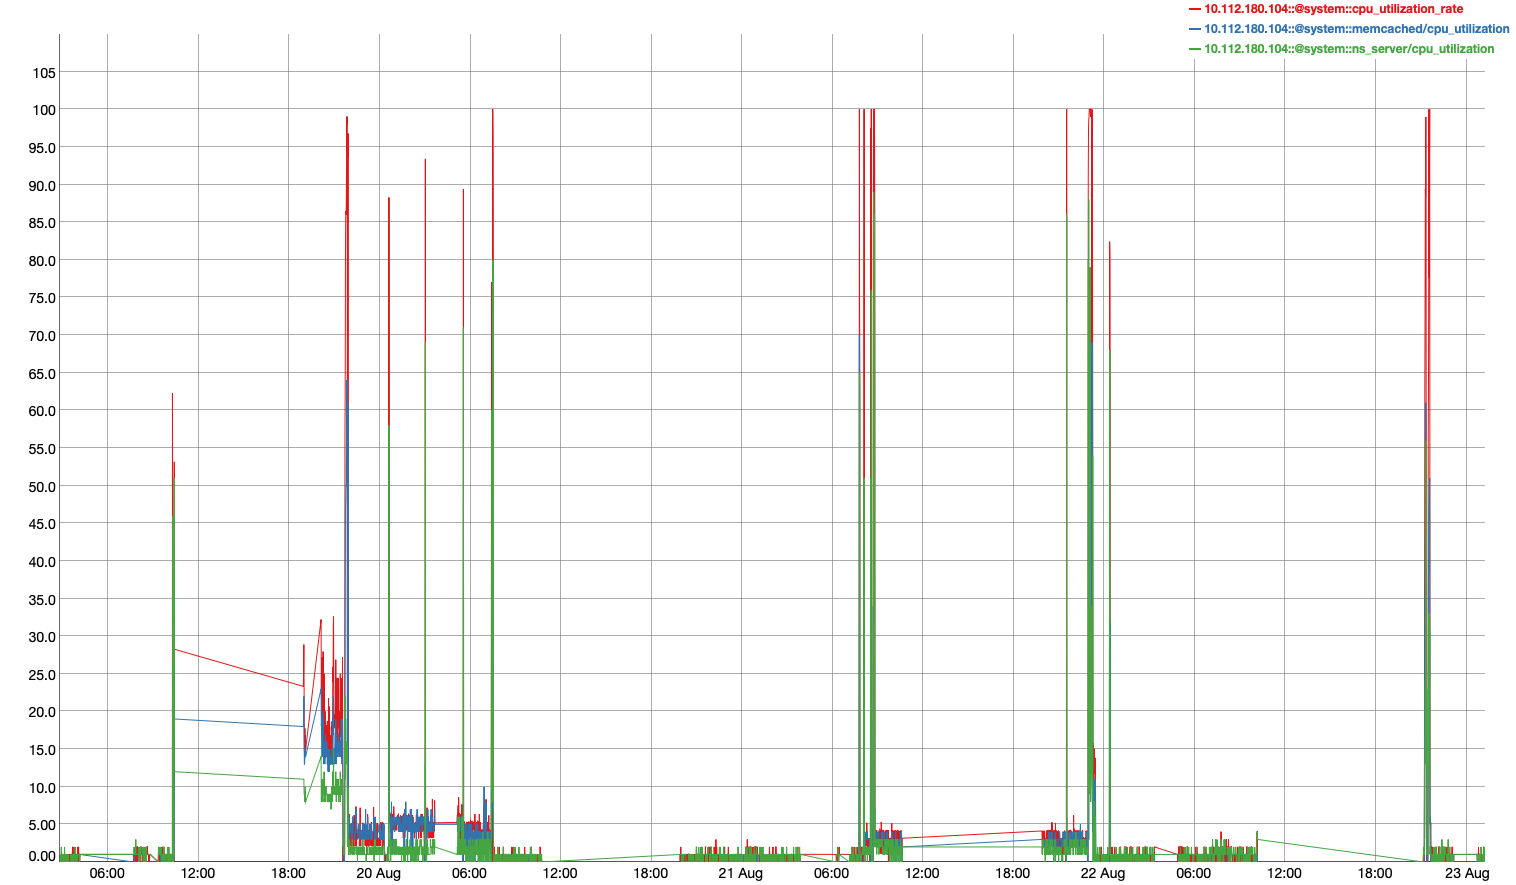
Rebalance failed immediately. CPU usage in 100% at step 4: