Details
-
Bug
-
Resolution: Fixed
-
 Critical
-
6.5.0
Description
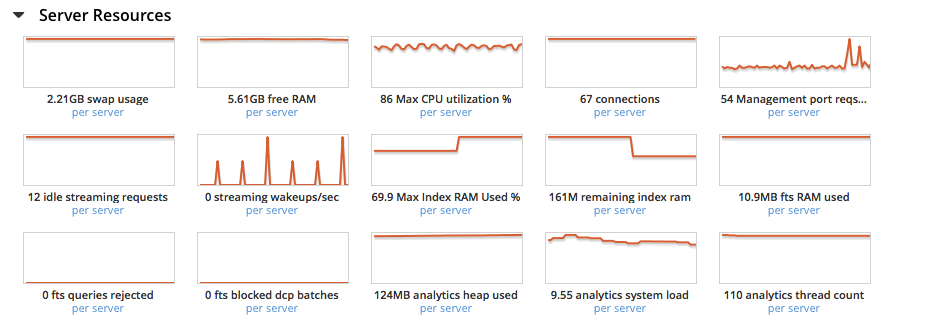
The existing server stats page, while venerable, has a number of serious deficiencies.
- a complete lack of X and Y axes, making it impossible to know the range of values or when something occurred.
- no tool tips to explain what a particular stat is or how it's measured
- no way to see the value at a specific point in time
- serious limitations in viewing larger version of the charts - the large version is only at the top of the page, so if you want to swap between several stats win the large version, you have to keep scrolling back and forth between the small charts and the large one.
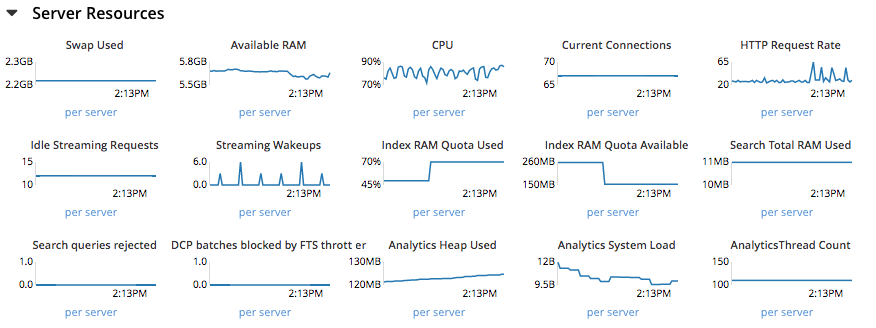
In Mad Hatter, we have created a new charting widget for the Dashboard. This chart widget scales down to the same size as the existing server stats charts, with many advantages:
- numbers on the X and Y axes
- the ability to click on the line at any point and see the value there
- standardized naming and tooltips for each of the statistics
- the ability to show a more detailed chart in place by clicking, no scrolling required.
The attached screenshots show an example of using the new chart directive in the statistics page.