Description
Description
Every time the UI's Handler Editor is invoked an additional status fetch started as follows
setTimeout(deployedAppsTicker, 2000);
|
And the prior repeating function(s) are all orphaned but still making HTTP requests. Although Javascript is single threaded (such the same function running N times merely queues up) this can sometimes lead to odd behavior in the UI and aborted/canceled HTTP requests. In addition is can create a lot of loading if a user session does a lot of edits.
To reproduce
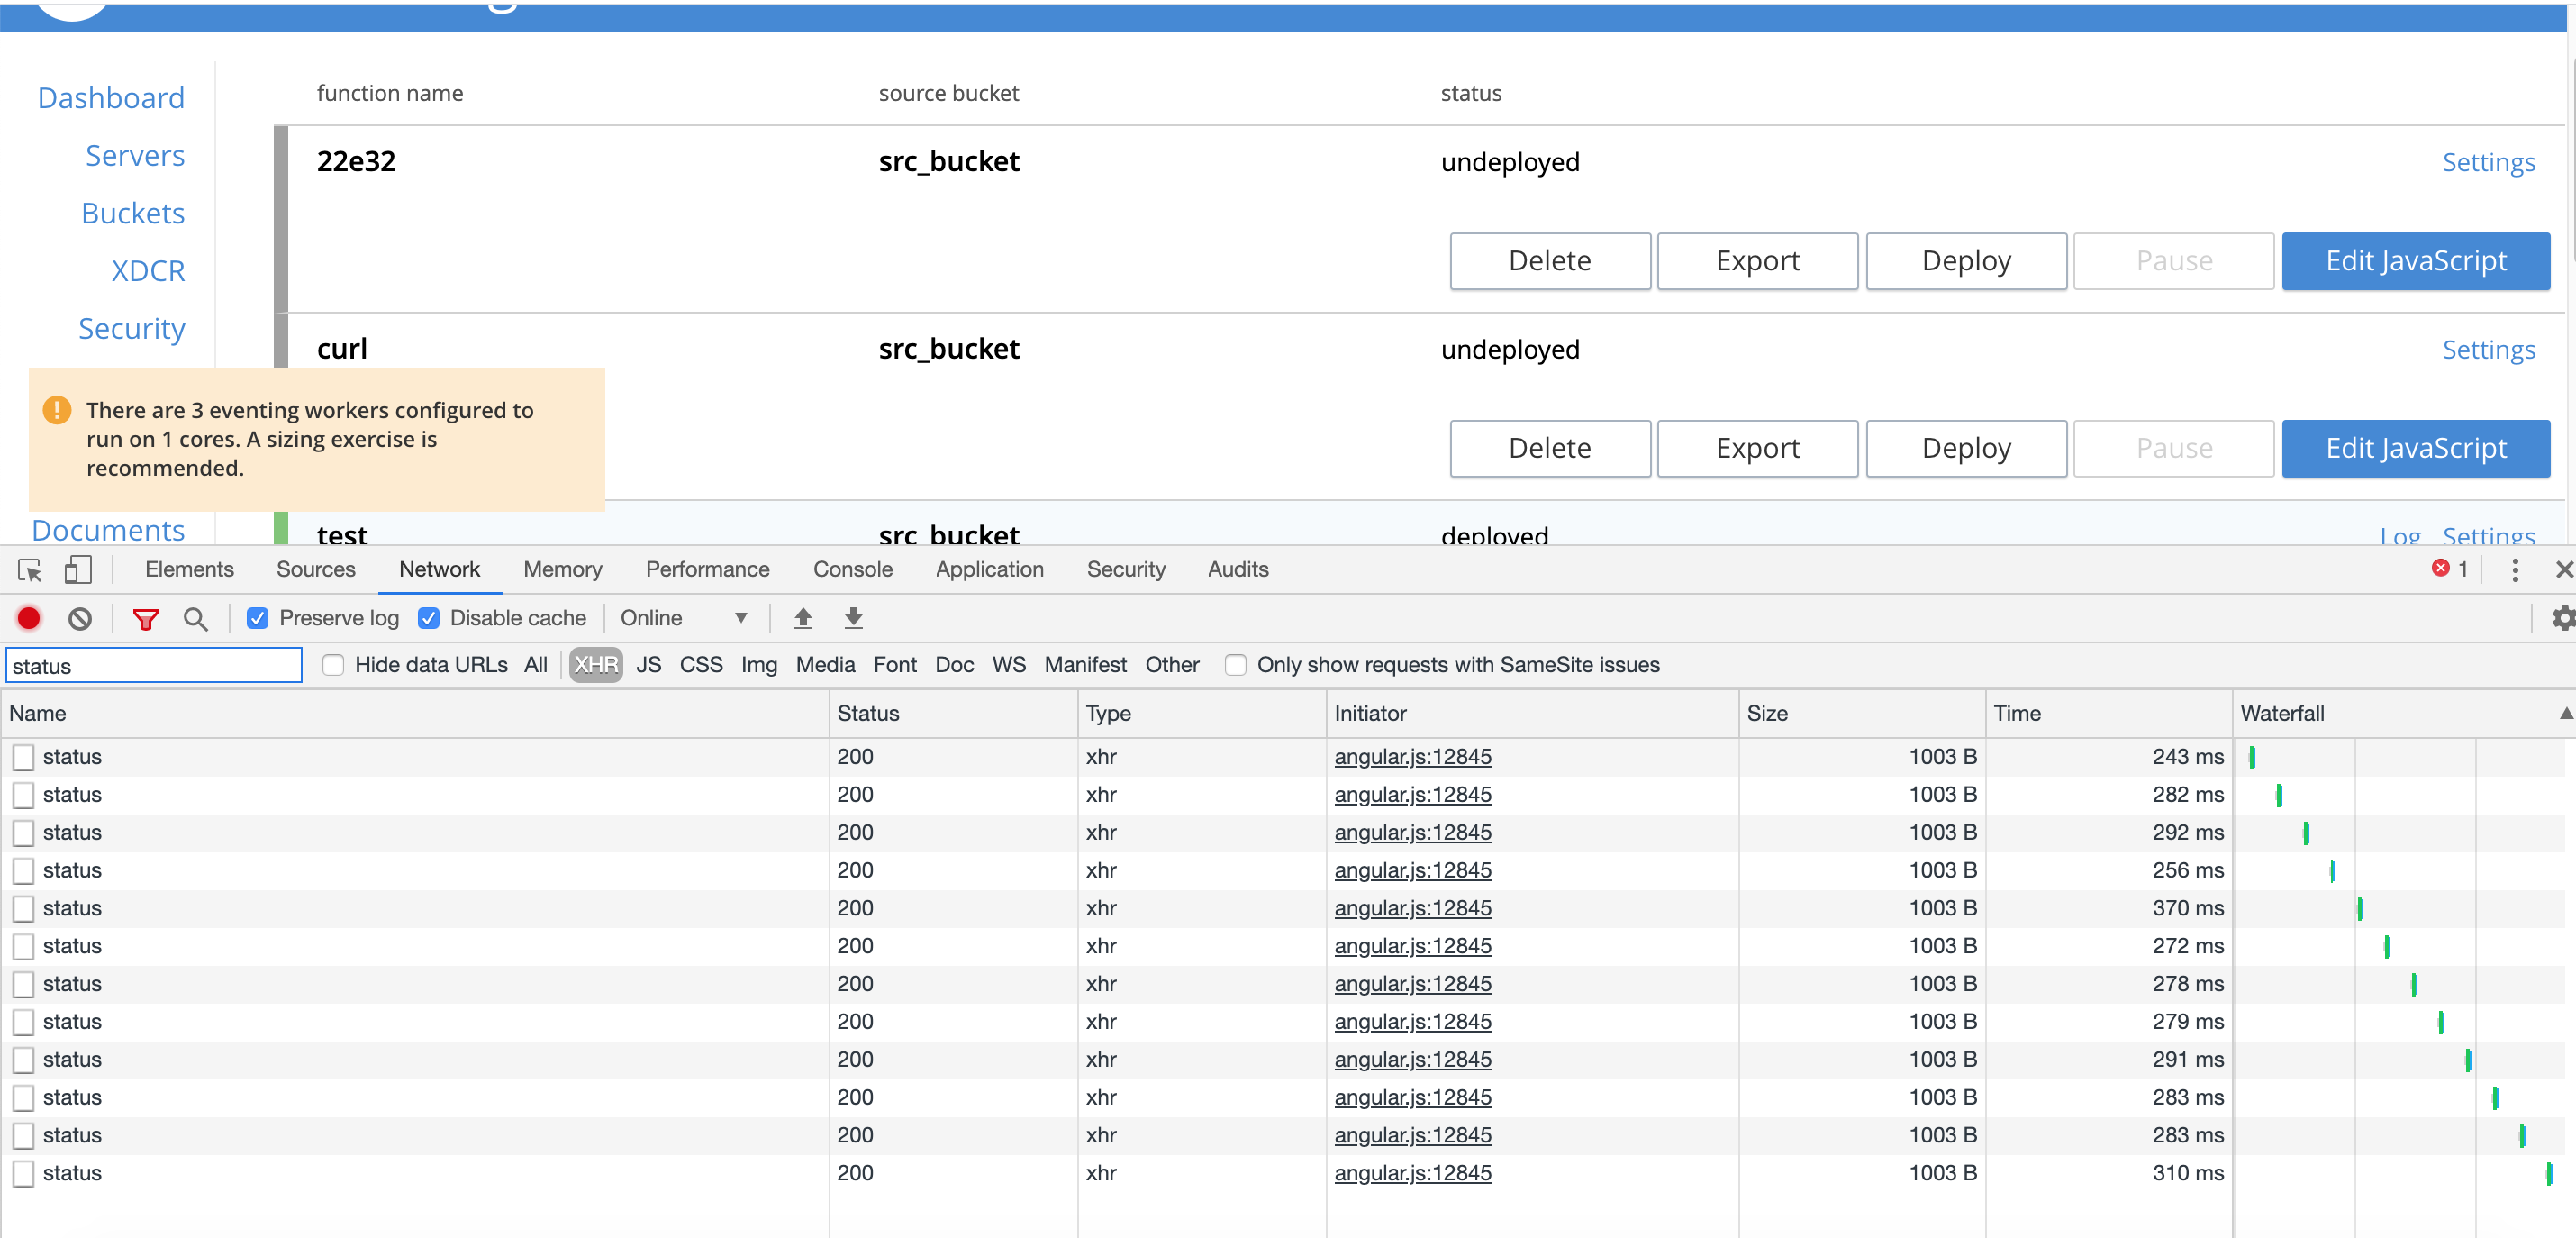
You can see this behavior in Chrome by going to Eventing in the UI starting the developer tools and then select network and sub-select XHR then filter on the word "status" you will see a recurring request every 2 seconds.
Next just invoke a Function editor on any undeployed or deployed function via the UI's "Edit Javascript" button.
Video of issue
https://couchbase.zoom.us/rec/share/xdVNcejrrnlLQo3T62_iW6whErzOaaa8gyYZ86INzkxHBKQRG7wHruzoLb5ZkB-B
Possible fix (works for me - but there may be a better fix)
Make a global for the window above "function getAppStatus() {"
window.g_tickerId = undefined;
|
Adjust the call to "setTimeout(deployedAppsTicker, 2000);" to set now set our new global.
g_tickerId = setTimeout(deployedAppsTicker, 2000);
|
Search for the "Controller for editing handler code." and add
// Stop recuring getAppStatus collection (and thus duplicate calls).
|
// avoids running multiple timers invoking getAppStatus // (relies on a global context, window.g_tickerId)
|
if (g_tickerId !== undefined) {
|
clearTimeout(g_tickerId);
|
g_tickerId = undefined;
|
}
|
Of course it would be a better fix not to somehow get a different "context" in the first place when we hit the "Edit Javascript" button.