Details
-
Bug
-
Resolution: User Error
-
 Critical
-
Cheshire-Cat
-
Enterprise Edition 7.0.0 build 3874 ‧ IPv4
-
1
-
Yes
Description
Description:
Creating a 1000 collections results in a large memory usage overhead which results in the memory usage exceeding the high water mark.
The primary consequence of this is that this results in TEMP_OOM errors immediately after collection creation for a short period of time (perhaps a few minutes) when a user attempts to insert data (e.g. via a SDK or a tool) into memcached.
An example of using the cbworkloadgen tool to insert a single document into one of the collections demonstrates this.
[root@node1-cheshire-cat-testing-centos7 ~]# /opt/couchbase/bin/cbworkloadgen -n 10.112.210.101:8091 -r 1 -i 1 -b default -s 3 -j -c 8 -u Administrator -p password
|
2020-12-04 17:28:48,003: s0 backing off, secs: 0.1
|
2020-12-04 17:28:48,125: s0 backing off, secs: 0.1
|
2020-12-04 17:28:48,238: s0 backing off, secs: 0.1
|
2020-12-04 17:28:48,351: s0 backing off, secs: 0.1
|
2020-12-04 17:28:48,469: s0 backing off, secs: 0.1
|
2020-12-04 17:28:48,589: s0 backing off, secs: 0.1
|
... (Repeats for a while until the tools succeeds)
|
2020-12-04 17:34:48,299: s0 backing off, secs: 0.1
|
2020-12-04 17:34:48,411: s0 backing off, secs: 0.1
|
2020-12-04 17:34:48,523: s0 backing off, secs: 0.1
|
2020-12-04 17:34:48,653: s0 backing off, secs: 0.1
|
2020-12-04 17:34:48,777: s0 backing off, secs: 0.1
|
################### 100.0% (1/estimated 1 msgs)
|
bucket: default, msgs transferred...
|
: total | last | per sec
|
byte : 55 | 55 | 0.2
|
retry_batch : 2836 | 2836 | 7.9
|
done
|
In this case in a 3 node cluster each running on a virtual machine with a single core took roughly 6 minutes to exit the state in which data could be inserted into the bucket.
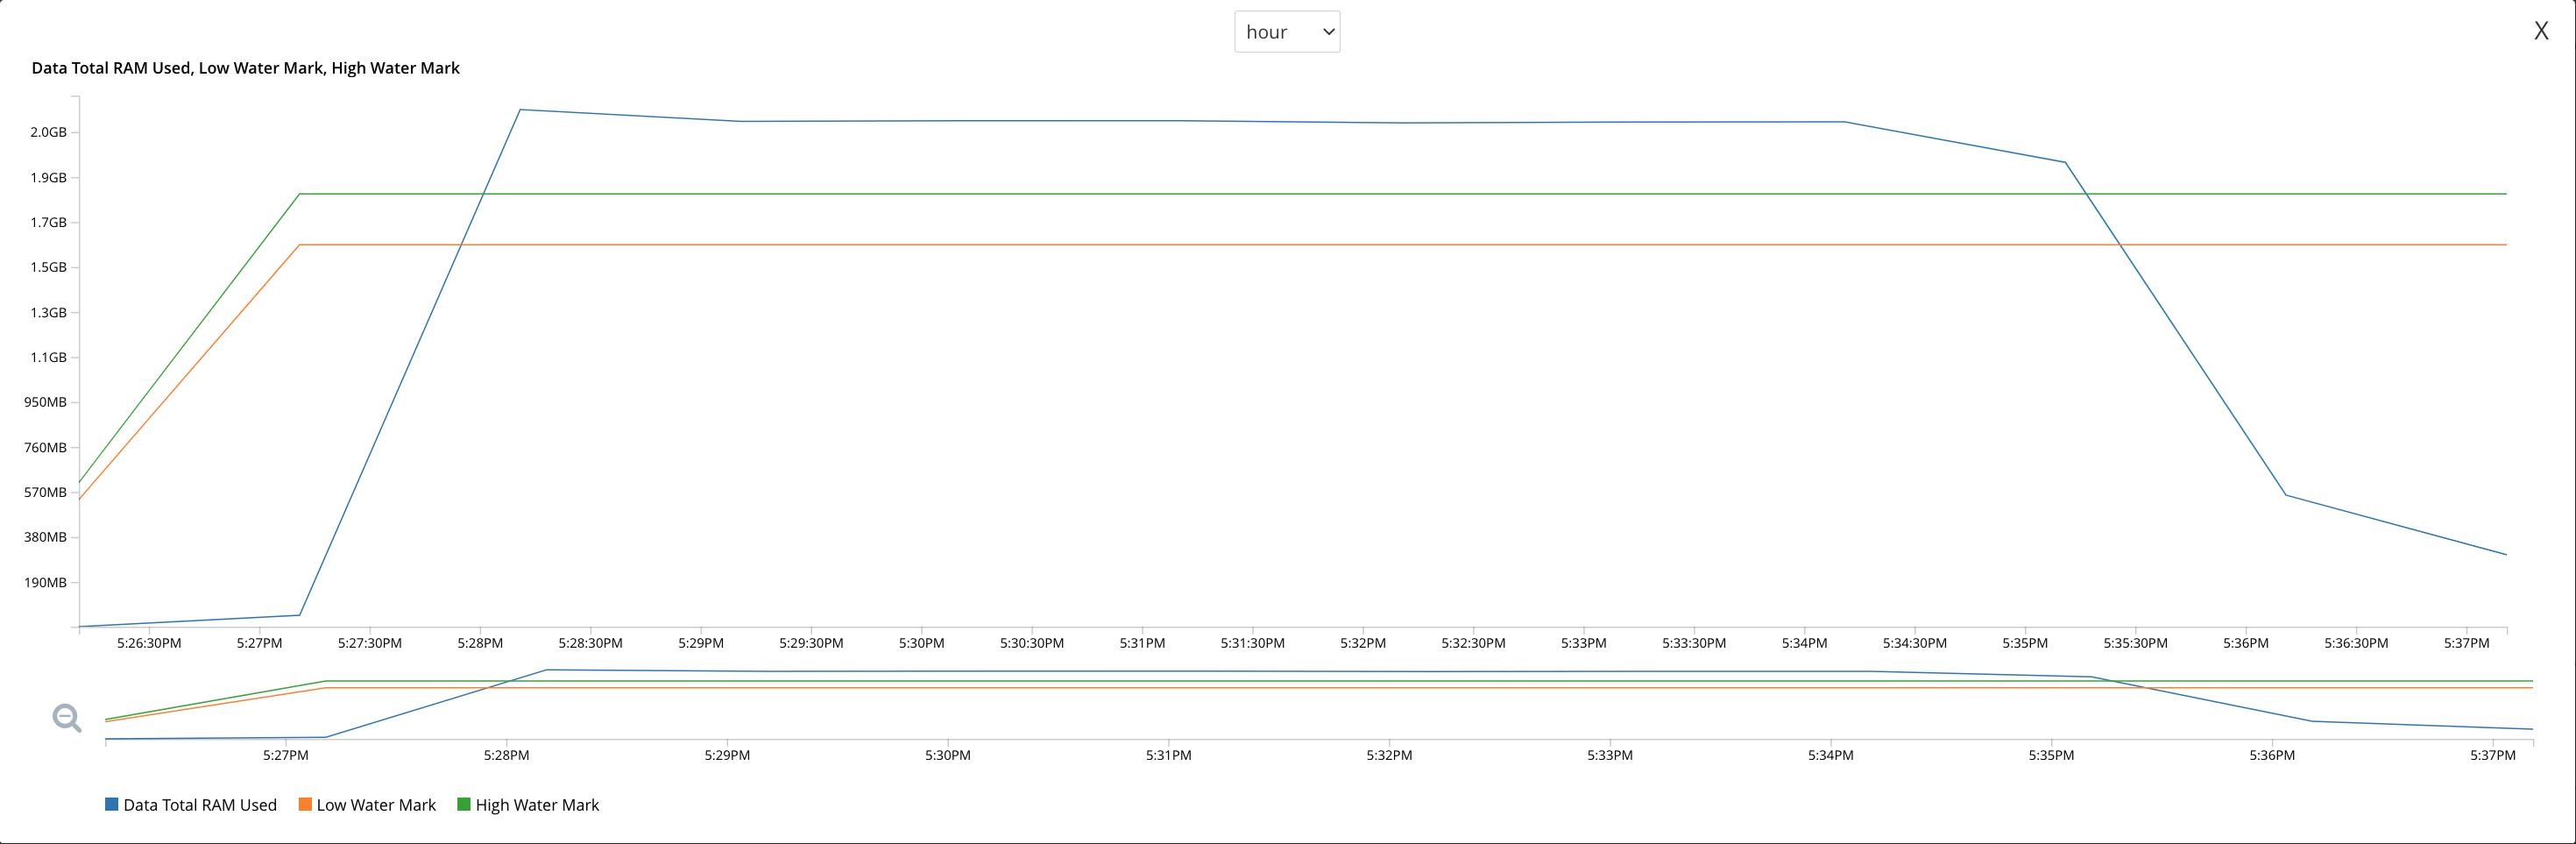
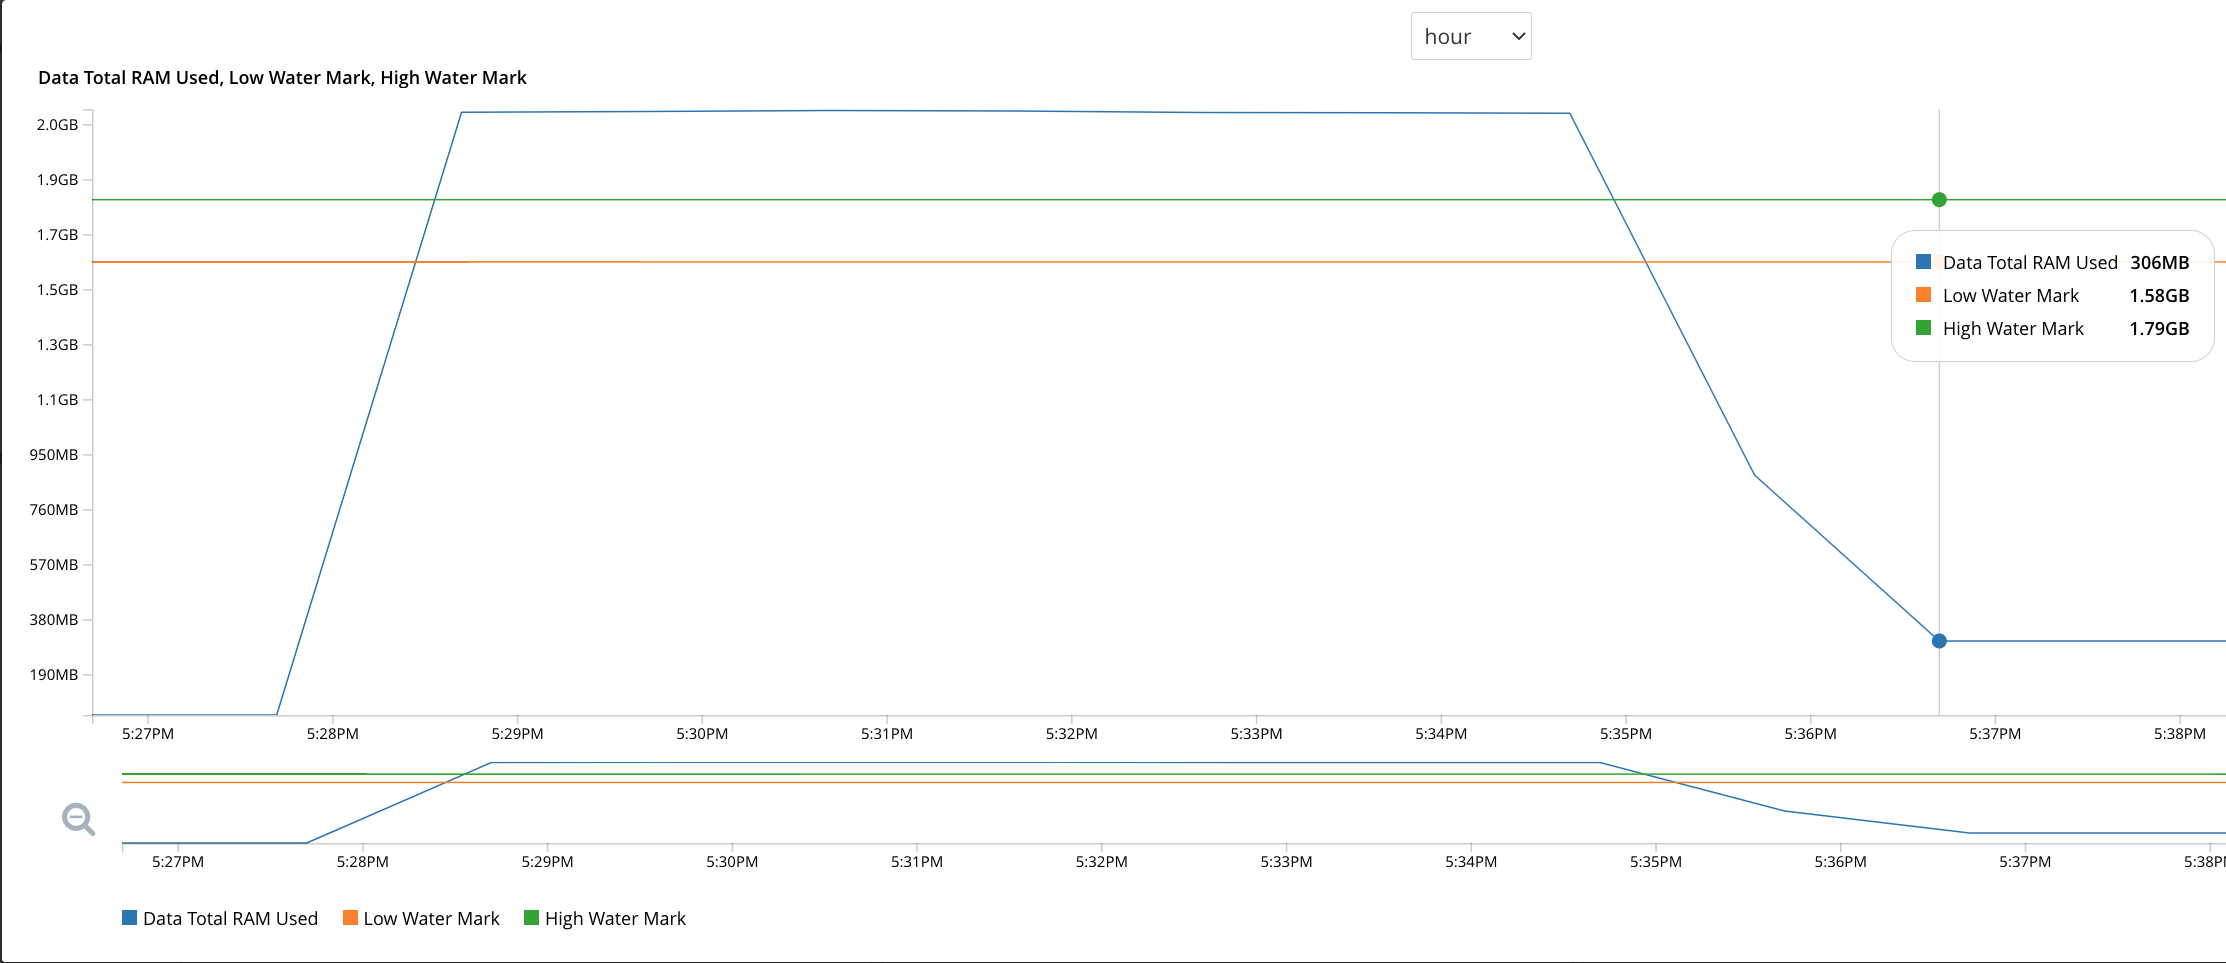
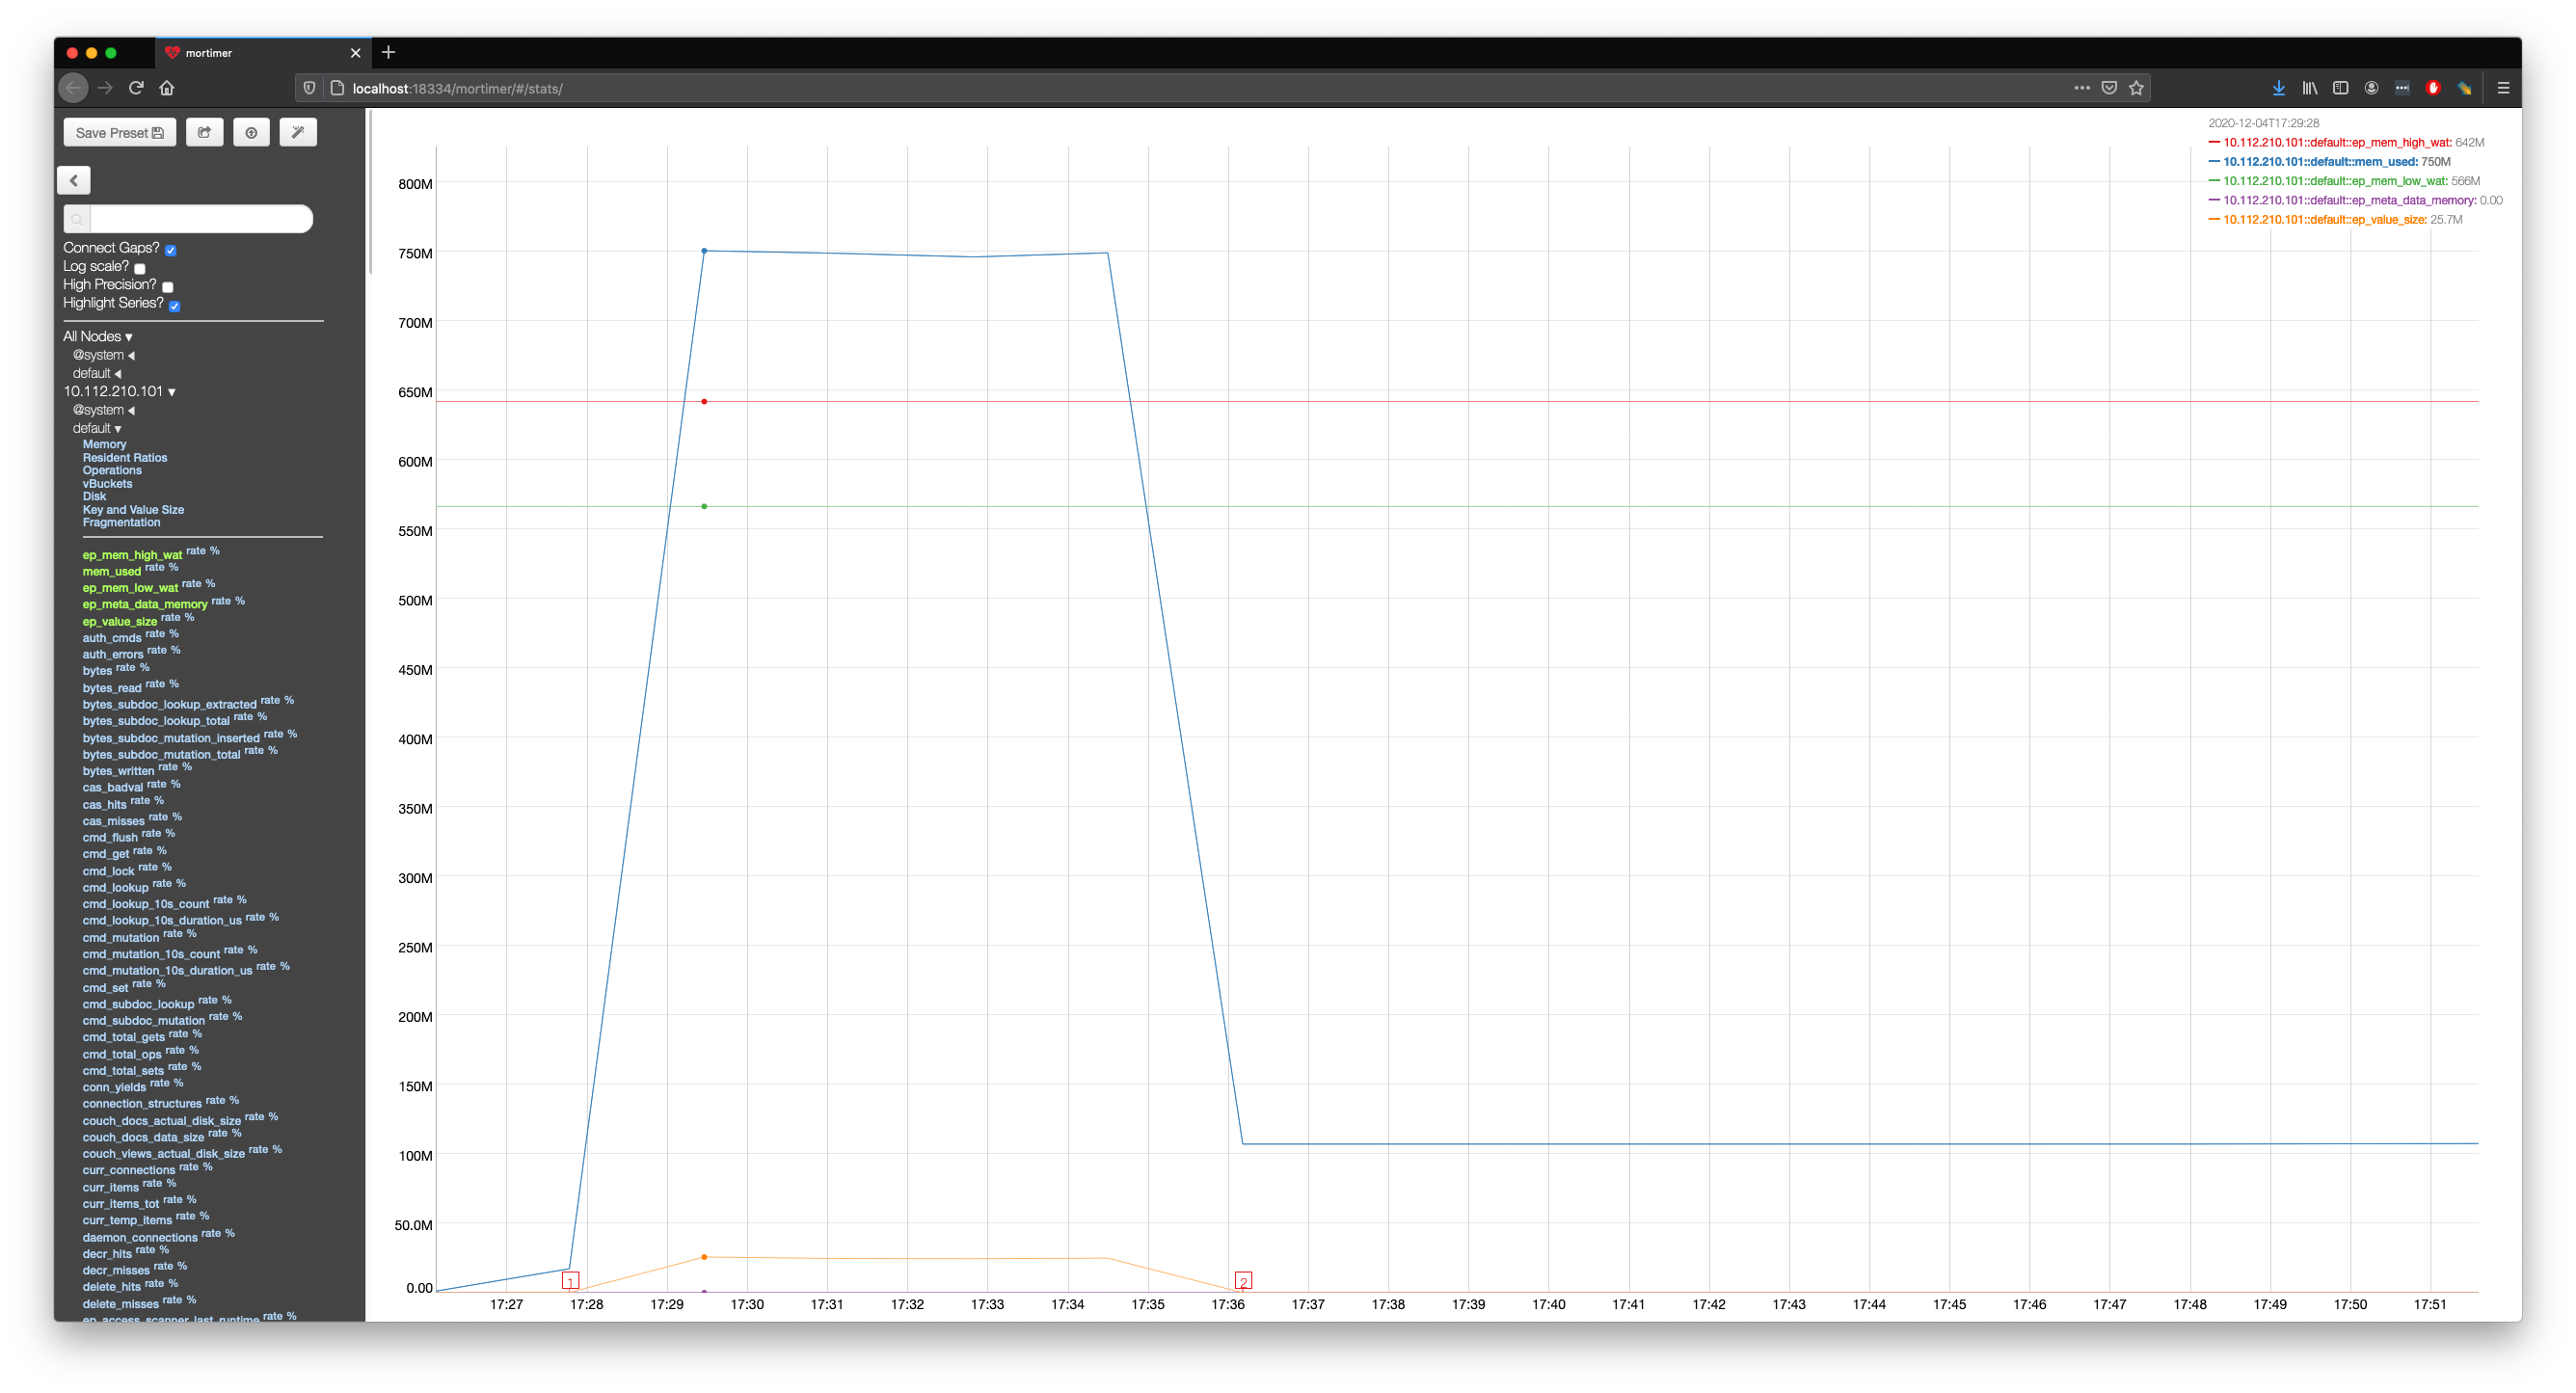
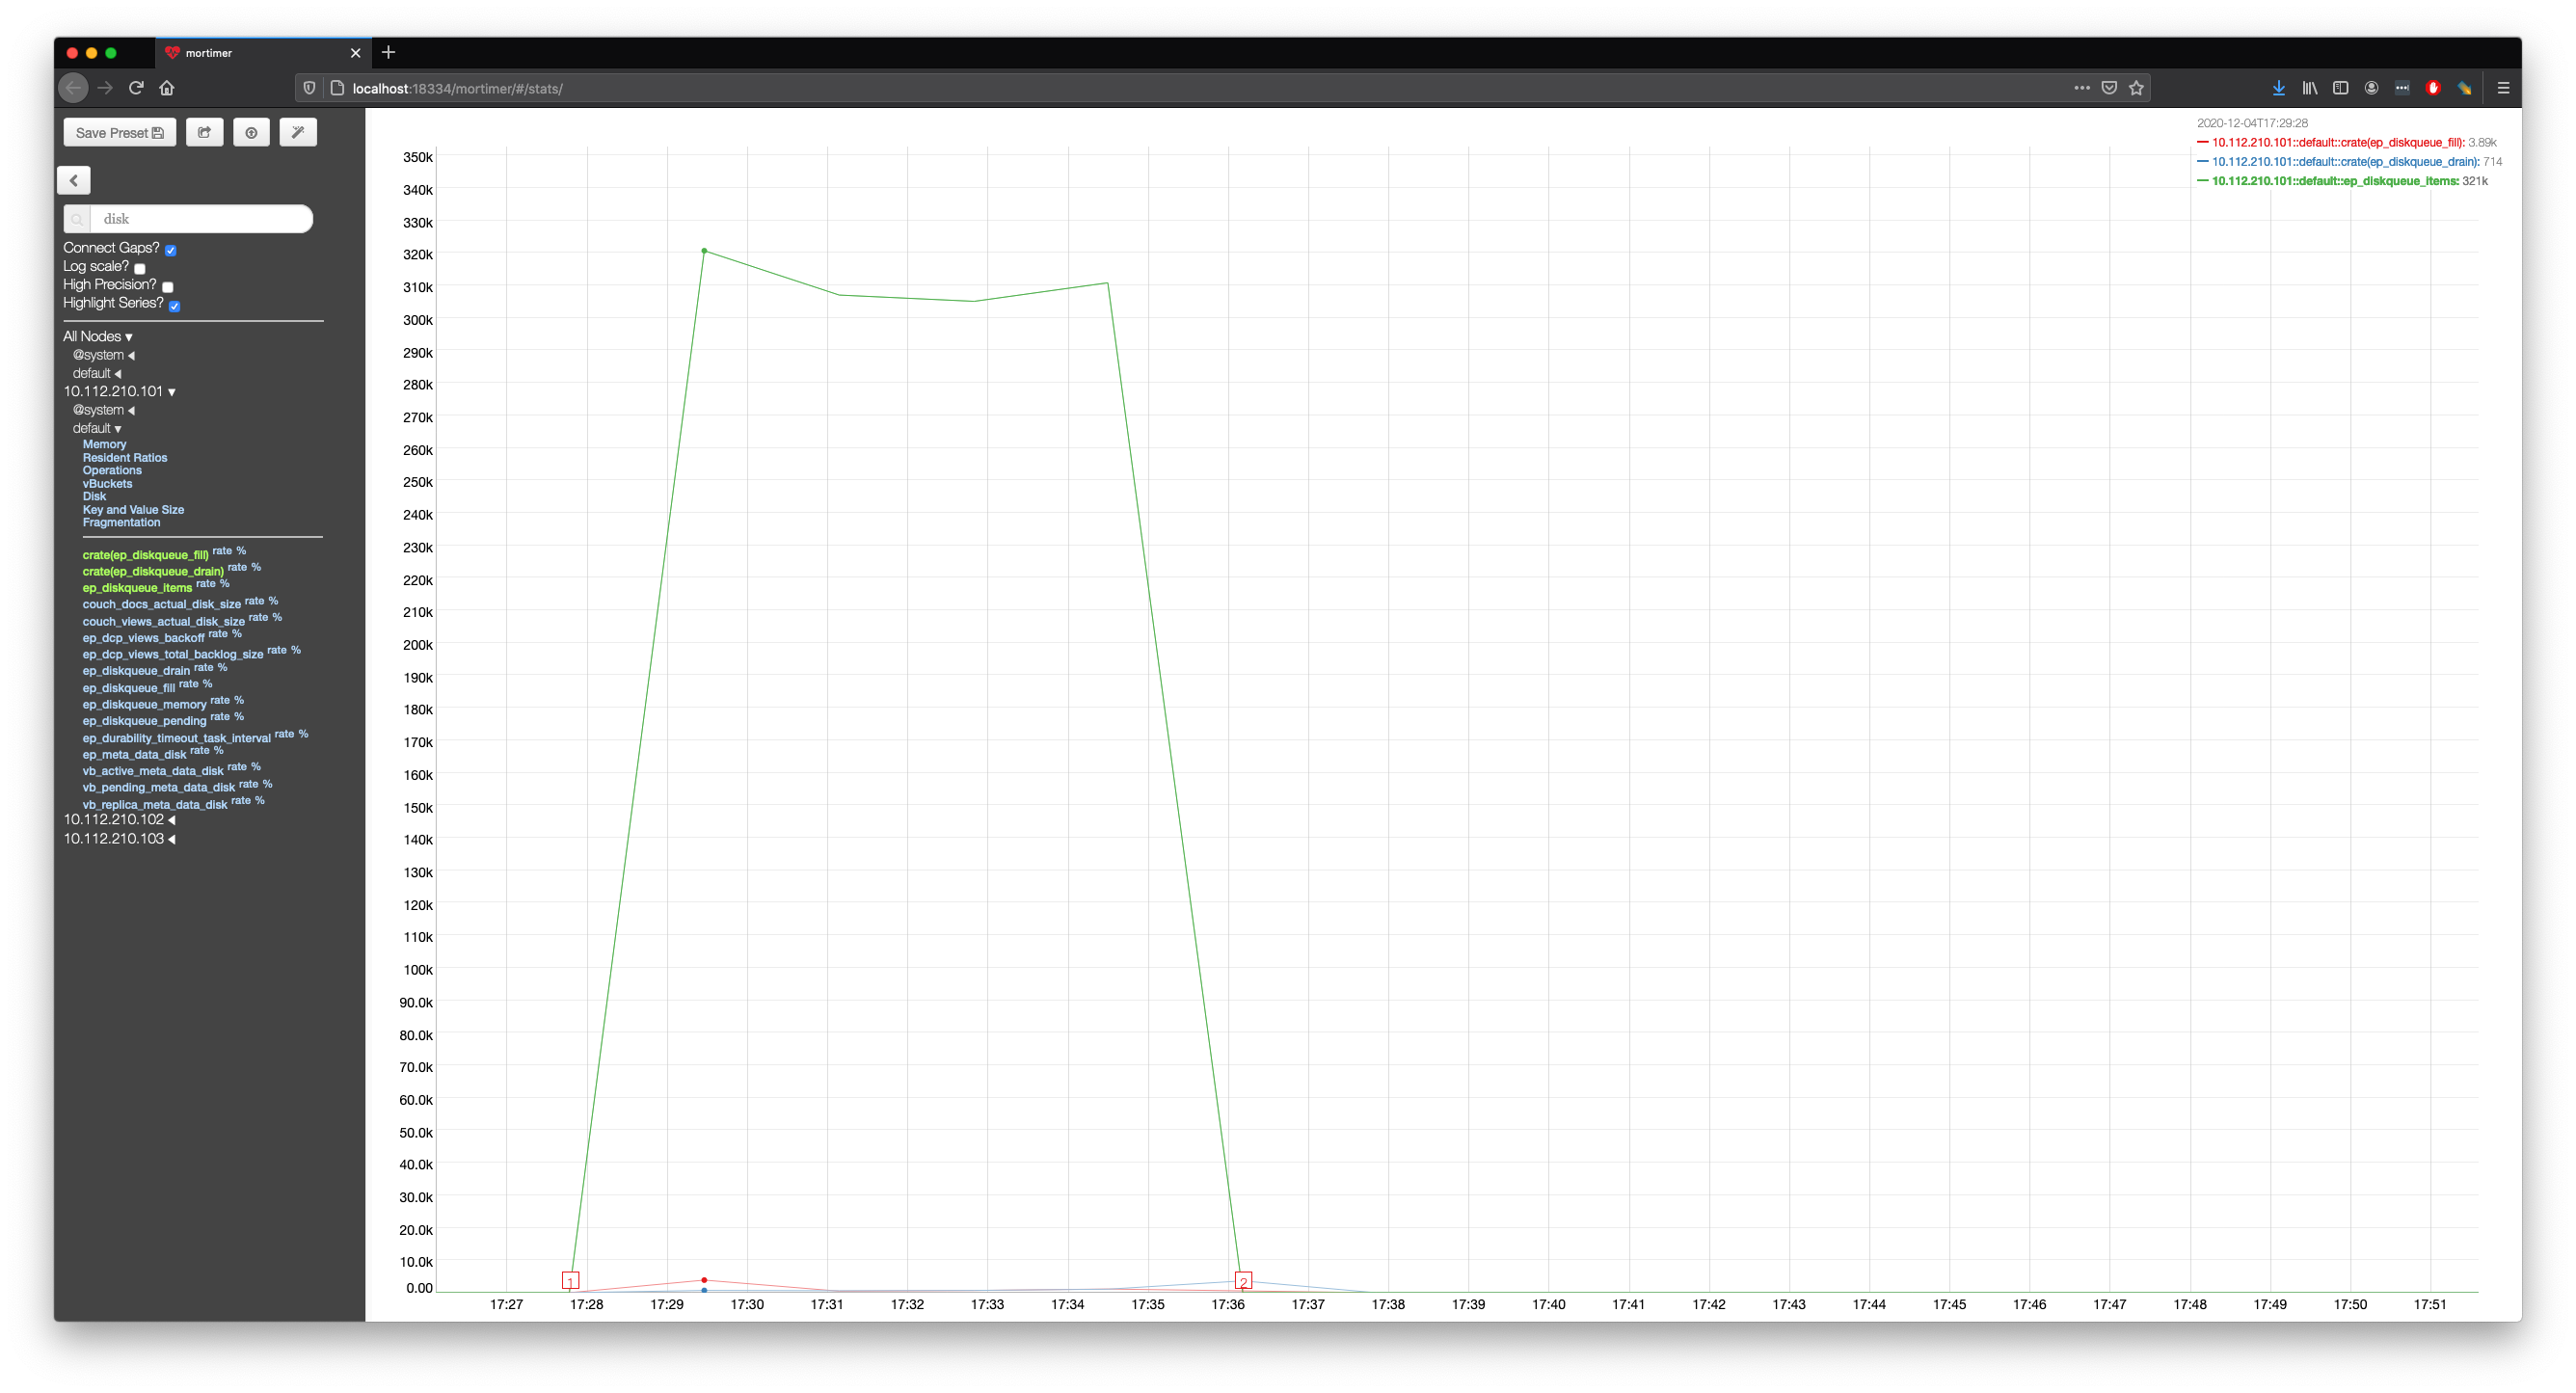
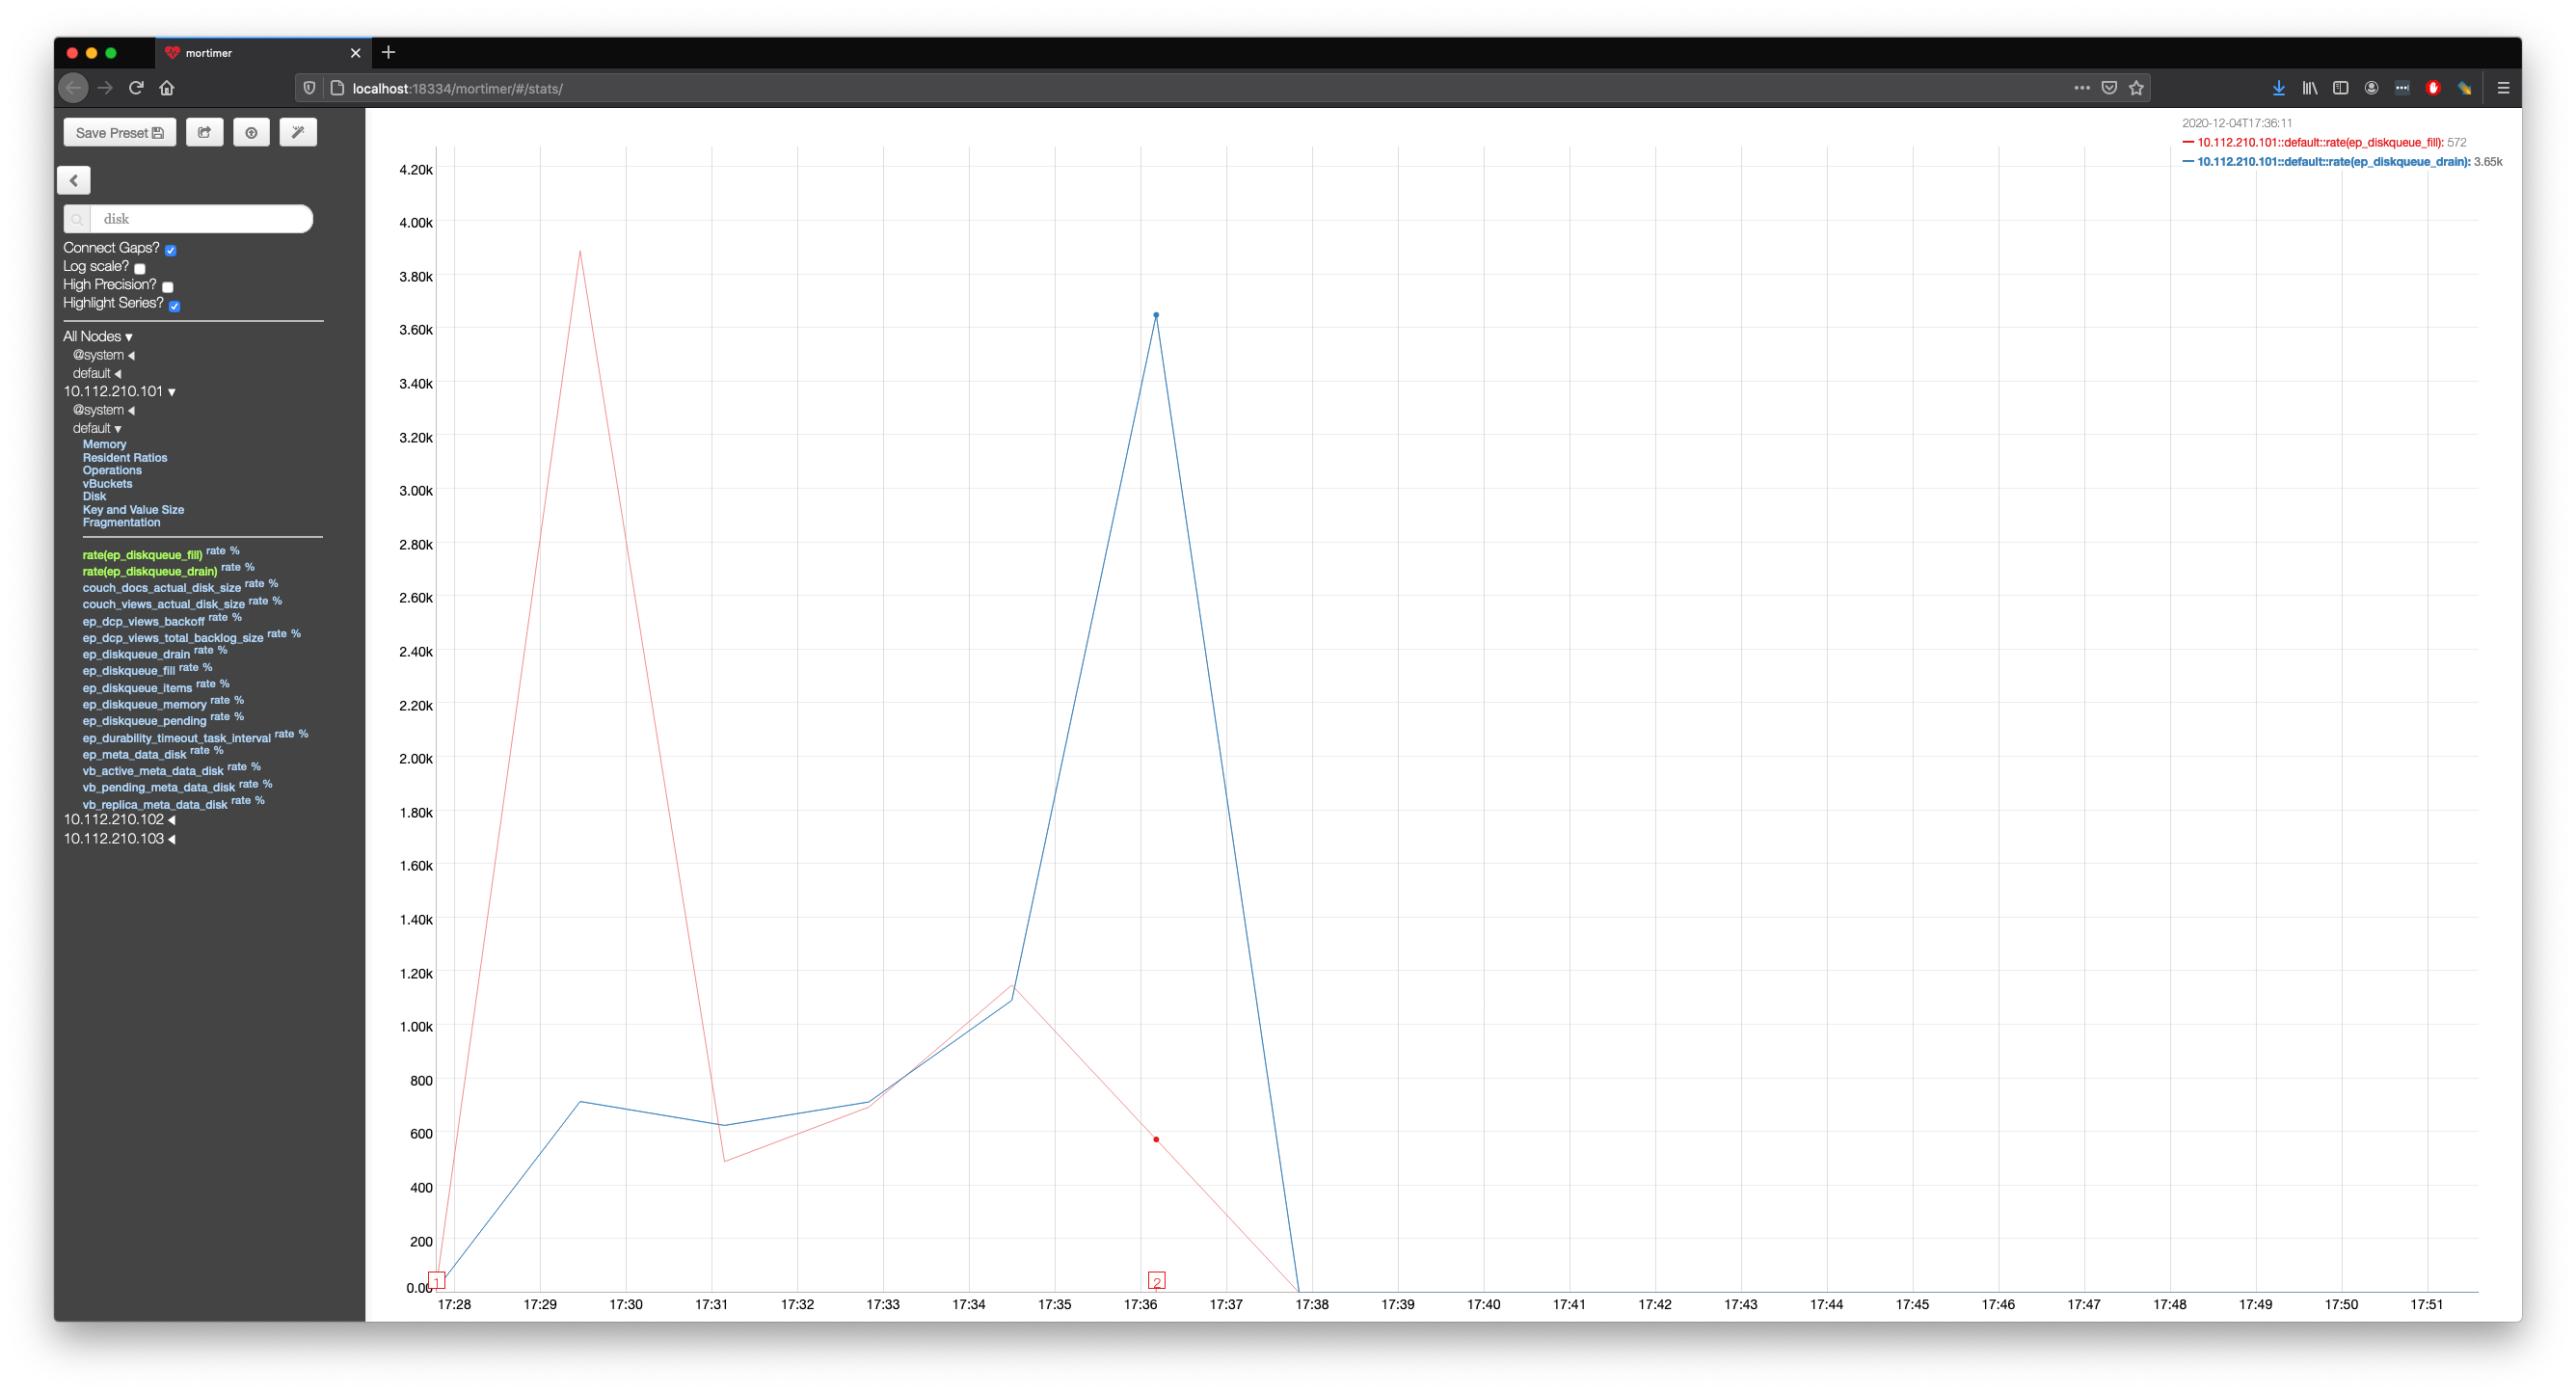
The following graph showing the memory usage lines up nicely with this experiment.

We can see the memory usage rising up untill it exceeds the high water mark at 17:28:30.
At some point the collections are created across all nodes, but the user cannot insert data into them for roughly 6 minutes.
Finally, when the memory usage starts to decrease below the high water mark at roughly 17:34, the user is able to insert the document into the cluster.
Steps to reproduce:
1. Create a 1000 collections in a single scope using the bulk update manifest api (use the collections/@ensureManifest endpoint to make sure the collections have been created across all nodes).
2. Immediately attempt to insert data into via a SDK or a tool like cbworkloadgen.
What happens:
3. Observe that you cannot insert data until the memory usage falls below the high water mark which takes a noticeable amount of time to take place (> minute).
What I expected to happen:
A performance increase here would result in a user being able to insert data earlier post collection creation.