Details
-
Bug
-
Resolution: Fixed
-
 Major
Major
-
6.6.0
-
None
-
Untriaged
-
1
-
Unknown
Description
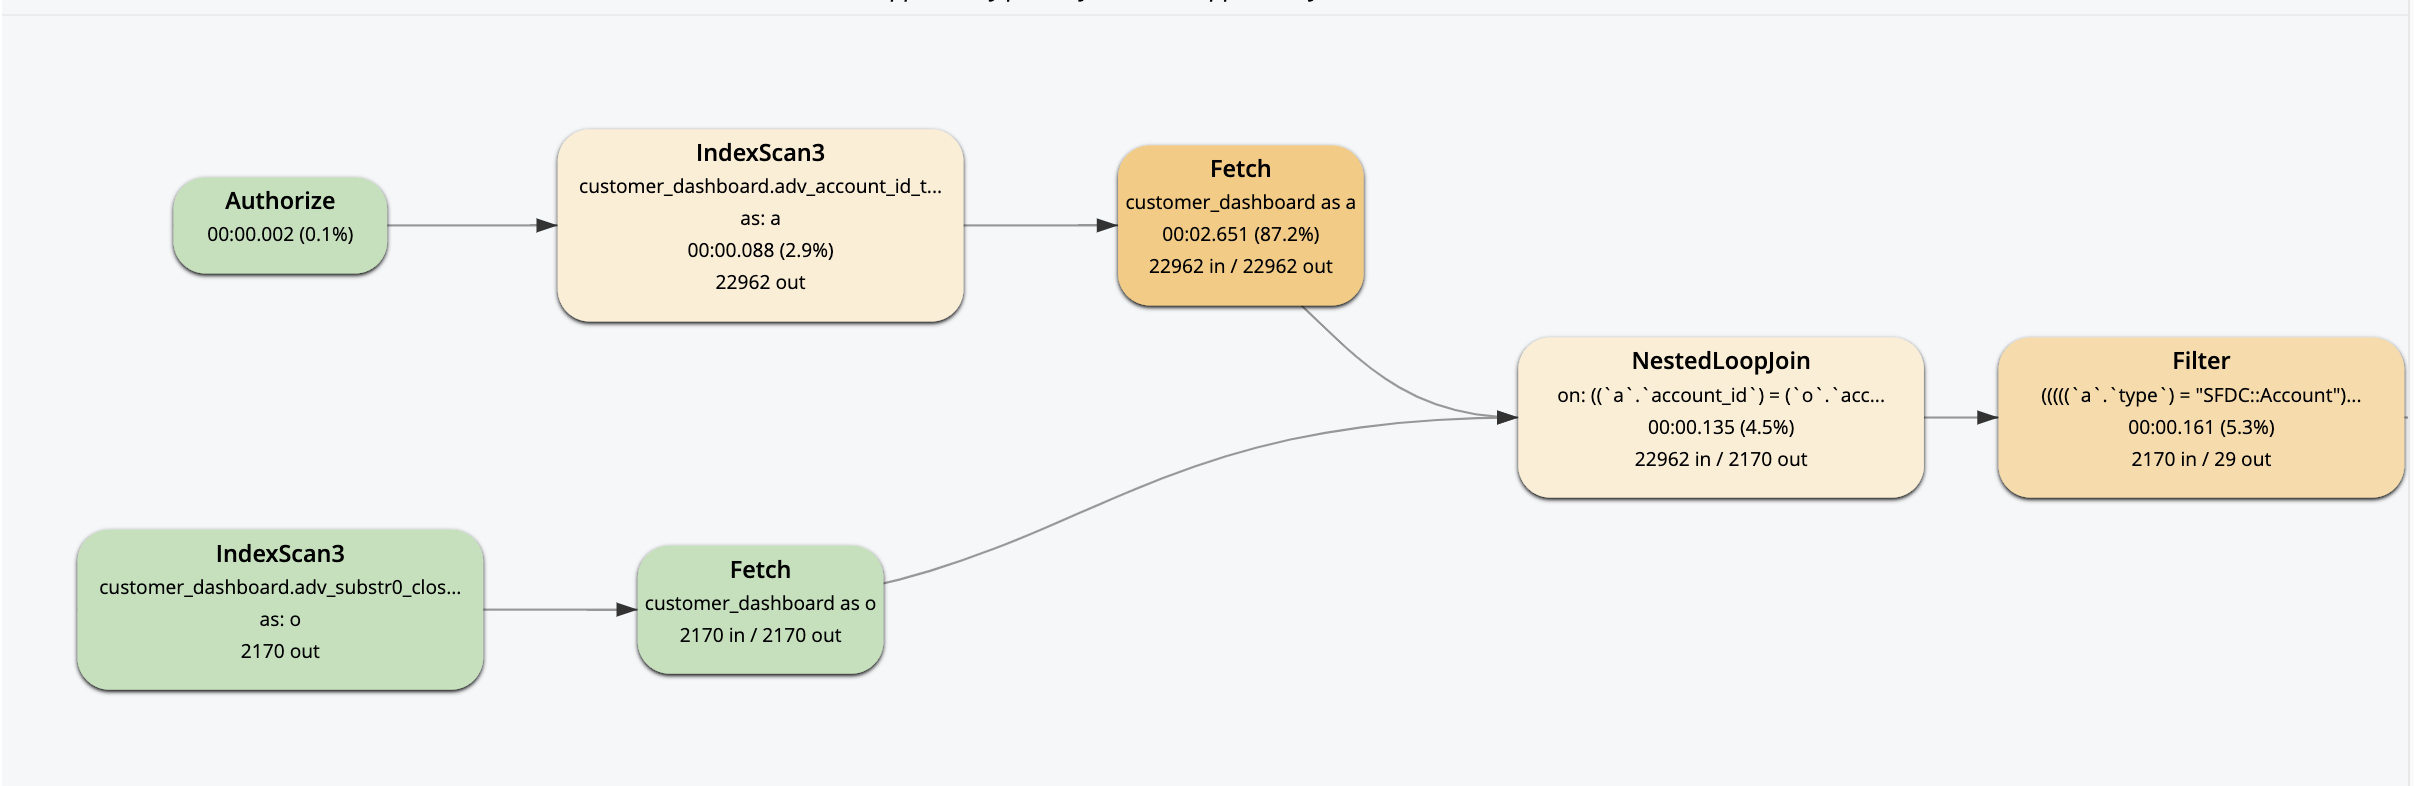
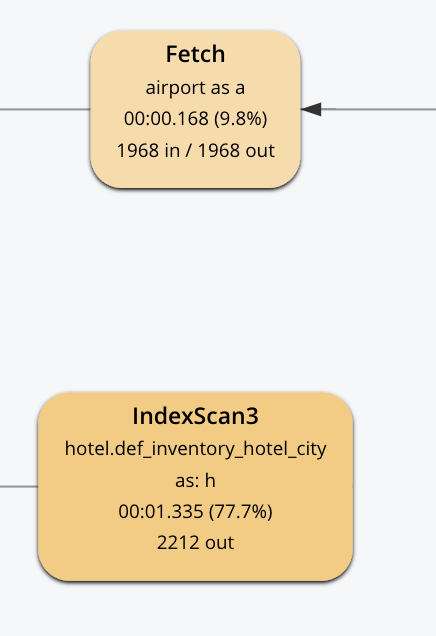
In trying to diagnose where time was being spent. See attached screenshot of the visual plan and attached text of the plan.
The visual plan seems to indicate that the "fetch" was where the longest time was being spent, but in fact it is the index scan where the bulk of time is being spent:
#operator": "IndexScan3",
|
"#stats": {
|
"#itemsOut": 2170,
|
"#phaseSwitches": 77566,
|
"execTime": "485.536164ms",
|
"kernTime": "13.794827ms",
|
"servTime": "35.429536341s"
|
},
|
and the fetch:
"#operator": "Fetch",
|
"#stats": {
|
"#itemsIn": 2170,
|
"#itemsOut": 2170,
|
"#phaseSwitches": 80526,
|
"execTime": "644.873782ms",
|
"kernTime": "36.358946263s",
|
"servTime": "2.690582011s"
|
},
|