Details
-
Bug
-
Resolution: Fixed
-
 Critical
-
Cheshire-Cat
-
1
-
KV-Engine 2021-March
Description
For our compaction time tests there are some differences seen when comparing default collection (bucket) to 1 scope 1 collection, 1 scope 1000 collections, and 1000 scopes 1000 collections.
Showfast page for all the tests:
http://showfast.sc.couchbase.com/#/timeline/Linux/kv/compact/all
Note: default collection (bucket) test uses python sdk2 and the rest of the tests use python sdk3. There is a higher in the number of connection made per client in sdk3.
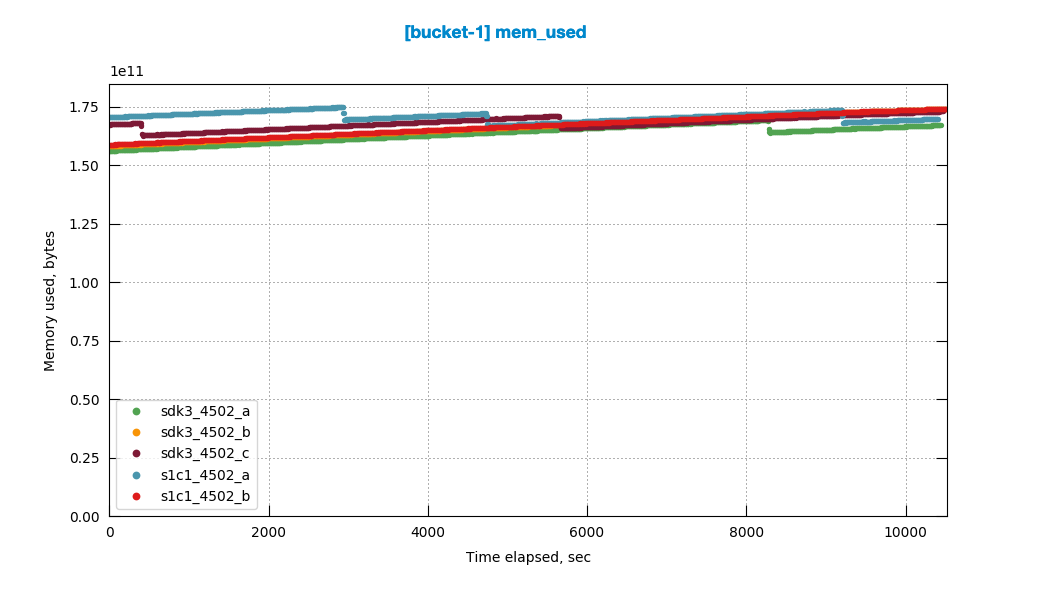
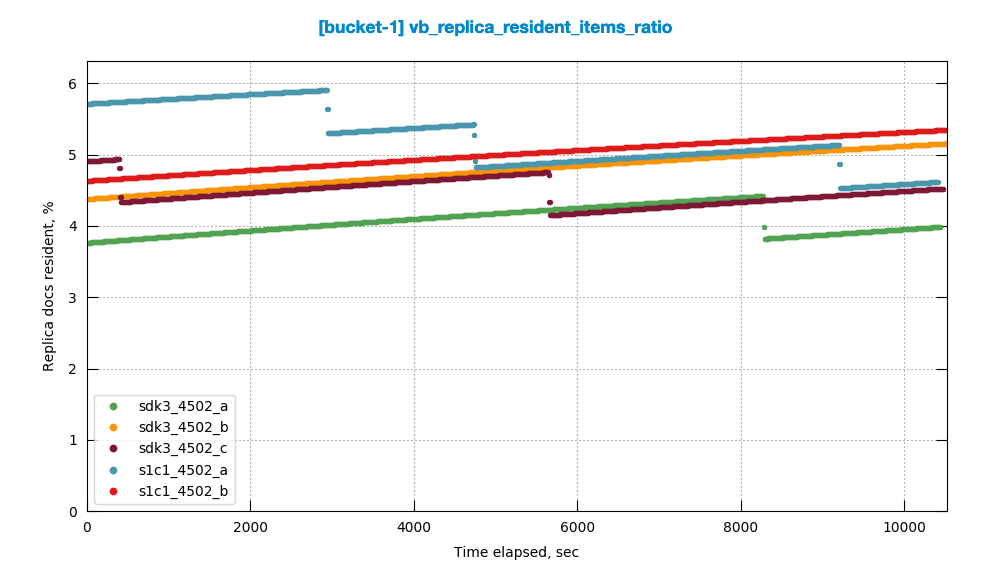
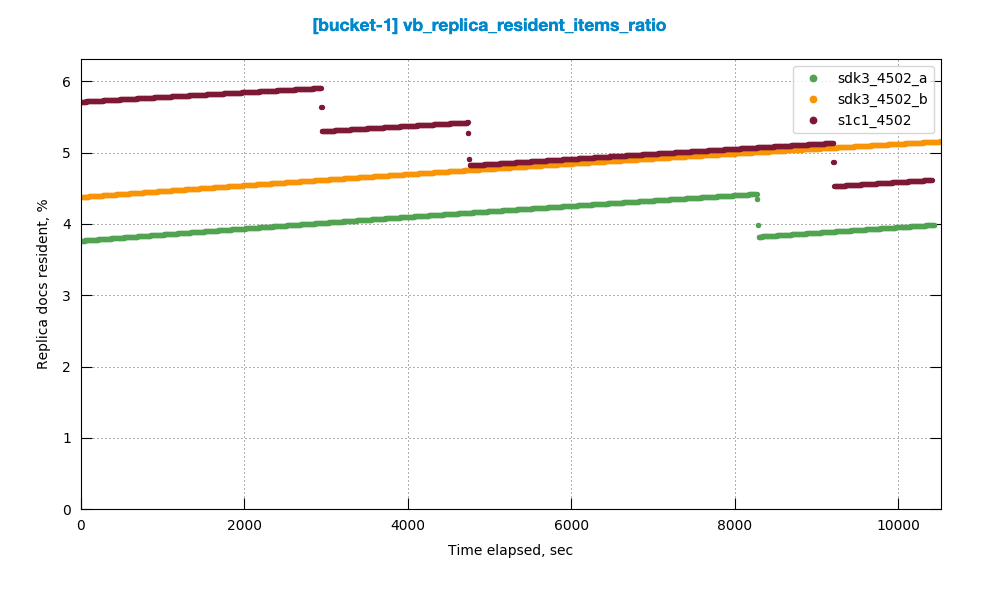
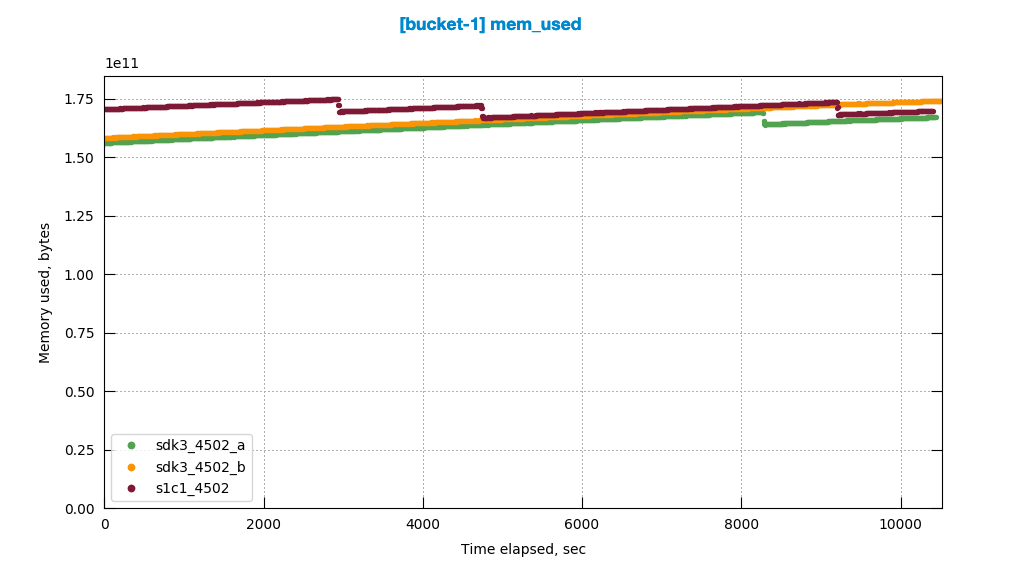
default vs. 1 scope 1 collection:
graph comparison - http://cbmonitor.sc.couchbase.com/reports/html/?snapshot=athena_700-4502_compact_e699&label=default&snapshot=athena_700-4502_compact_cd05&label=1s1c
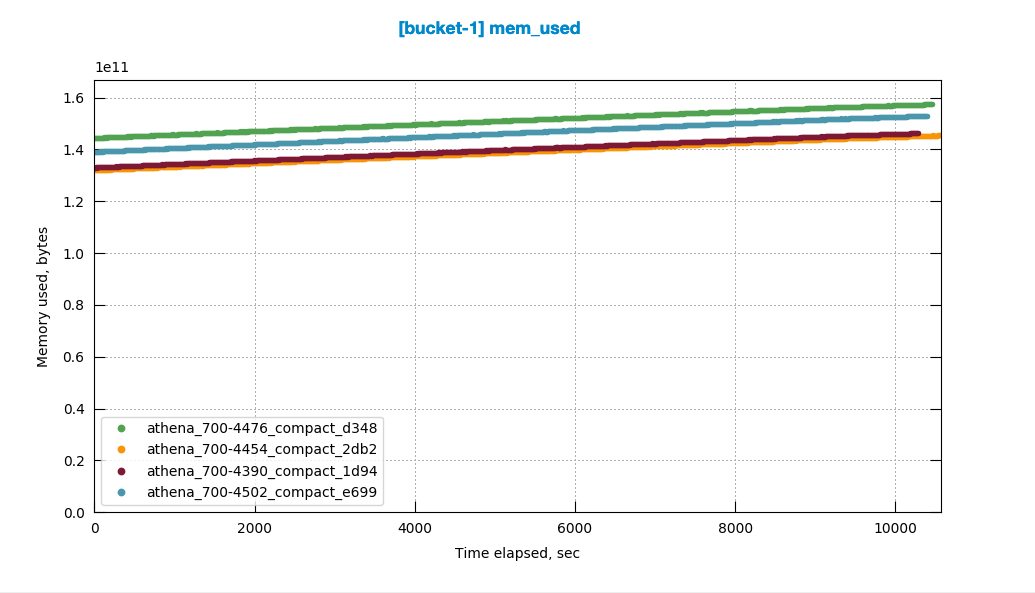
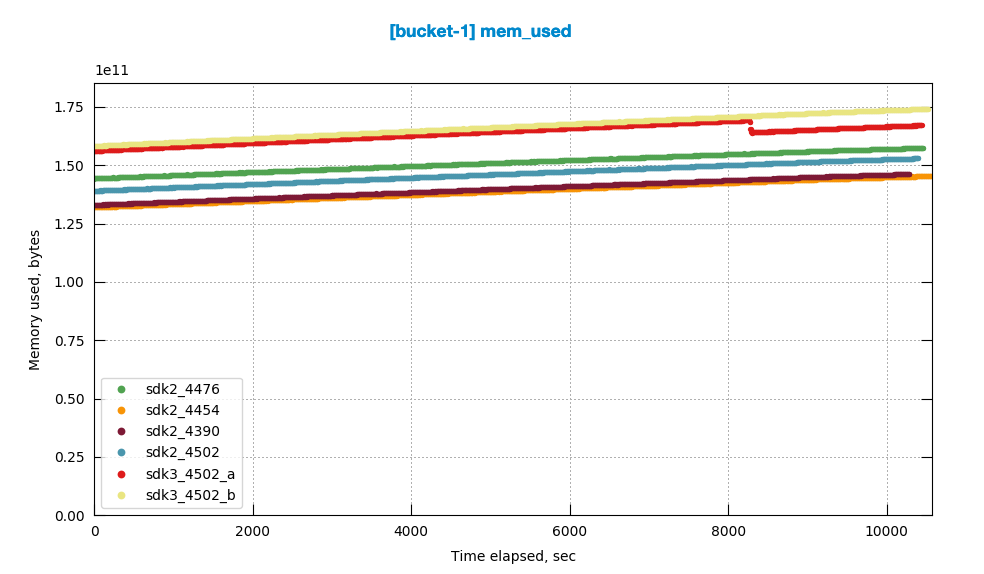
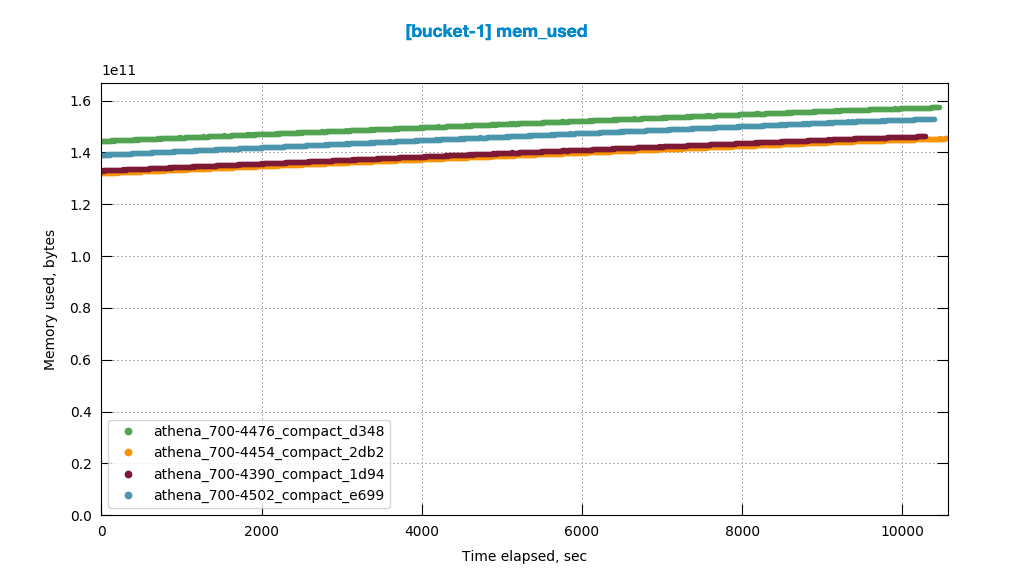
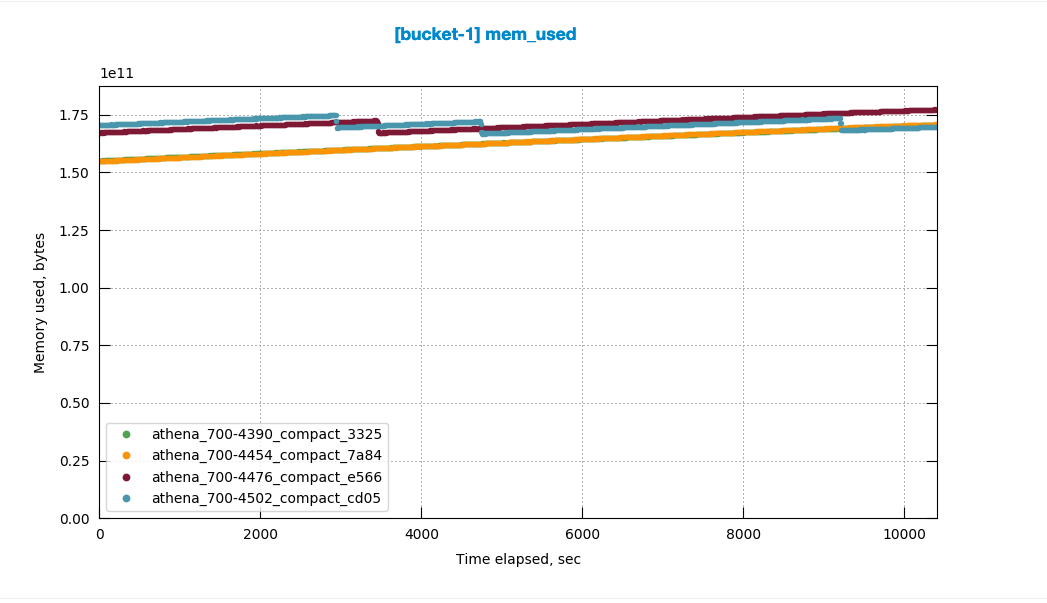
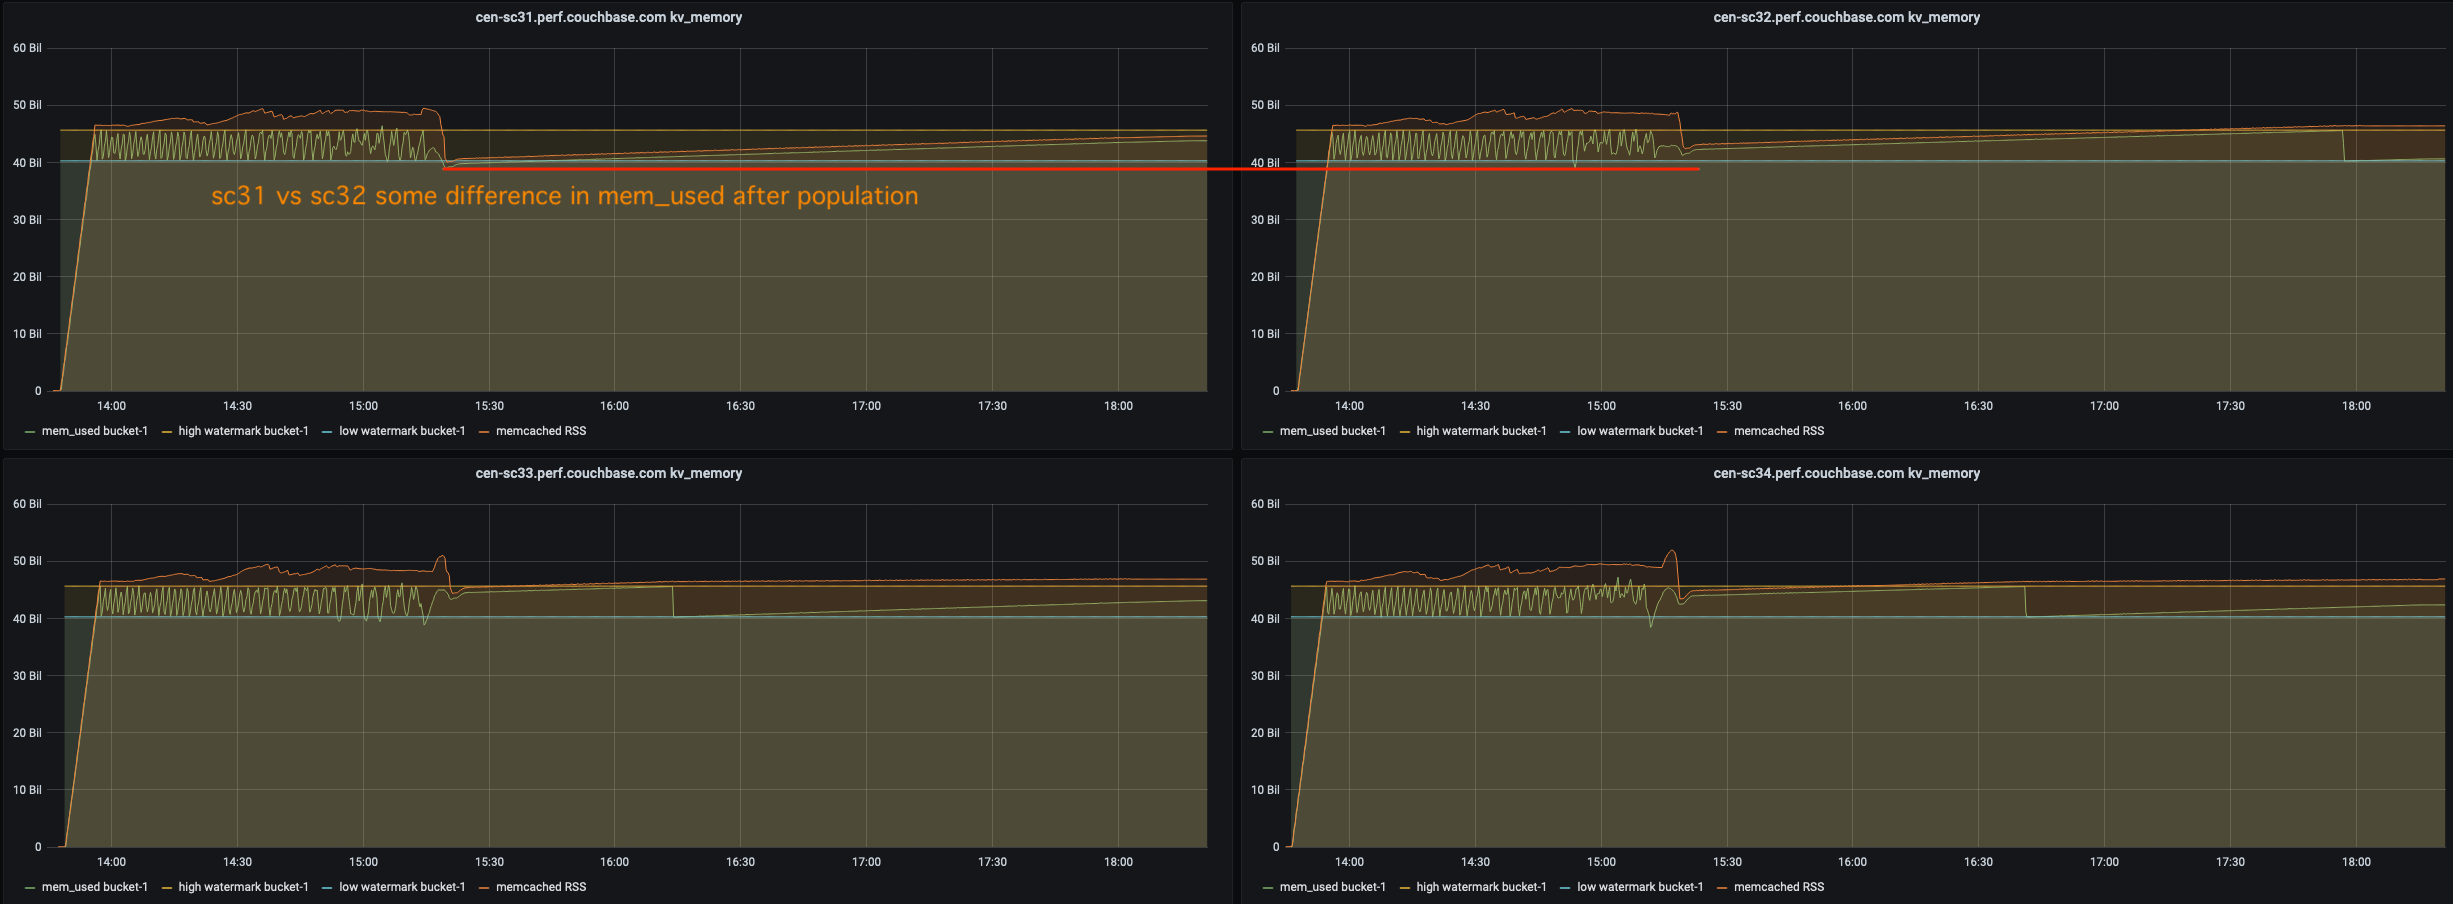
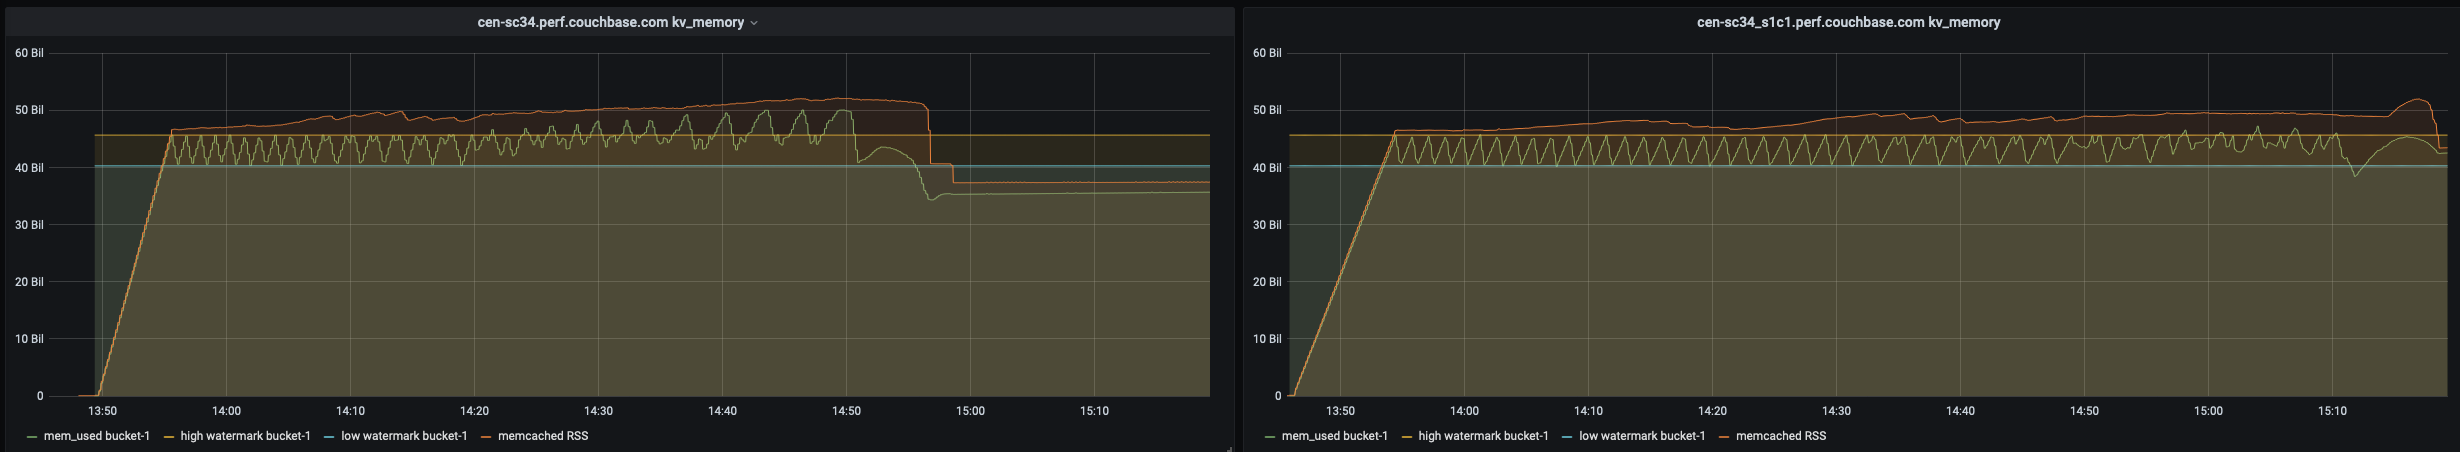
1 - mem_used and ep_meta_data_memory in 1 collection case is higher than for default and trends lower, whereas default trends higher throughout the test
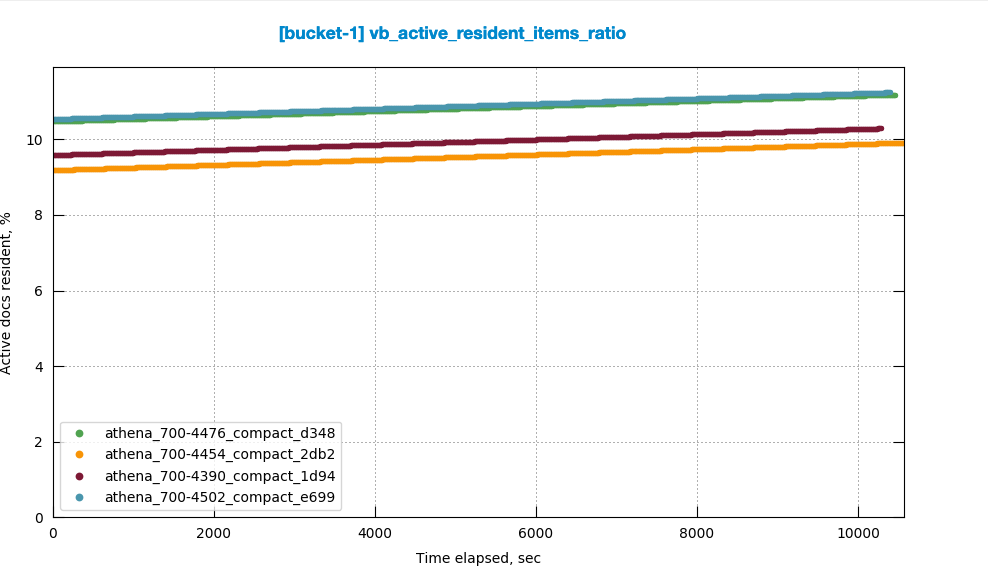
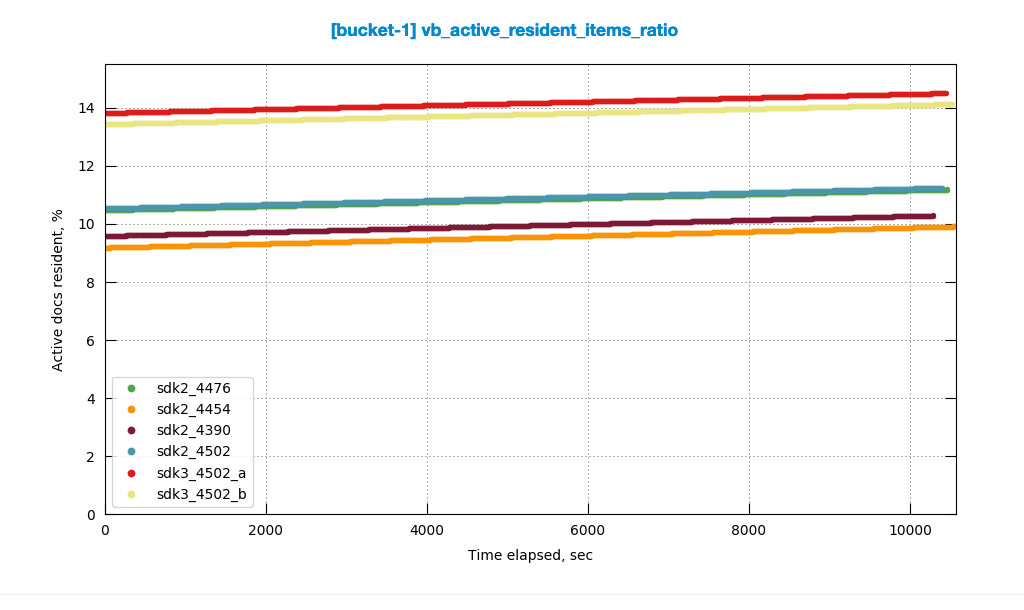
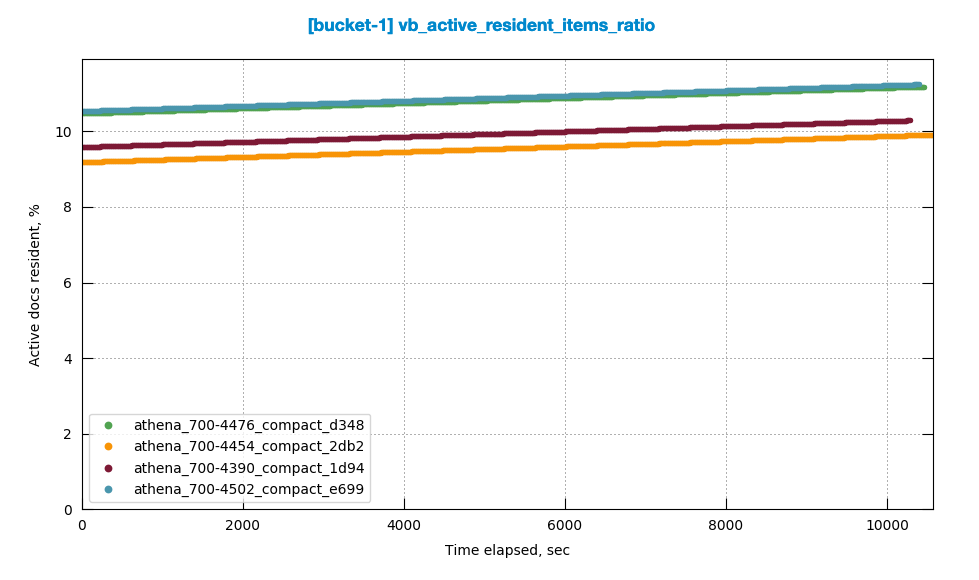
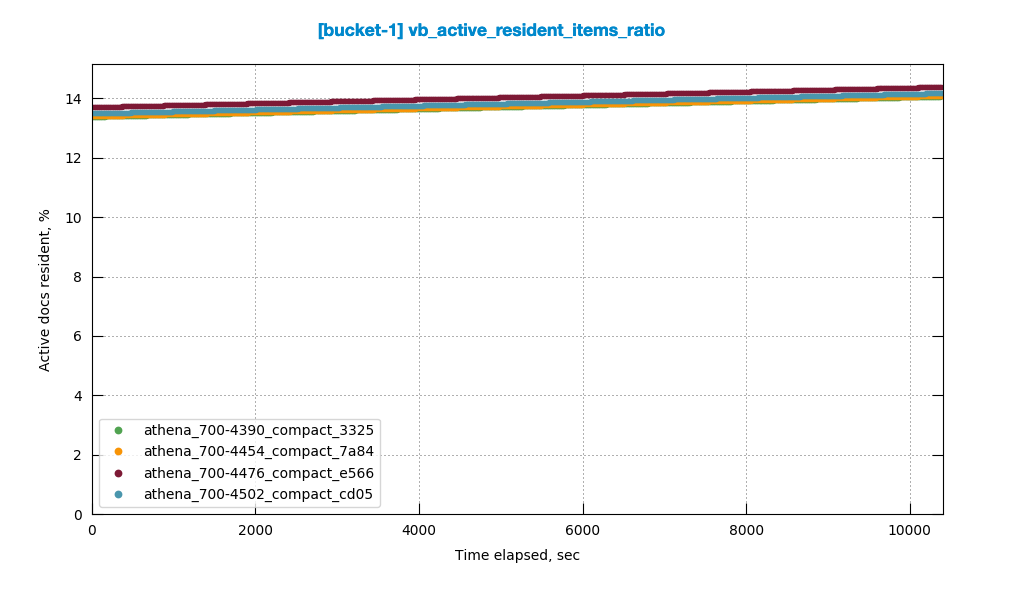
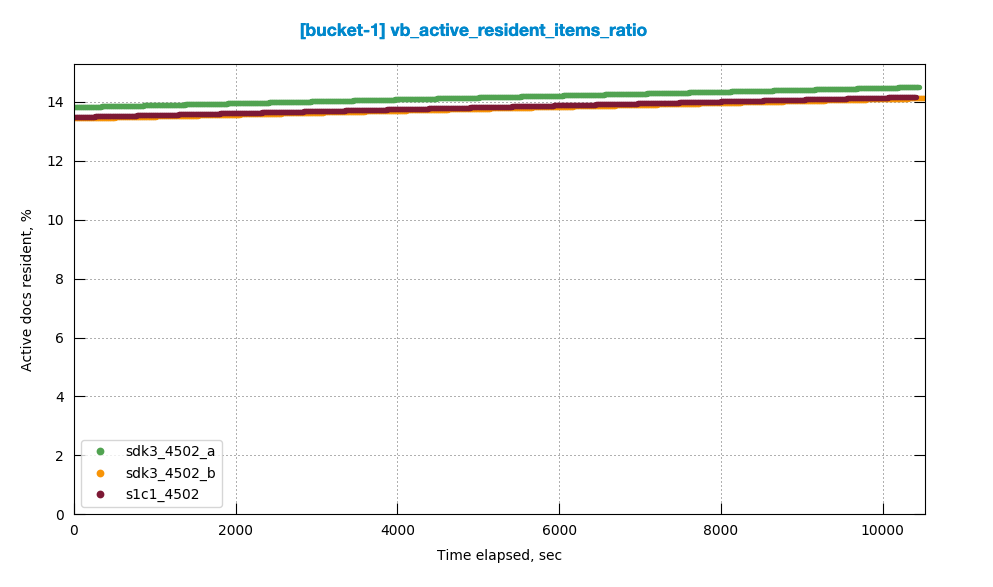
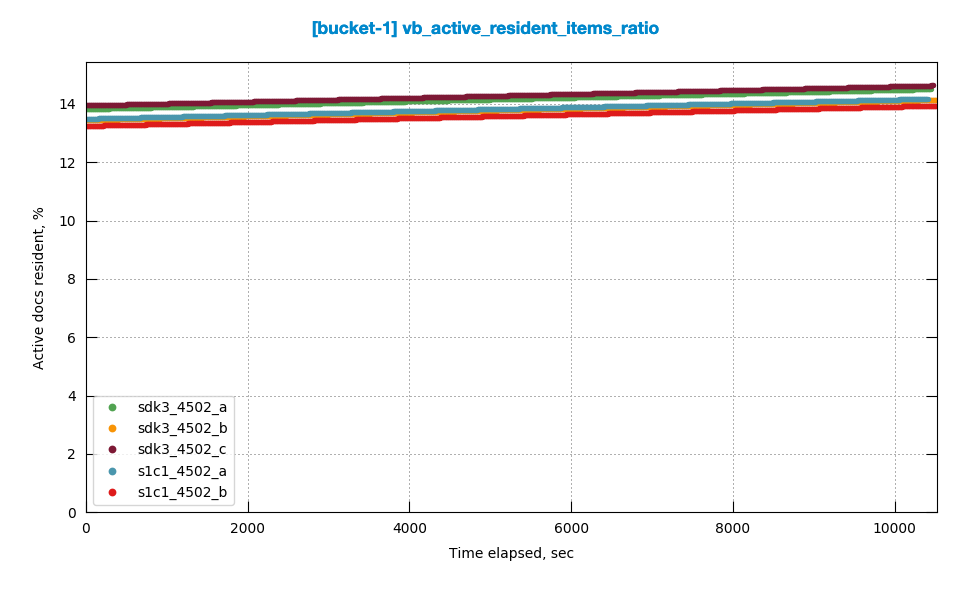
2 - vb_active_resident_items_ratio is 25% higher in 1 collection case
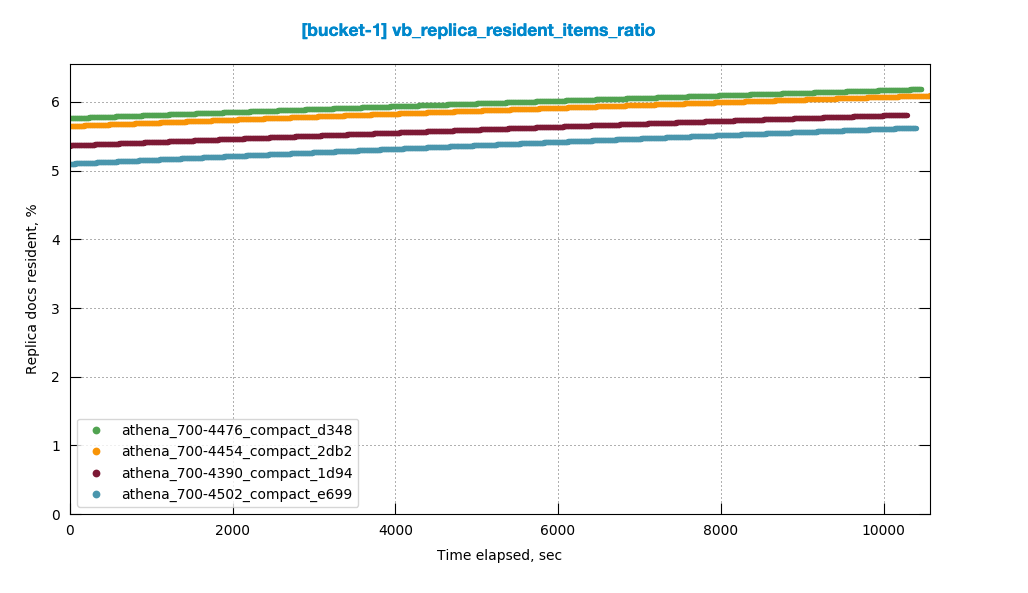
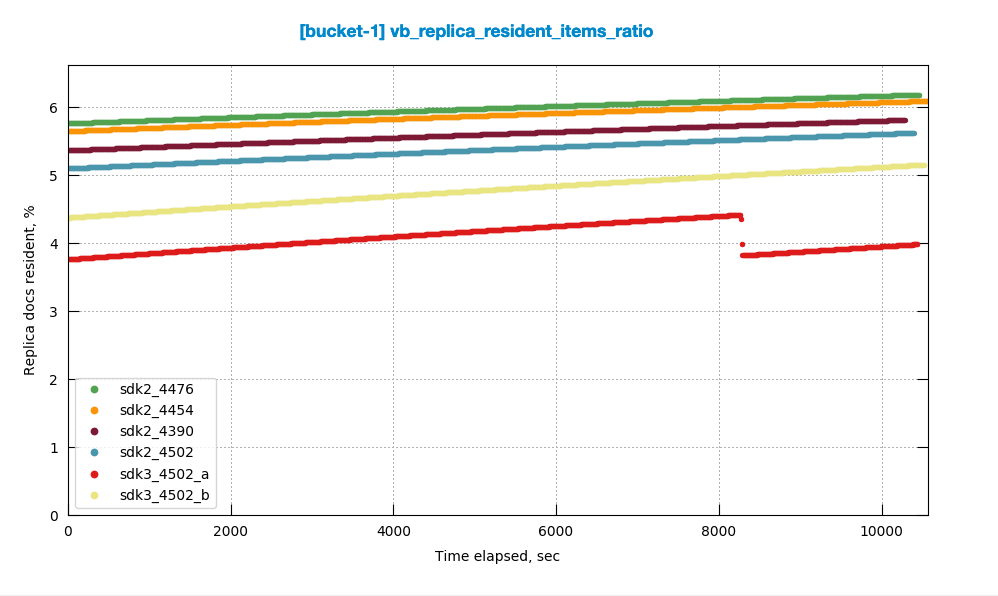
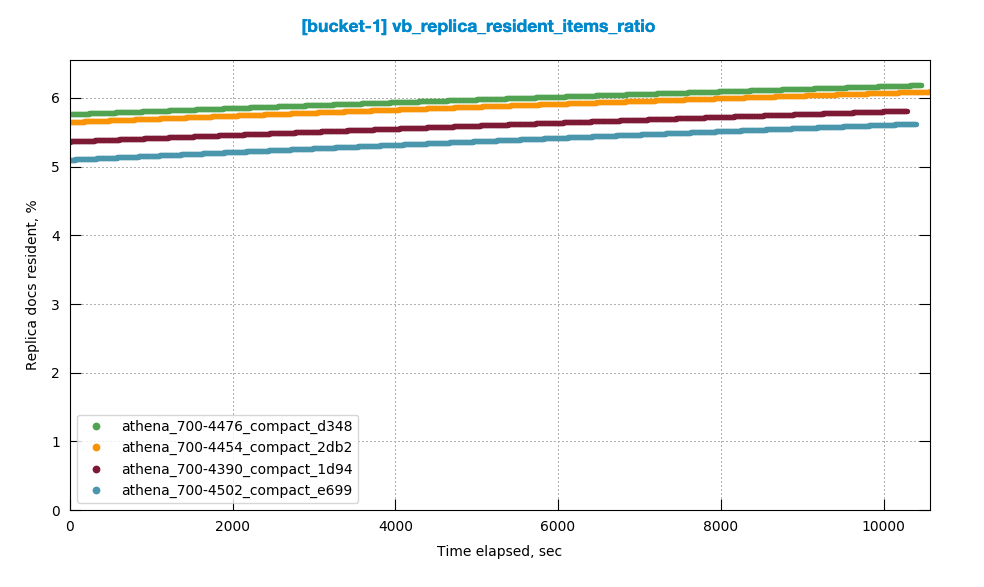
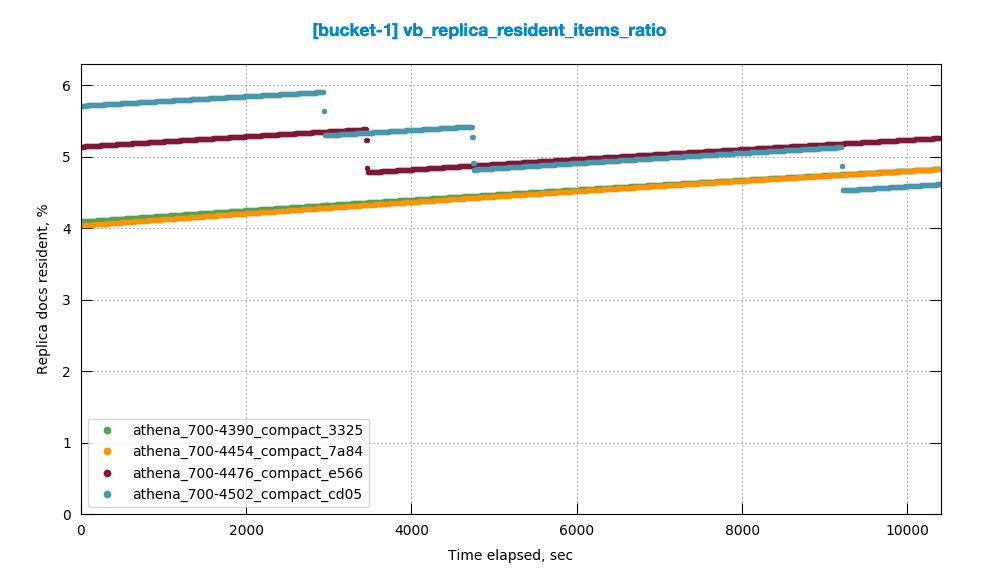
3 - vb_replica_resident_items_ratio starts higher and trends lower in 1 collection case, whereas default trends higher
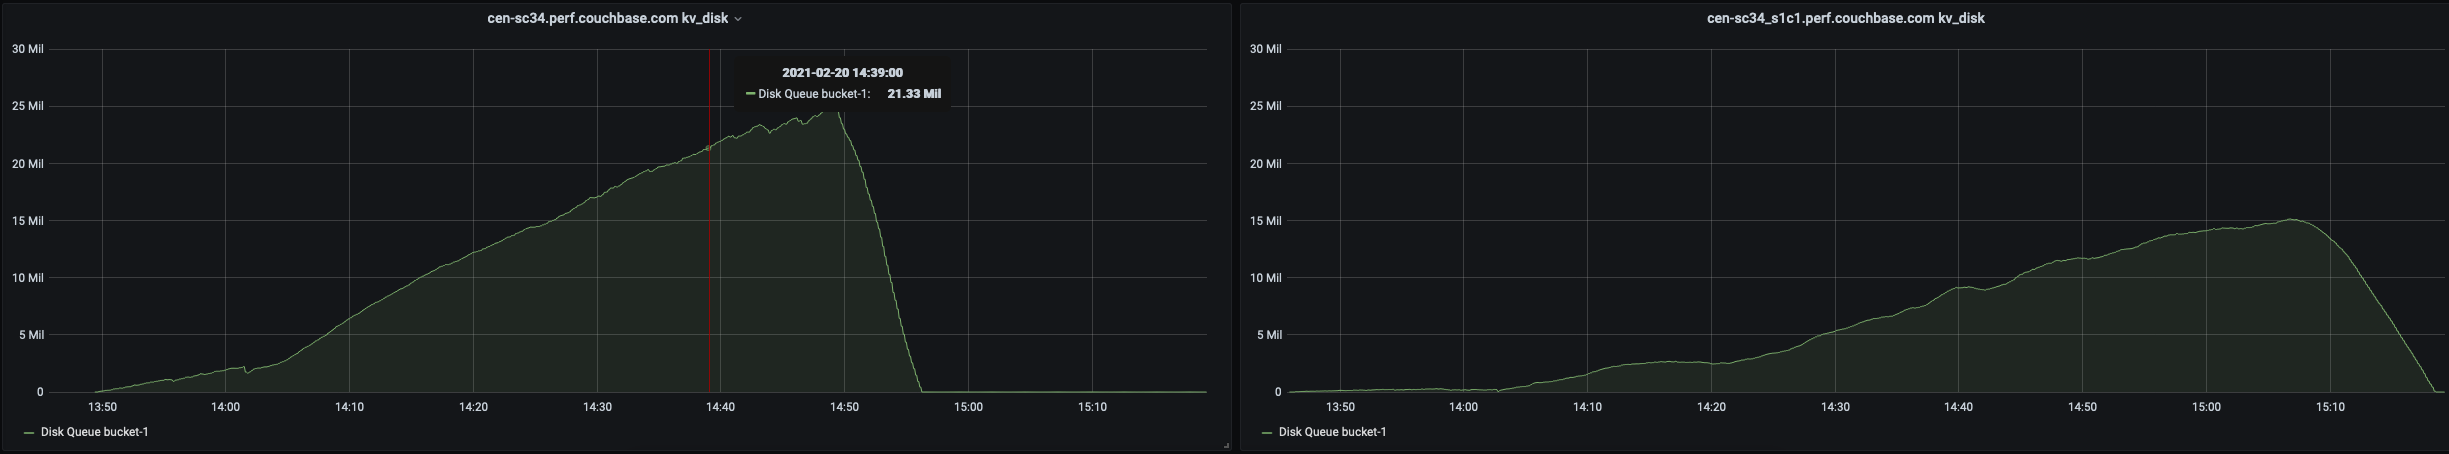
4 - avg_disk_commit_time, avg_disk_update_time, vb_avg_total_queue_age are higher for all percentiles in 1 collection case
5 - couch_docs_actual_disk_size and couch_docs_fragmentation starts 25% higher in 1 collection case
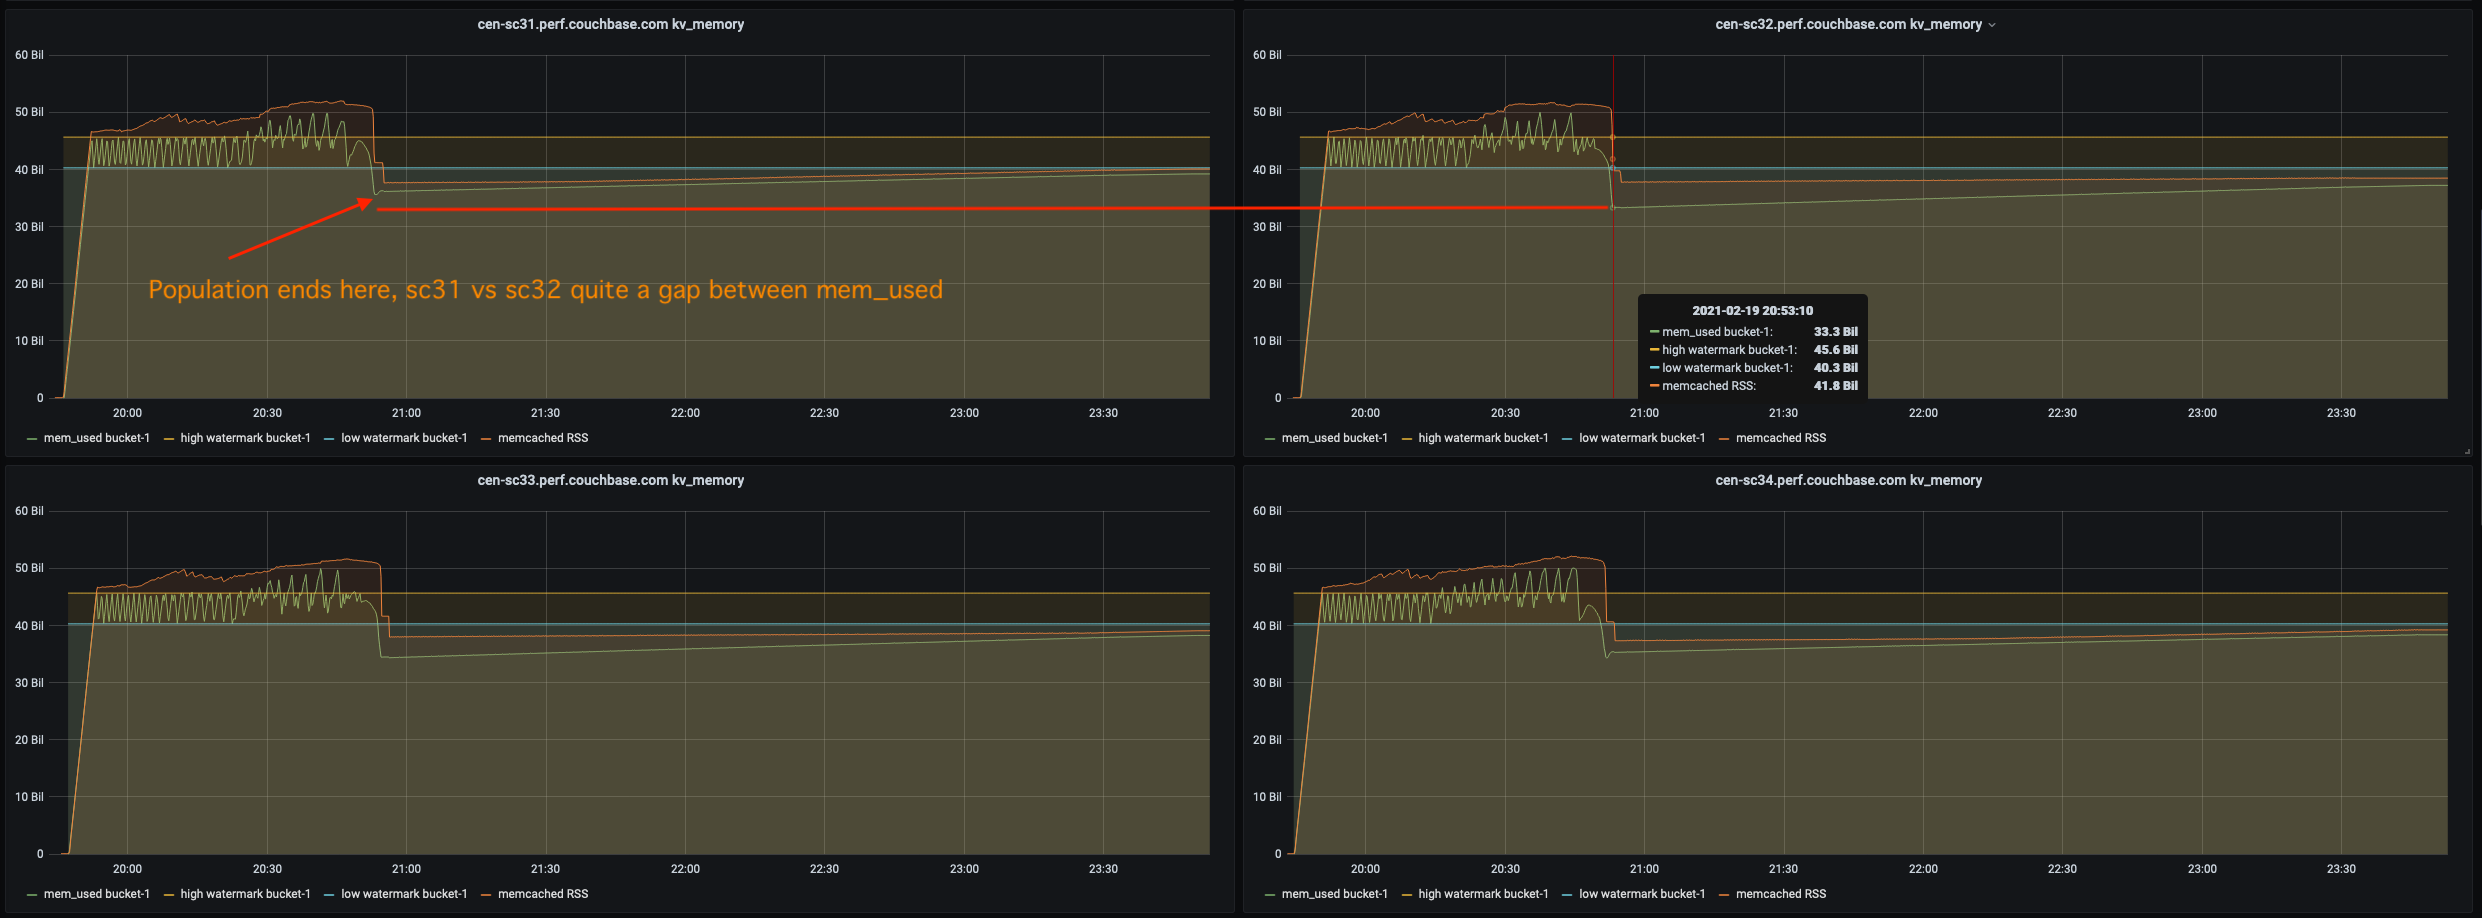
6 - memcached_rss 15% higher in 1 collection case
7 - Cached (memory in pagecache) is 5% lower in 1 collection case
default vs 1 scope 1000 collections:
graph comparison - http://cbmonitor.sc.couchbase.com/reports/html/?snapshot=athena_700-4502_compact_e699&label=default&snapshot=athena_700-4502_compact_a7b7&label=1s1000c
1 - vb_active_resident_items_ratio is 100% higher in 1 scope 1000 collection case
2 - vb_replica_resident_items_ratio is less than 1% (near 0%) in 1 scope 1000 collection case, whereas default is around 5%
3 - couch_docs_actual_disk_size is 40% higher in 1 scope 1000 collection case
4 - couch_docs_fragmentation is 50% higher in 1 scope 1000 collection case
5 - beam.smp_rss is 250% higher in 1 scope 1000 collection case
6 - beam.smp_cpu is 600% higher in 1 scope 1000 collection case
7 - memcached_cpu is 25% higher in 1 scope 1000 collection case
default vs 1000 scopes 1000 collections:
graph comparison - http://cbmonitor.sc.couchbase.com/reports/html/?snapshot=athena_700-4502_compact_e699&label=default&snapshot=athena_700-4502_compact_0315&label=1000s1000c
1 scope 1000 collections vs. 1000 scopes 1000 collections:
graph comparison - http://cbmonitor.sc.couchbase.com/reports/html/?snapshot=athena_700-4502_compact_a7b7&label=1s1000c&snapshot=athena_700-4502_compact_0315&label=1000s1000c
1 - avg_disk_update_time is higher for all percentiles in 1000 scope 1000 collection case.
2 - beam.smp_rss is 10% higher in 1000 scope 1000 collection case
3 - beam.smp_cpu is 70% higher in 1000 scope 1000 collection case
Attachments
Issue Links
| For Gerrit Dashboard: MB-44539 | ||||||
|---|---|---|---|---|---|---|
| # | Subject | Branch | Project | Status | CR | V |
| 147770,4 | MB-44539: More efficient generation of collection stats document ID | master | kv_engine | Status: MERGED | +2 | +1 |
| 147911,4 | MB-44539: Don't read dropped collections metadata unless it exists | master | kv_engine | Status: MERGED | +2 | +1 |
| 148275,4 | MB-44539: Reduce cost of MemoryAllocator 'read bytes allocated' | master | kv_engine | Status: MERGED | +2 | +1 |
| 148285,5 | MB-44539: Improve performance of collection memory tracking | master | kv_engine | Status: MERGED | +2 | +1 |