Details
-
Bug
-
Resolution: Fixed
-
 Test Blocker
-
Cheshire-Cat
-
Untriaged
-
-
1
-
Yes
Description
Build : 7.0.0-4539
Test : -test tests/integration/cheshirecat/test_cheshirecat_kv_gsi_coll_xdcr_backup_sgw_fts_itemct_txns_eventing_cbas.yml -scope tests/integration/cheshirecat/scope_cheshirecat_with_backup.yml
Scale : 2
Iteration : 1st
The longevity test started at 2021-02-24T16:11. After creating buckets, scopes collections and some initial setup, there is a rebalance operation to remove a data node. This started at 2021-02-24T16:35:48. At 2021-02-24T16:38, this rebalance operation failed because of :
[ns_server:error,2021-02-24T16:38:44.545-08:00,ns_1@172.23.97.74:service_rebalancer-index<0.16911.24>:service_rebalancer:run_rebalance_worker:136]Agent terminated during the rebalance: {'DOWN',
|
#Ref<0.2149394143.2317090822.16574>,
|
process,<29982.26924.0>,
|
{linked_process_died,<29982.27226.0>,
|
{timeout,
|
{gen_server,call,
|
[<29982.27014.0>,
|
{call,
|
"ServiceAPI.GetCurrentTopology",
|
#Fun<json_rpc_connection.0.44122352>},
|
60000]}}}}
|
[user:error,2021-02-24T16:38:44.548-08:00,ns_1@172.23.97.74:<0.23064.0>:ns_orchestrator:log_rebalance_completion:1407]Rebalance exited with reason {service_rebalance_failed,index,
|
{agent_died,<29982.26924.0>,
|
{linked_process_died,<29982.27226.0>,
|
{timeout,
|
{gen_server,call,
|
[<29982.27014.0>,
|
{call,"ServiceAPI.GetCurrentTopology",
|
#Fun<json_rpc_connection.0.44122352>},
|
60000]}}}}}.
|
Rebalance Operation Id = 4175f148c90a6f4bb009238fdc1d2e1f
|
On all the indexer nodes, these type of errors can be seen in the error.log. This one is from 172.23.96.243 :
[ns_server:error,2021-02-24T16:38:43.565-08:00,ns_1@172.23.96.243:service_status_keeper-index<0.24276.0>:service_status_keeper:handle_cast:104]Service service_index returned incorrect status
|
[ns_server:error,2021-02-24T16:38:44.547-08:00,ns_1@172.23.96.243:service_agent-index<0.28735.0>:service_agent:handle_info:287]Rebalancer <29344.16911.24> died unexpectedly: {agent_died,<29395.26924.0>,
|
{linked_process_died,
|
<29395.27226.0>,
|
{timeout,
|
{gen_server,call,
|
[<29395.27014.0>,
|
{call,
|
"ServiceAPI.GetCurrentTopology",
|
#Fun<json_rpc_connection.0.44122352>},
|
60000]}}}}
|
[ns_server:error,2021-02-24T16:38:48.649-08:00,ns_1@172.23.96.243:service_status_keeper_worker<0.24275.0>:rest_utils:get_json:59]Request to (indexer) getIndexStatus failed: {ok,
|
{{500,"Internal Server Error"},
|
[{"Content-Length","226"},
|
{"Date",
|
"Thu, 25 Feb 2021 00:38:48 GMT"},
|
{"Content-Type",
|
"application/json"}],
|
<<"{\"code\":\"error\",\"error\":\"Fail to retrieve cluster-wide metadata from index service\",\"failedNodes\":[\"172.23.96.243:8091\",\"172.23.96.254:8091\",\"172.23.97.105:8091\",\"172.23.97.110:8091\",\"172.23.97.112:8091\",\"172.23.97.148:8091\"]}">>}}
|
Tracking back in the error.log, this error has started from 2021-02-24T16:16:21.
On 172.23.97.112's debug log, we see this too -
[error_logger:error,2021-02-24T16:38:44.544-08:00,ns_1@172.23.97.112:<0.27226.0>:ale_error_logger_handler:do_log:107]
|
=========================CRASH REPORT=========================
|
crasher:
|
initial call: service_agent:'-start_long_poll_worker/4-fun-0-'/0
|
pid: <0.27226.0>
|
registered_name: []
|
exception exit: {timeout,
|
{gen_server,call,
|
[<0.27014.0>,
|
{call,"ServiceAPI.GetCurrentTopology",
|
#Fun<json_rpc_connection.0.44122352>},
|
60000]}}
|
in function gen_server:call/3 (gen_server.erl, line 223)
|
in call from service_api:perform_call/3 (src/service_api.erl, line 55)
|
in call from service_agent:grab_topology/2 (src/service_agent.erl, line 590)
|
in call from service_agent:long_poll_worker_loop/5 (src/service_agent.erl, line 655)
|
ancestors: ['service_agent-index',service_agent_children_sup,
|
service_agent_sup,ns_server_sup,ns_server_nodes_sup,
|
<0.21412.0>,ns_server_cluster_sup,root_sup,<0.138.0>]
|
message_queue_len: 0
|
messages: []
|
links: [<0.26924.0>]
|
dictionary: []
|
trap_exit: false
|
status: running
|
heap_size: 2586
|
stack_size: 27
|
reductions: 4854
|
neighbours:
|
|
|
[ns_server:error,2021-02-24T16:38:44.544-08:00,ns_1@172.23.97.112:service_agent-index<0.26924.0>:service_agent:handle_info:283]Linked process <0.27226.0> died with reason {timeout,
|
{gen_server,call,
|
[<0.27014.0>,
|
{call,
|
"ServiceAPI.GetCurrentTopology",
|
#Fun<json_rpc_connection.0.44122352>},
|
60000]}}. Terminating
|
[ns_server:error,2021-02-24T16:38:44.545-08:00,ns_1@172.23.97.112:service_agent-index<0.26924.0>:service_agent:terminate:312]Terminating abnormally
|
[ns_server:error,2021-02-24T16:38:44.545-08:00,ns_1@172.23.97.112:service_agent-index<0.26924.0>:service_agent:terminate:317]Terminating json rpc connection for index: <0.27014.0>
|
[error_logger:error,2021-02-24T16:38:44.545-08:00,ns_1@172.23.97.112:json_rpc_connection_sup<0.251.0>:ale_error_logger_handler:do_log:107]
|
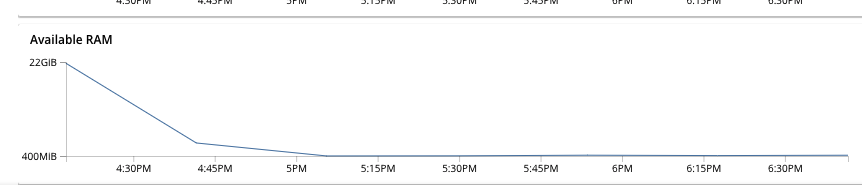
One more issue that is seen is that indexer memory usage is 98% on all the nodes. The indexes arent even created. See attached screenshot of the indexer memory usage graph. This could be the reason of getIndexStatus not responding.
The memory rss reported in indexer_stats.log doesnt match -
[root@localhost logs]# cat indexer_stats.log | grep memory_rss
|
2021-02-24T16:12:13.667-08:00 indexer {"avg_resident_percent":0,"cpu_utilization":14.665200146652001,"index_not_found_errcount":0,"indexer_state":"Active","memory_free":21062361088,"memory_quota":22592618496,"memory_rss":136474624,"memory_total":24570773504,"memory_total_storage":7901184,"memory_used":112091136,"memory_used_queue":0,"memory_used_storage":167936,"needs_restart":false,"num_connections":0,"num_cpu_core":8,"num_indexes":0,"num_storage_instances":0,"storage_mode":"plasma","timestamp":"1614211933667260064","timings/stats_response":"73 2365645 262354316239","total_data_size":0,"total_disk_size":0,"uptime":"1m0.594530018s"}
|
2021-02-24T16:13:13.667-08:00 indexer {"cpu_utilization":0.4,"memory_free":21221564416,"memory_rss":139624448,"memory_total_storage":8171520,"memory_used":152893440,"timestamp":"1614211993667608098","timings/stats_response":"145 4130395 307964242411","uptime":"2m0.594876694s"}
|
2021-02-24T16:14:13.667-08:00 indexer {"cpu_utilization":1.7999999999999998,"memory_free":21229883392,"memory_rss":139997184,"memory_total_storage":8200192,"memory_used":162031616,"timestamp":"1614212053667910719","timings/stats_response":"217 5907270 353612419138","uptime":"3m0.595179948s"}
|
2021-02-24T16:15:13.668-08:00 indexer {"cpu_utilization":16.666666666666664,"memory_free":21051469824,"memory_rss":230797312,"memory_total_storage":9506816,"memory_used":122316800,"memory_used_storage":401408,"num_connections":2,"num_indexes":1,"num_storage_instances":1,"timestamp":"1614212113668187720","timings/stats_response":"295 1646921227 2675255019827900535","total_data_size":16384,"total_disk_size":16384,"uptime":"4m0.595456286s"}
|
2021-02-24T16:16:13.668-08:00 indexer {"cpu_utilization":12.333333333333334,"memory_free":20971921408,"memory_rss":232644608,"memory_total_storage":10489856,"memory_used":241833984,"memory_used_storage":585728,"timestamp":"1614212173668854454","timings/stats_response":"366 1653006709 2675255562006951163","uptime":"5m0.596126616s"}
|
2021-02-24T16:17:13.669-08:00 indexer {"cpu_utilization":8.3,"memory_free":21086658560,"memory_rss":241172480,"timestamp":"1614212233669469098","timings/stats_response":"374 1653604975 2675255607031580815","uptime":"6m0.596737182s"}
|
2021-02-24T16:18:13.670-08:00 indexer {"cpu_utilization":11.533333333333333,"memory_free":21028188160,"memory_rss":249155584,"timestamp":"1614212293669947037","uptime":"7m0.597216844s"}
|
2021-02-24T16:19:13.670-08:00 indexer {"cpu_utilization":8.266666666666666,"memory_free":21071896576,"memory_rss":265846784,"timestamp":"1614212353670486769","uptime":"8m0.597755282s"}
|
2021-02-24T16:20:13.671-08:00 indexer {"cpu_utilization":8.233333333333333,"memory_free":21050007552,"memory_rss":274522112,"timestamp":"1614212413670974938","uptime":"9m0.598243582s"}
|
2021-02-24T16:21:13.671-08:00 indexer {"cpu_utilization":8.3,"memory_free":20995198976,"memory_rss":286281728,"timestamp":"1614212473671554150","uptime":"10m0.598825899s"}
|
2021-02-24T16:22:13.672-08:00 indexer {"cpu_utilization":8.200000000000001,"memory_free":21029502976,"memory_rss":301539328,"timestamp":"1614212533672086444","uptime":"11m0.599355324s"}
|
2021-02-24T16:23:13.672-08:00 indexer {"cpu_utilization":8.233333333333333,"memory_free":21016768512,"memory_rss":311119872,"timestamp":"1614212593672643233","uptime":"12m0.599911615s"}
|
2021-02-24T16:24:13.673-08:00 indexer {"cpu_utilization":9.633333333333335,"memory_free":20899692544,"memory_rss":321163264,"timestamp":"1614212653673116844","uptime":"13m0.60038549s"}
|
2021-02-24T16:25:13.673-08:00 indexer {"cpu_utilization":17.366666666666667,"memory_free":20820537344,"memory_rss":406687744,"timestamp":"1614212713673718257","uptime":"14m0.600987472s"}
|
2021-02-24T16:26:13.674-08:00 indexer {"cpu_utilization":35.66666666666667,"memory_free":19433553920,"memory_rss":1713164288,"timestamp":"1614212773674250181","uptime":"15m0.601522101s"}
|
2021-02-24T16:27:13.674-08:00 indexer {"cpu_utilization":37.46666666666666,"memory_free":18069827584,"memory_rss":3062398976,"timestamp":"1614212833674909242","uptime":"16m0.6021789s"}
|
2021-02-24T16:28:13.675-08:00 indexer {"cpu_utilization":37.166666666666664,"memory_free":16837234688,"memory_rss":4299309056,"timestamp":"1614212893675384092","uptime":"17m0.602652978s"}
|
This issue is consistently seen in 2 longevity clusters running the same test with the same build. This wasnt seen earlier. The last time test was run with 7.0.0-4525.