Details
-
Bug
-
Resolution: Fixed
-
 Major
Major
-
Cheshire-Cat
-
Centos 7 64 bit; Couchbase EE 7.0.0-4532
-
Untriaged
-
-
1
-
No
Description
Summary:
This may or may not be a bug, but it would be good to understand the issue on why the RAM usage on .74 node remained high (after waiting sufficiently long) after increasing the scrape_interval and scrape_timeout to 10s (from earlier 1s that was set)
The cluster contains 30 buckets, 500 indexes x 2 replicas, close to 1000 collections, approx 1000 scopes and 15 XDCR replications. The scrape interval was set to 1s at some point during the volume test, and when we set it back to 10s it continued to remain at 95%
Some consequences (as a result of the high RAM on .74 node probably):
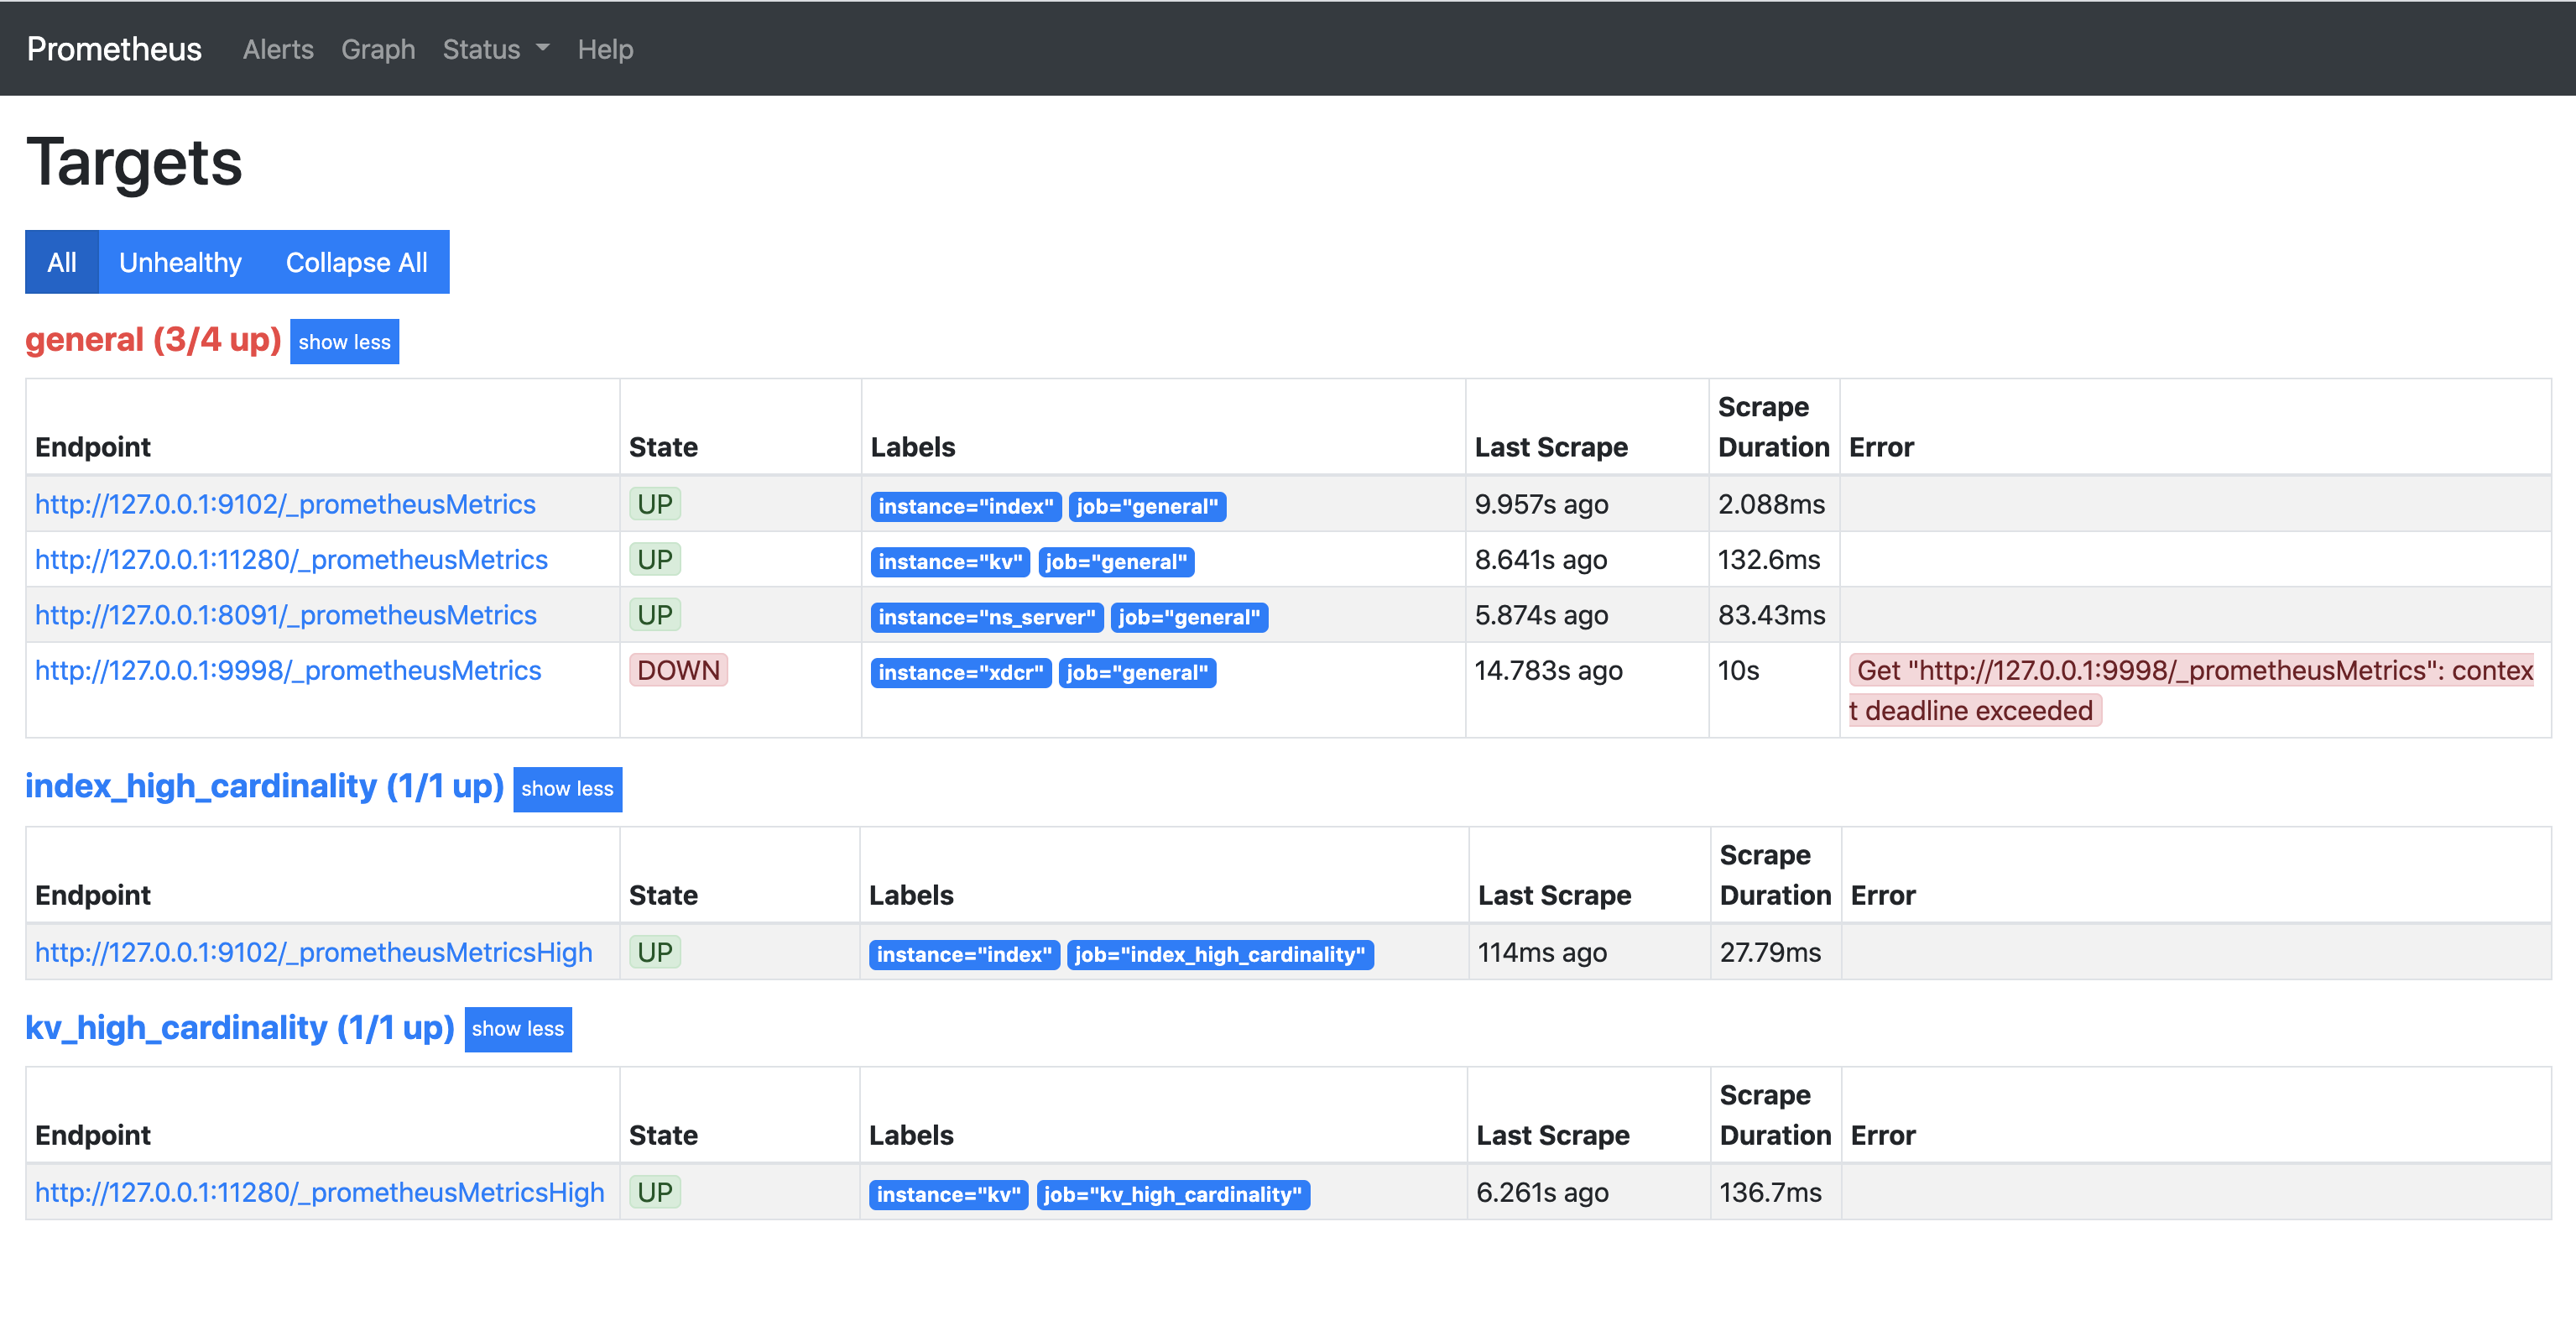
1. XDCR on .74 node shows up as "No XDCR setup)
2. _prometheusMetrics endpoint on .74 node does not return any metrics and gets stuck when we call the endpoint. This can be seen on the targets page of Prometheus. (On other nodes the endpoint of xdcr metrics returns metrics appropriately)
See 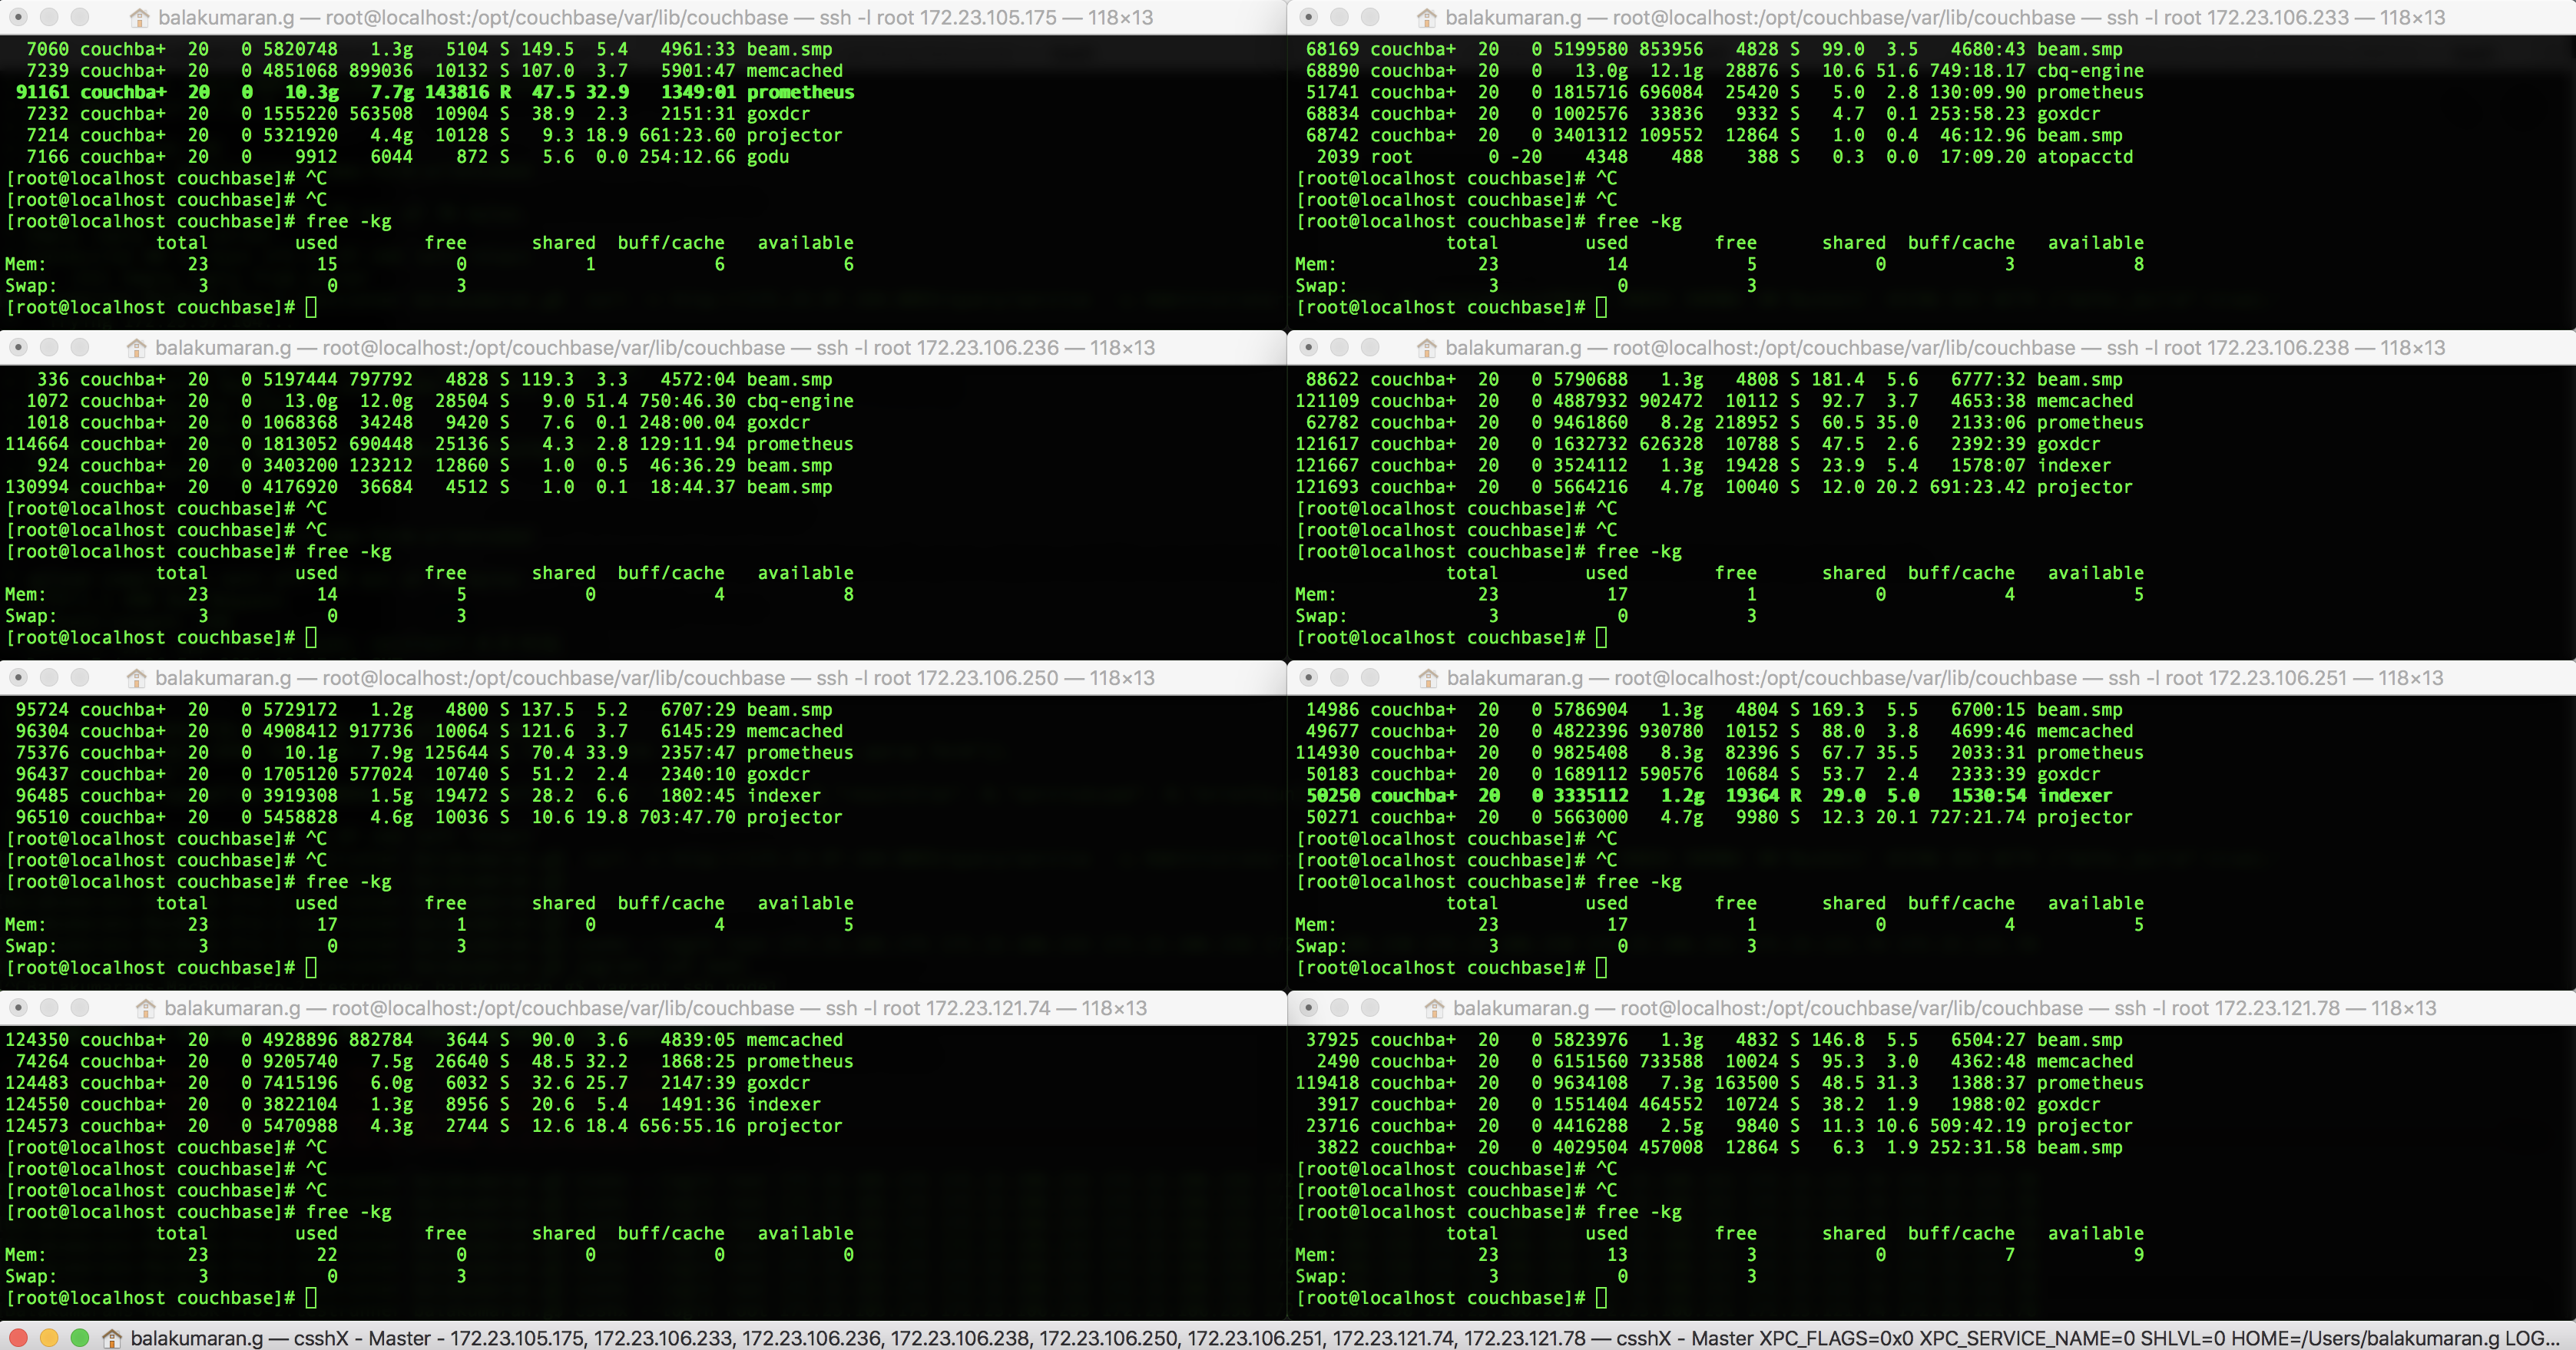 and
and 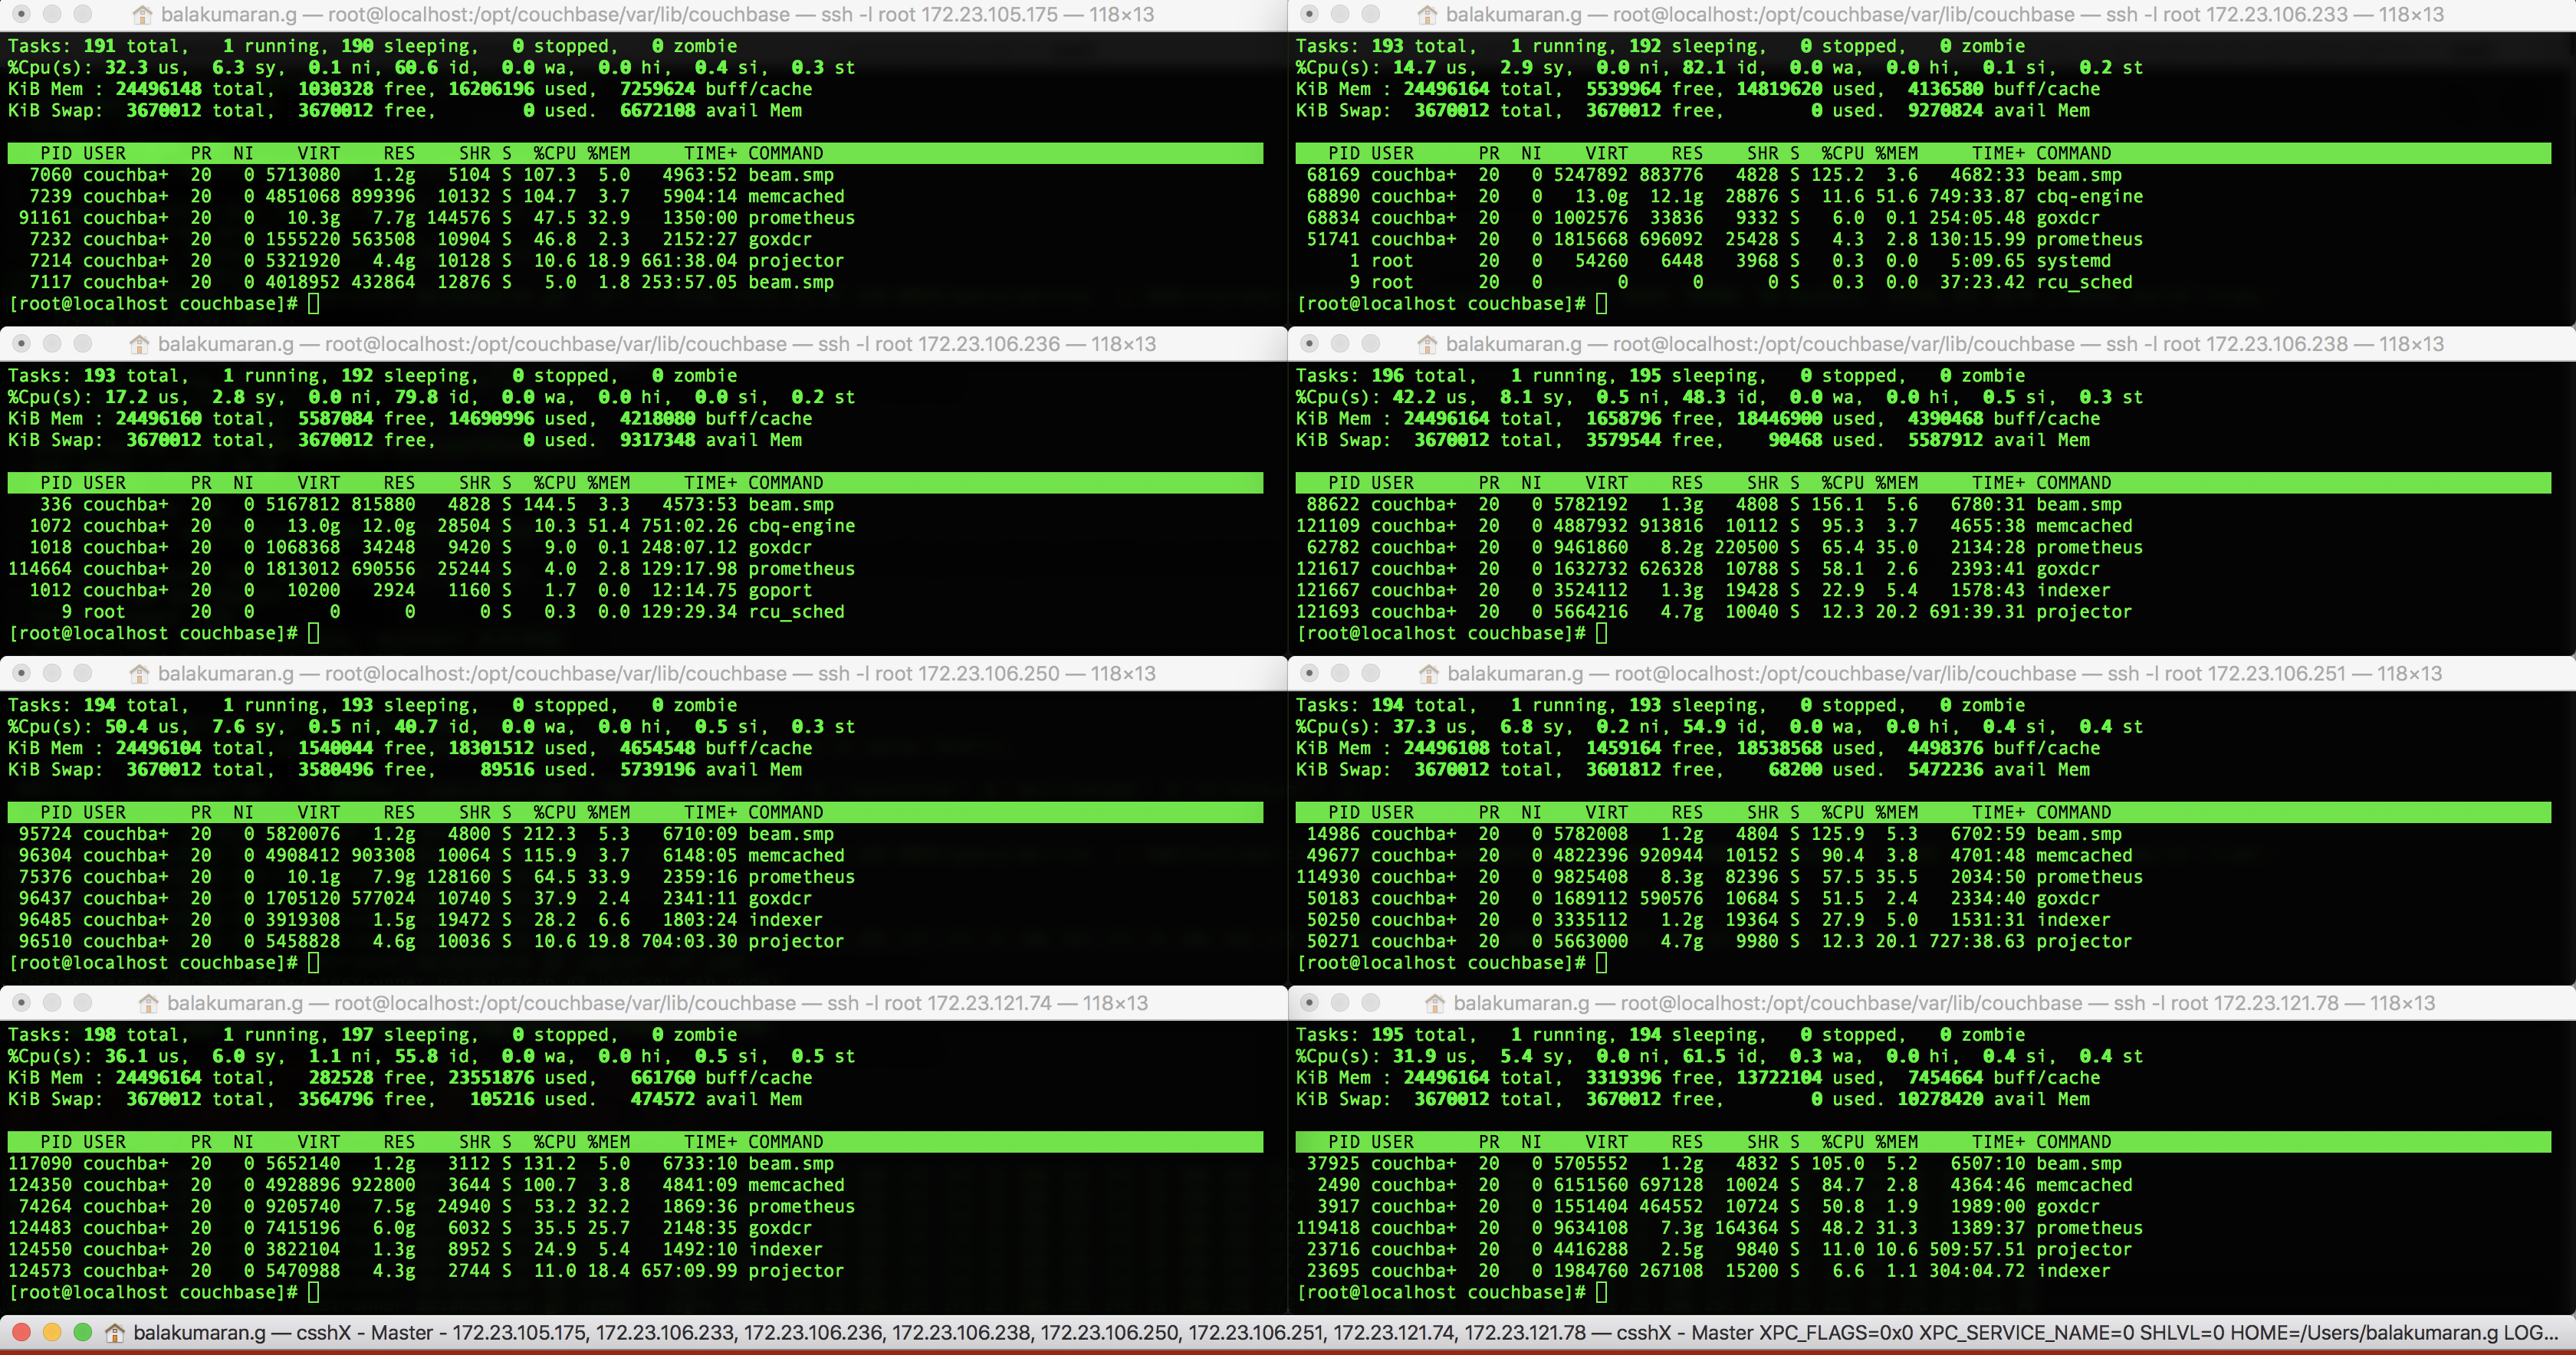 for RAM usage before resetting the prometheus settings.
Also noticed lot of REST calls where timing out on UI. See 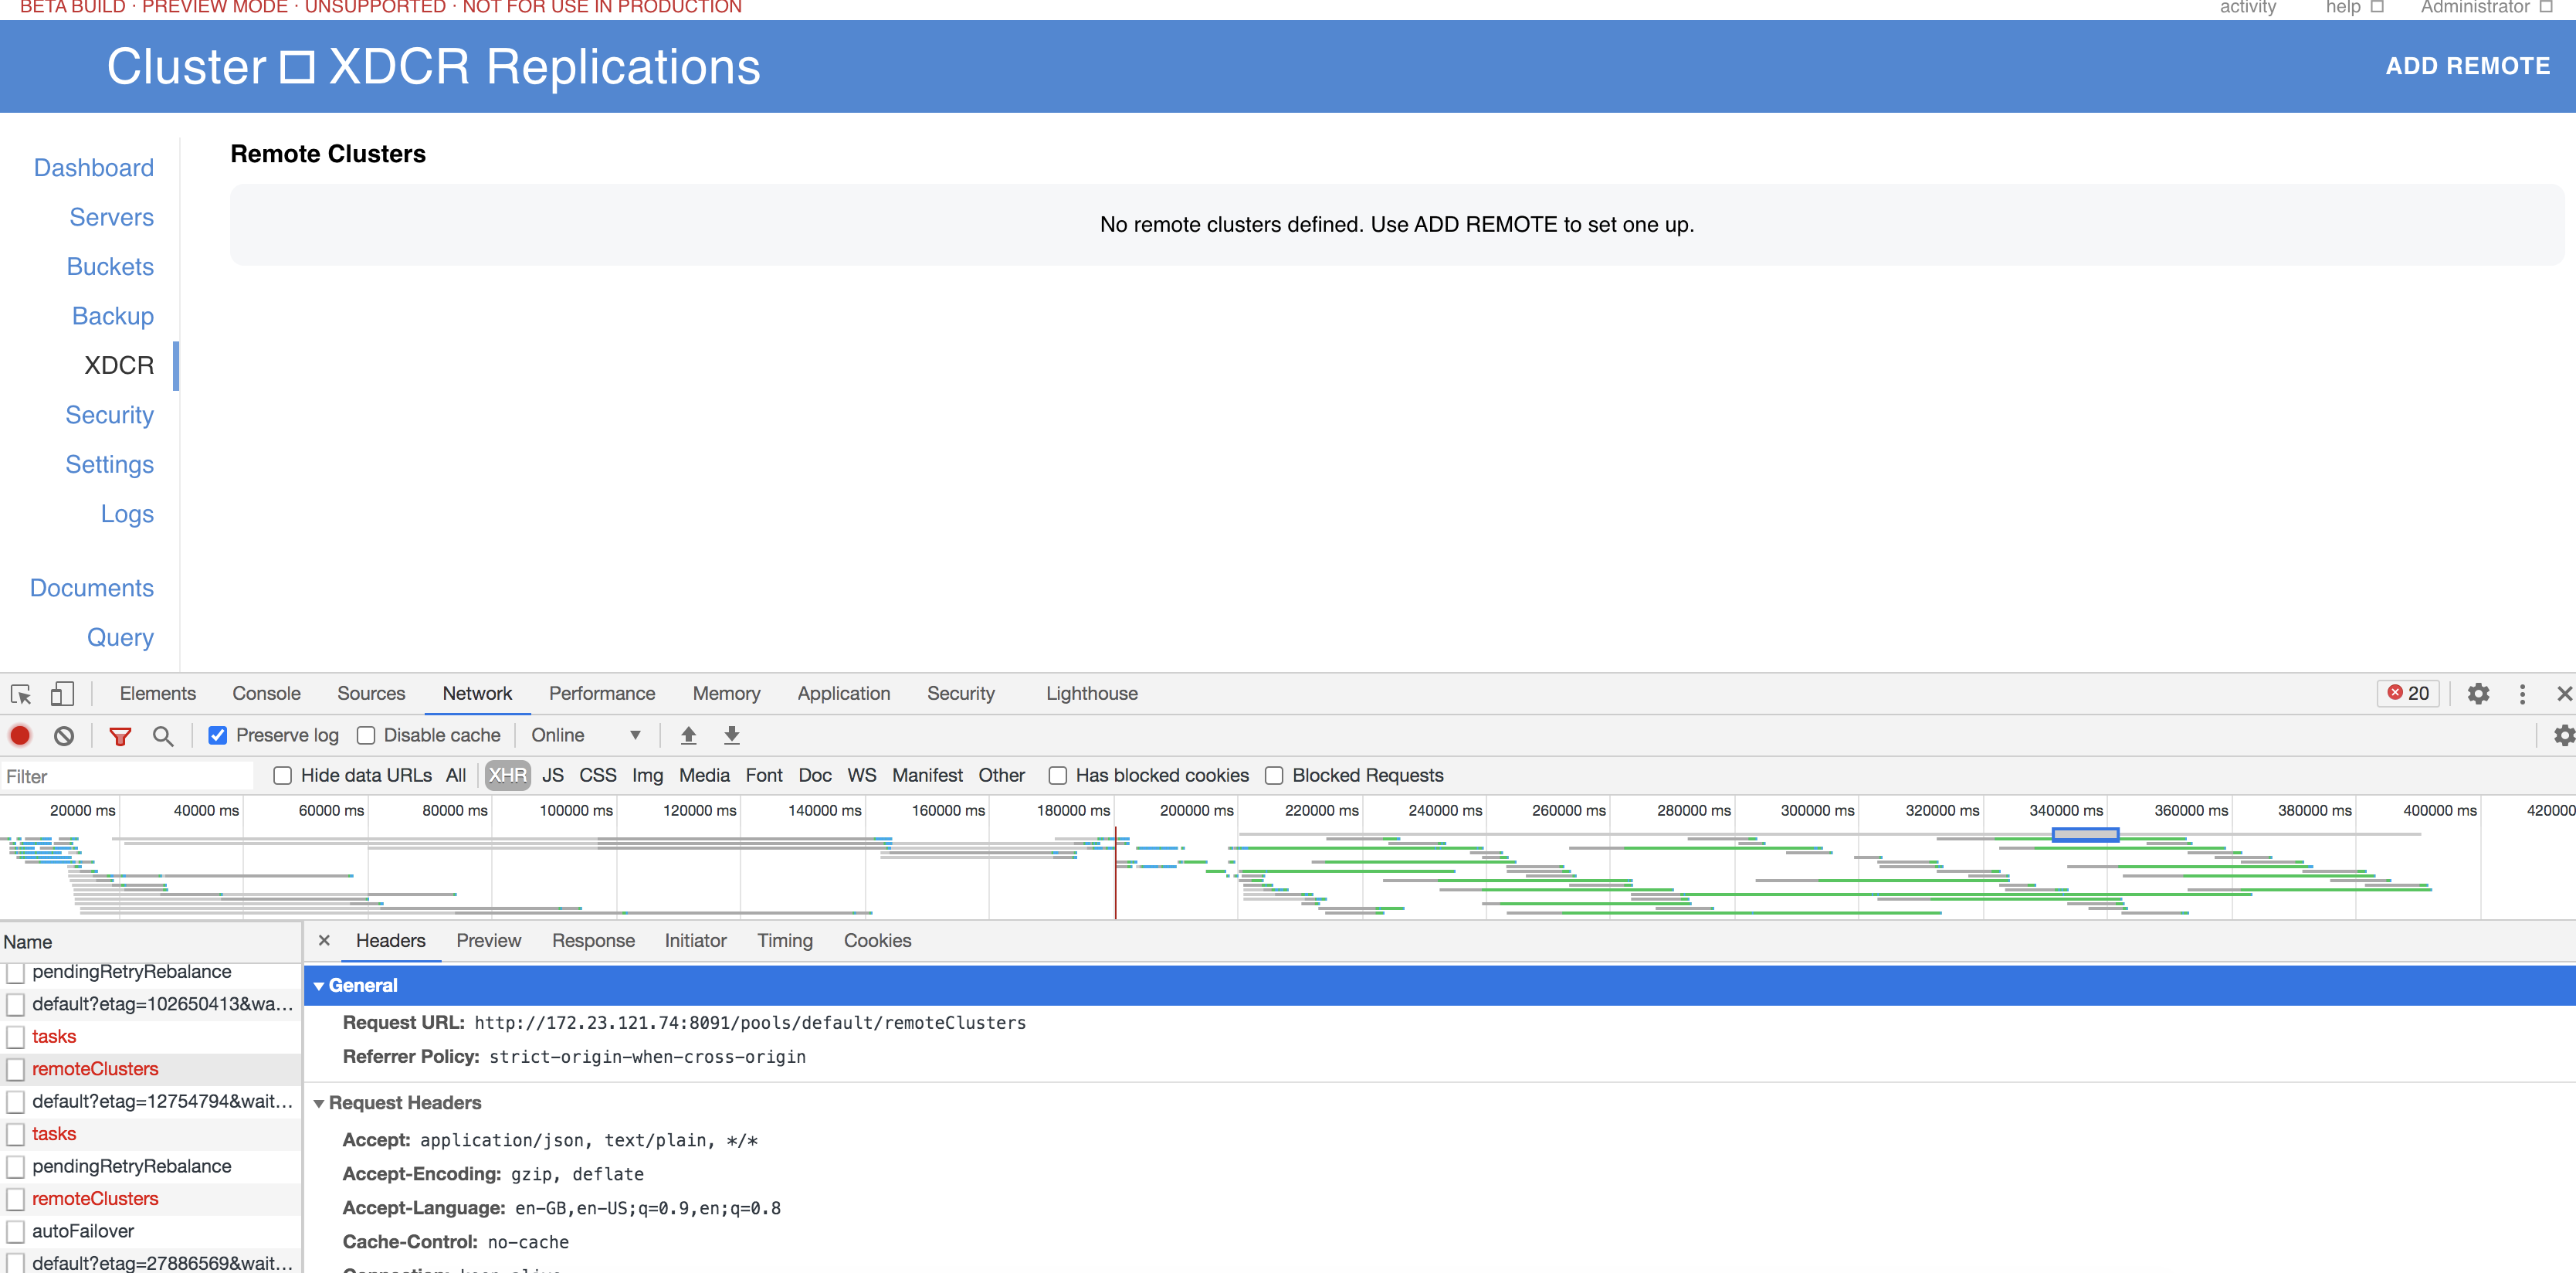 because of which XDCR replications were not visible on UI.
Also, here are the logs for when the scrape_interval was at 1s (ie; before it was increased back to 10s)
http://supportal.couchbase.com/snapshot/4114f3509fbd5226659d2bdc64c2c61a::3