Uploaded image for project: 'Couchbase Server'
  1. Couchbase Server
  2. MB-46467

PrometheusMetricsHigh endpoint of FTS has collection="%!s(MISSING)"

    XMLWordPrintable

Details

    • Bug
    • Resolution: Fixed
    • Major
    • 7.0.2
    • Cheshire-Cat
    • fts
    • CB EE 7.0.0-5219

    Description

      Summary:
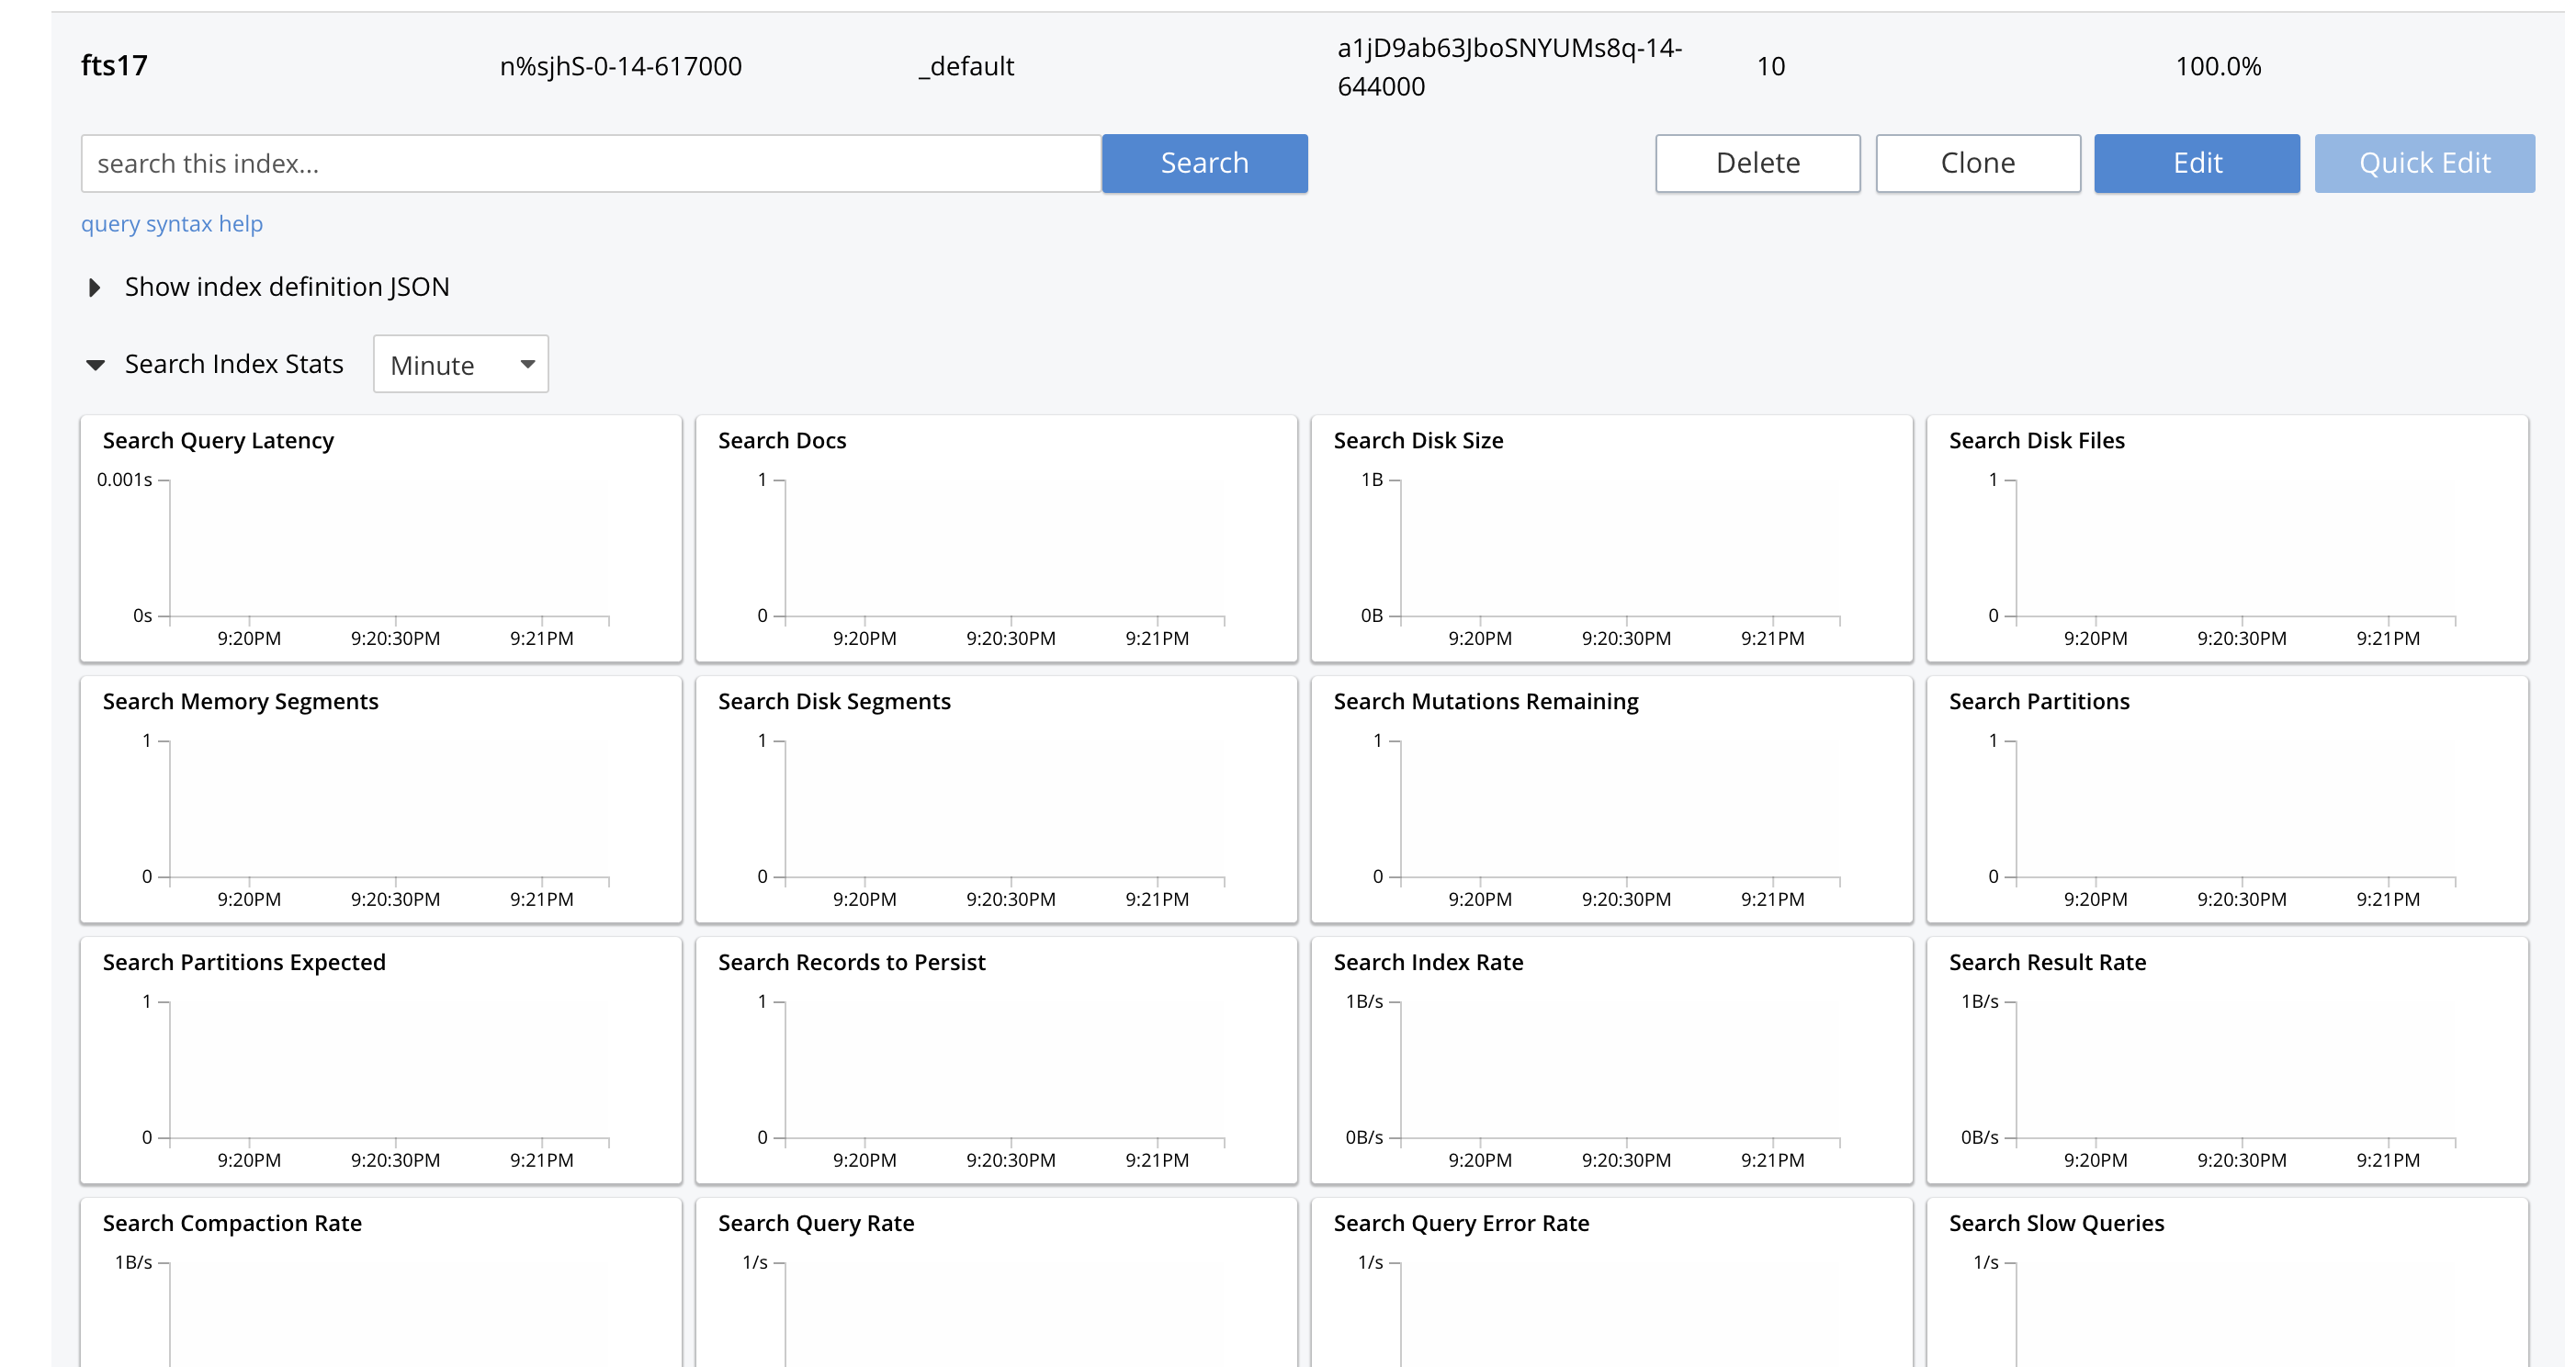
      Observed that FTS exporter of High Cardinality Metrics reports missing collection name for each metric. Refer the corresponding attachment from .58 node
      It looks like for example:

      fts_num_files_on_disk {bucket="n_defaultjhS-0-14-617000",scope="AJOtzLLTDF-14-639000",collection="%!s(MISSING)",index="fts13"} 4

      If I am not wrong, this is the reason why index specific stats go missing in the graphs for these metrics. Attaching the corresponding post range api request Ui makes and the response it gets (response values for the metrics are empty)

      Also, it looks like the bucket field's value(name) is also incorrect.
      Reported bucket name: n_defaultjhS-0-14-617000
      Actual bucket name: n%sjhS-0-14-617000

      Attachments

        1. missing_index_stats.png
          missing_index_stats.png
          273 kB
        2. prometheusMetricsHigh.txt
          97 kB
        3. servers.png
          servers.png
          472 kB
        4. UI_range_api_request.txt
          4 kB
        5. UI_range_api_response.txt
          1 kB
        No reviews matched the request. Check your Options in the drop-down menu of this sections header.

        Activity

          People

            evgeny.makarenko Evgeny Makarenko (Inactive)
            sumedh.basarkod Sumedh Basarkod (Inactive)
            Votes:
            0 Vote for this issue
            Watchers:
            6 Start watching this issue

            Dates

              Created:
              Updated:
              Resolved:

              Gerrit Reviews

                There are no open Gerrit changes

                PagerDuty