Details
-
Bug
-
Resolution: Not a Bug
-
 Major
Major
-
7.0.0
-
Enterprise Edition 7.0.0 build 13157
-
Untriaged
-
Centos 64-bit
-
-
1
-
Unknown
Description
Infra –
| Remote KV cluster: |
| Number of nodes – 20 |
| RAM allocated to KV per Node – 22.2 GB |
| Disk allocated per node – 25 GB |
| Number of buckets – 1 |
| Number of scopes/bucket – 1 |
| Number of collections/scope – 1 |
| Number of items – 130,259,631 |
| Total size of the data – 77 GB |
| Local CBAS cluster: |
| Number of nodes – 4 |
| RAM allocated to CBAS per Node – 223 GB |
| Disk allocated per node – 10 TB |
Test Setup-
| Number of dataverses – 10 |
| Number of Remote links – 25 |
| Number of datasets – 200 (8 dataset per link) |
Observations –
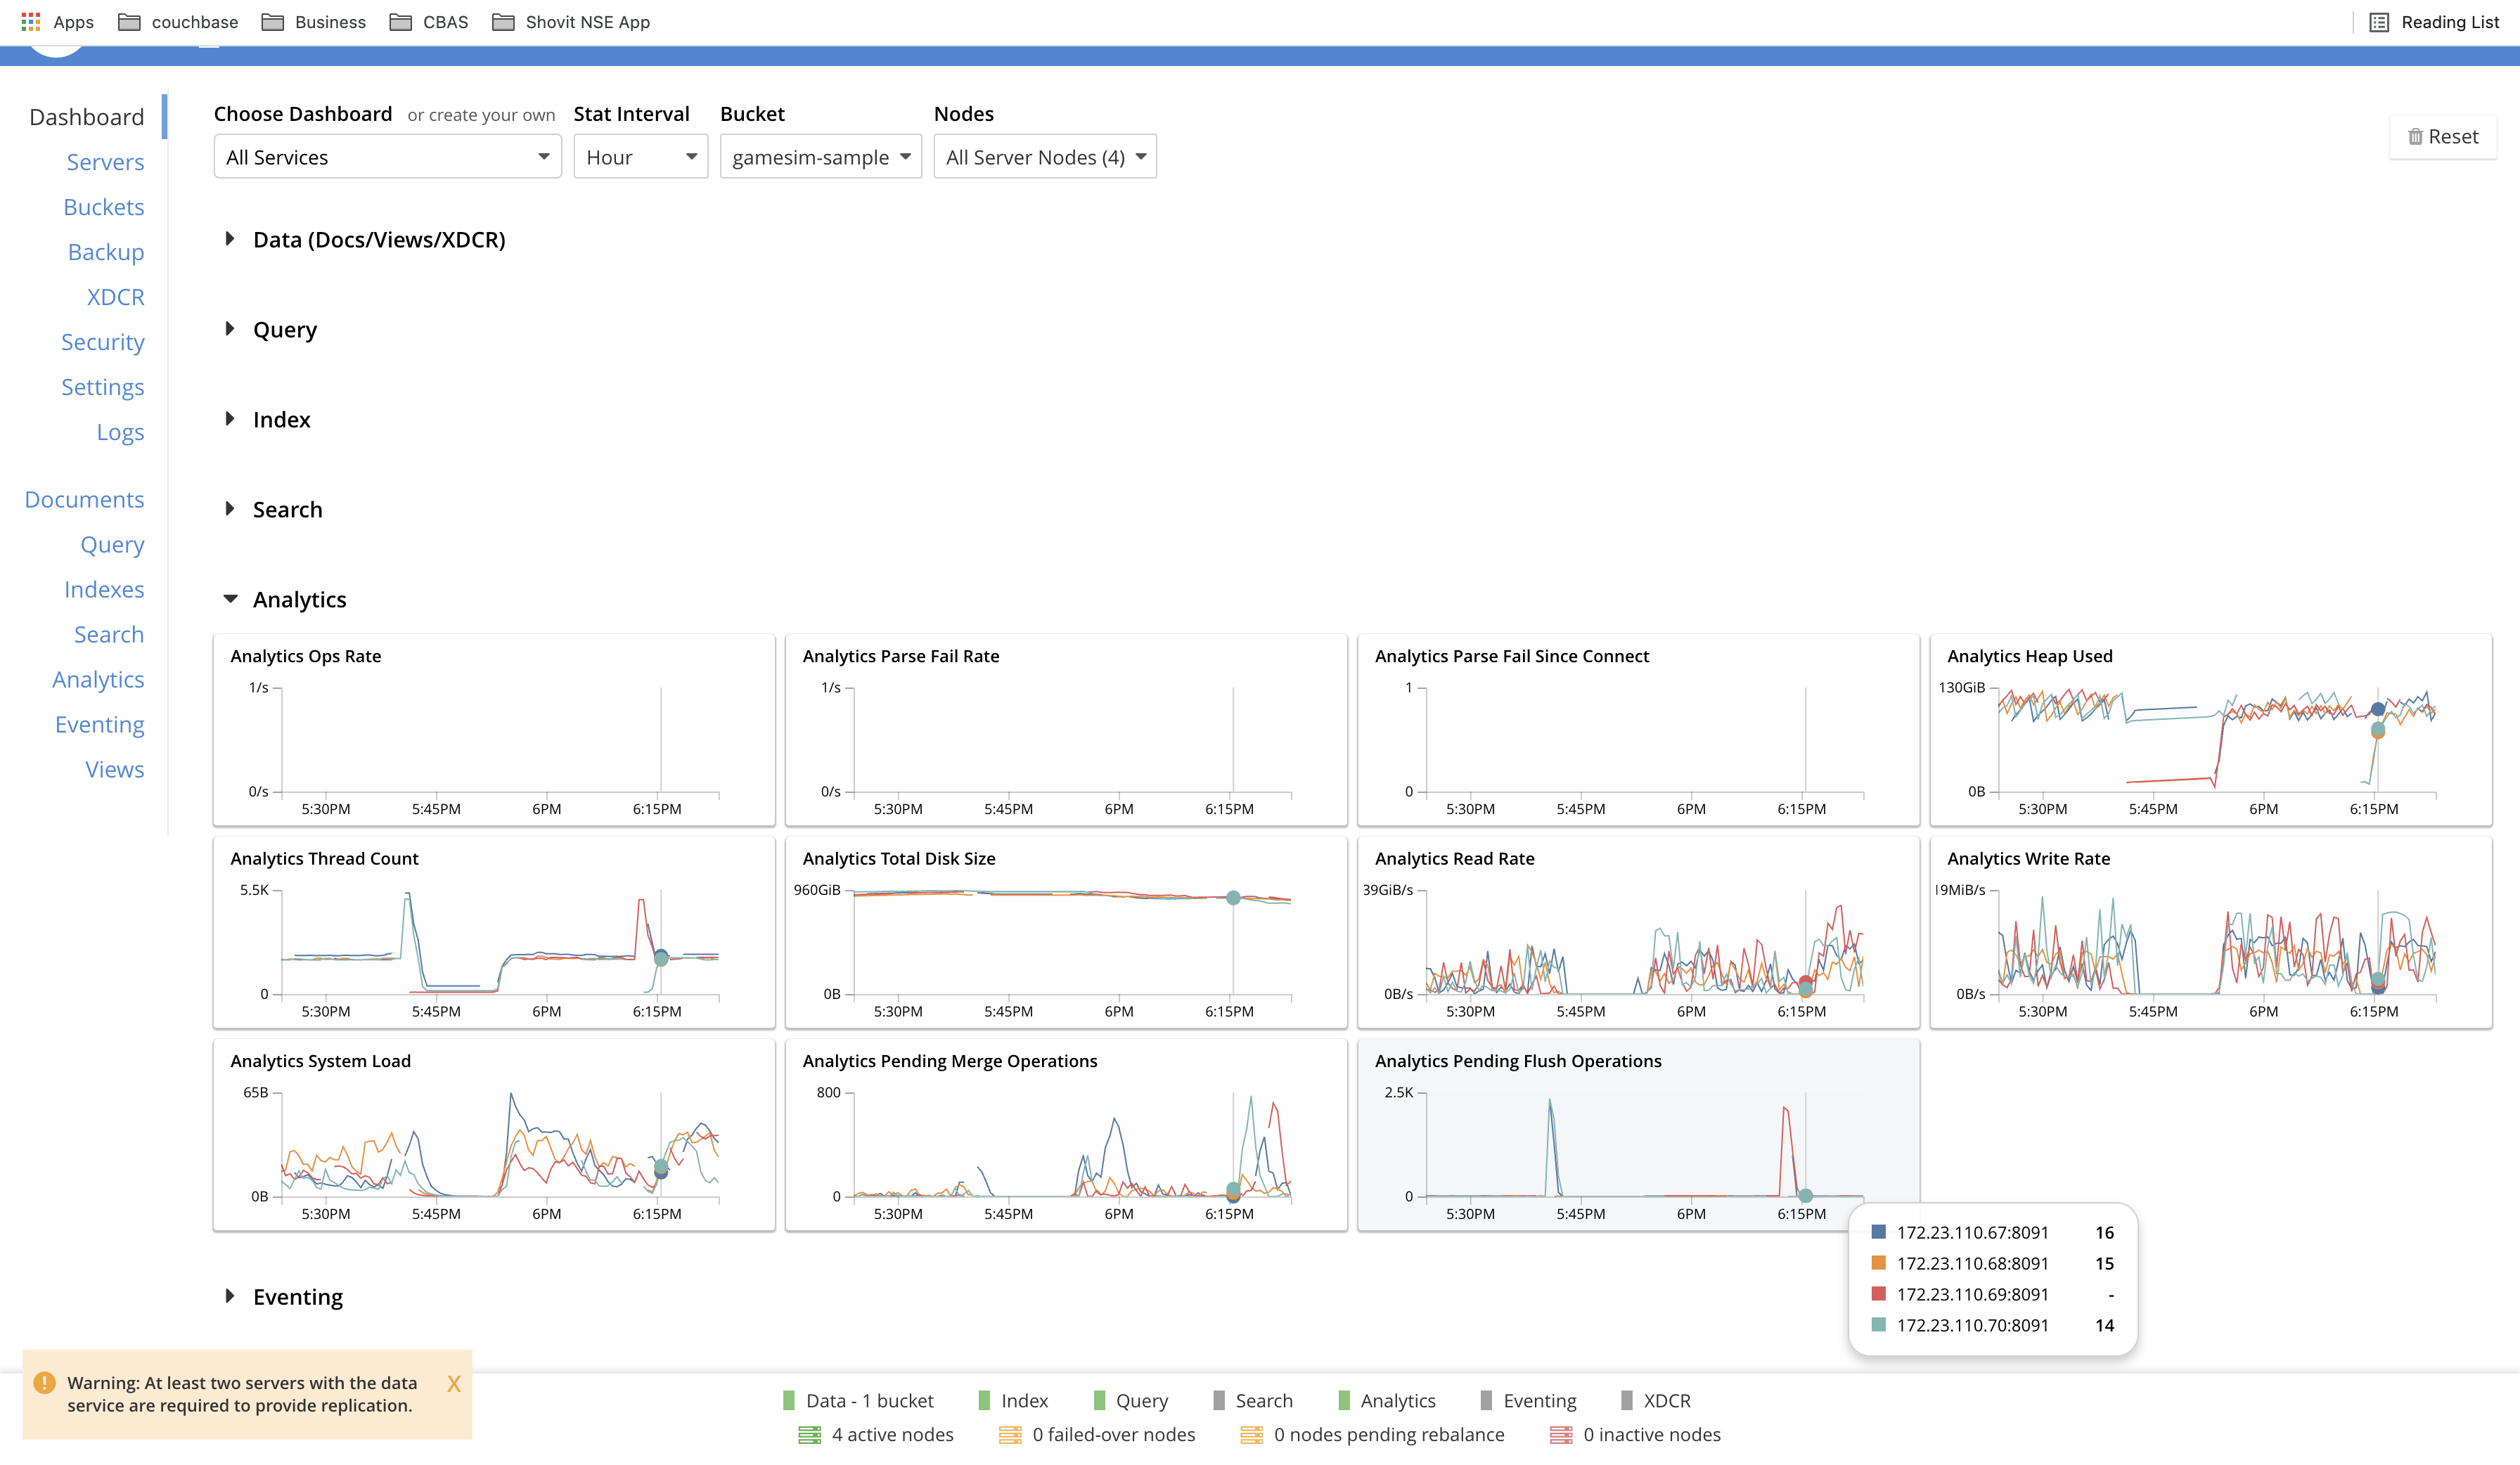
On Dashboard Page, select all services and all nodes.
|
|
|
Image_1 - For "Analytics Write Rate" stat chart, on Y axis, the value is not properly displayed. Same happens for "Analytics Read Rate" also (though it is not visible in the image)
|
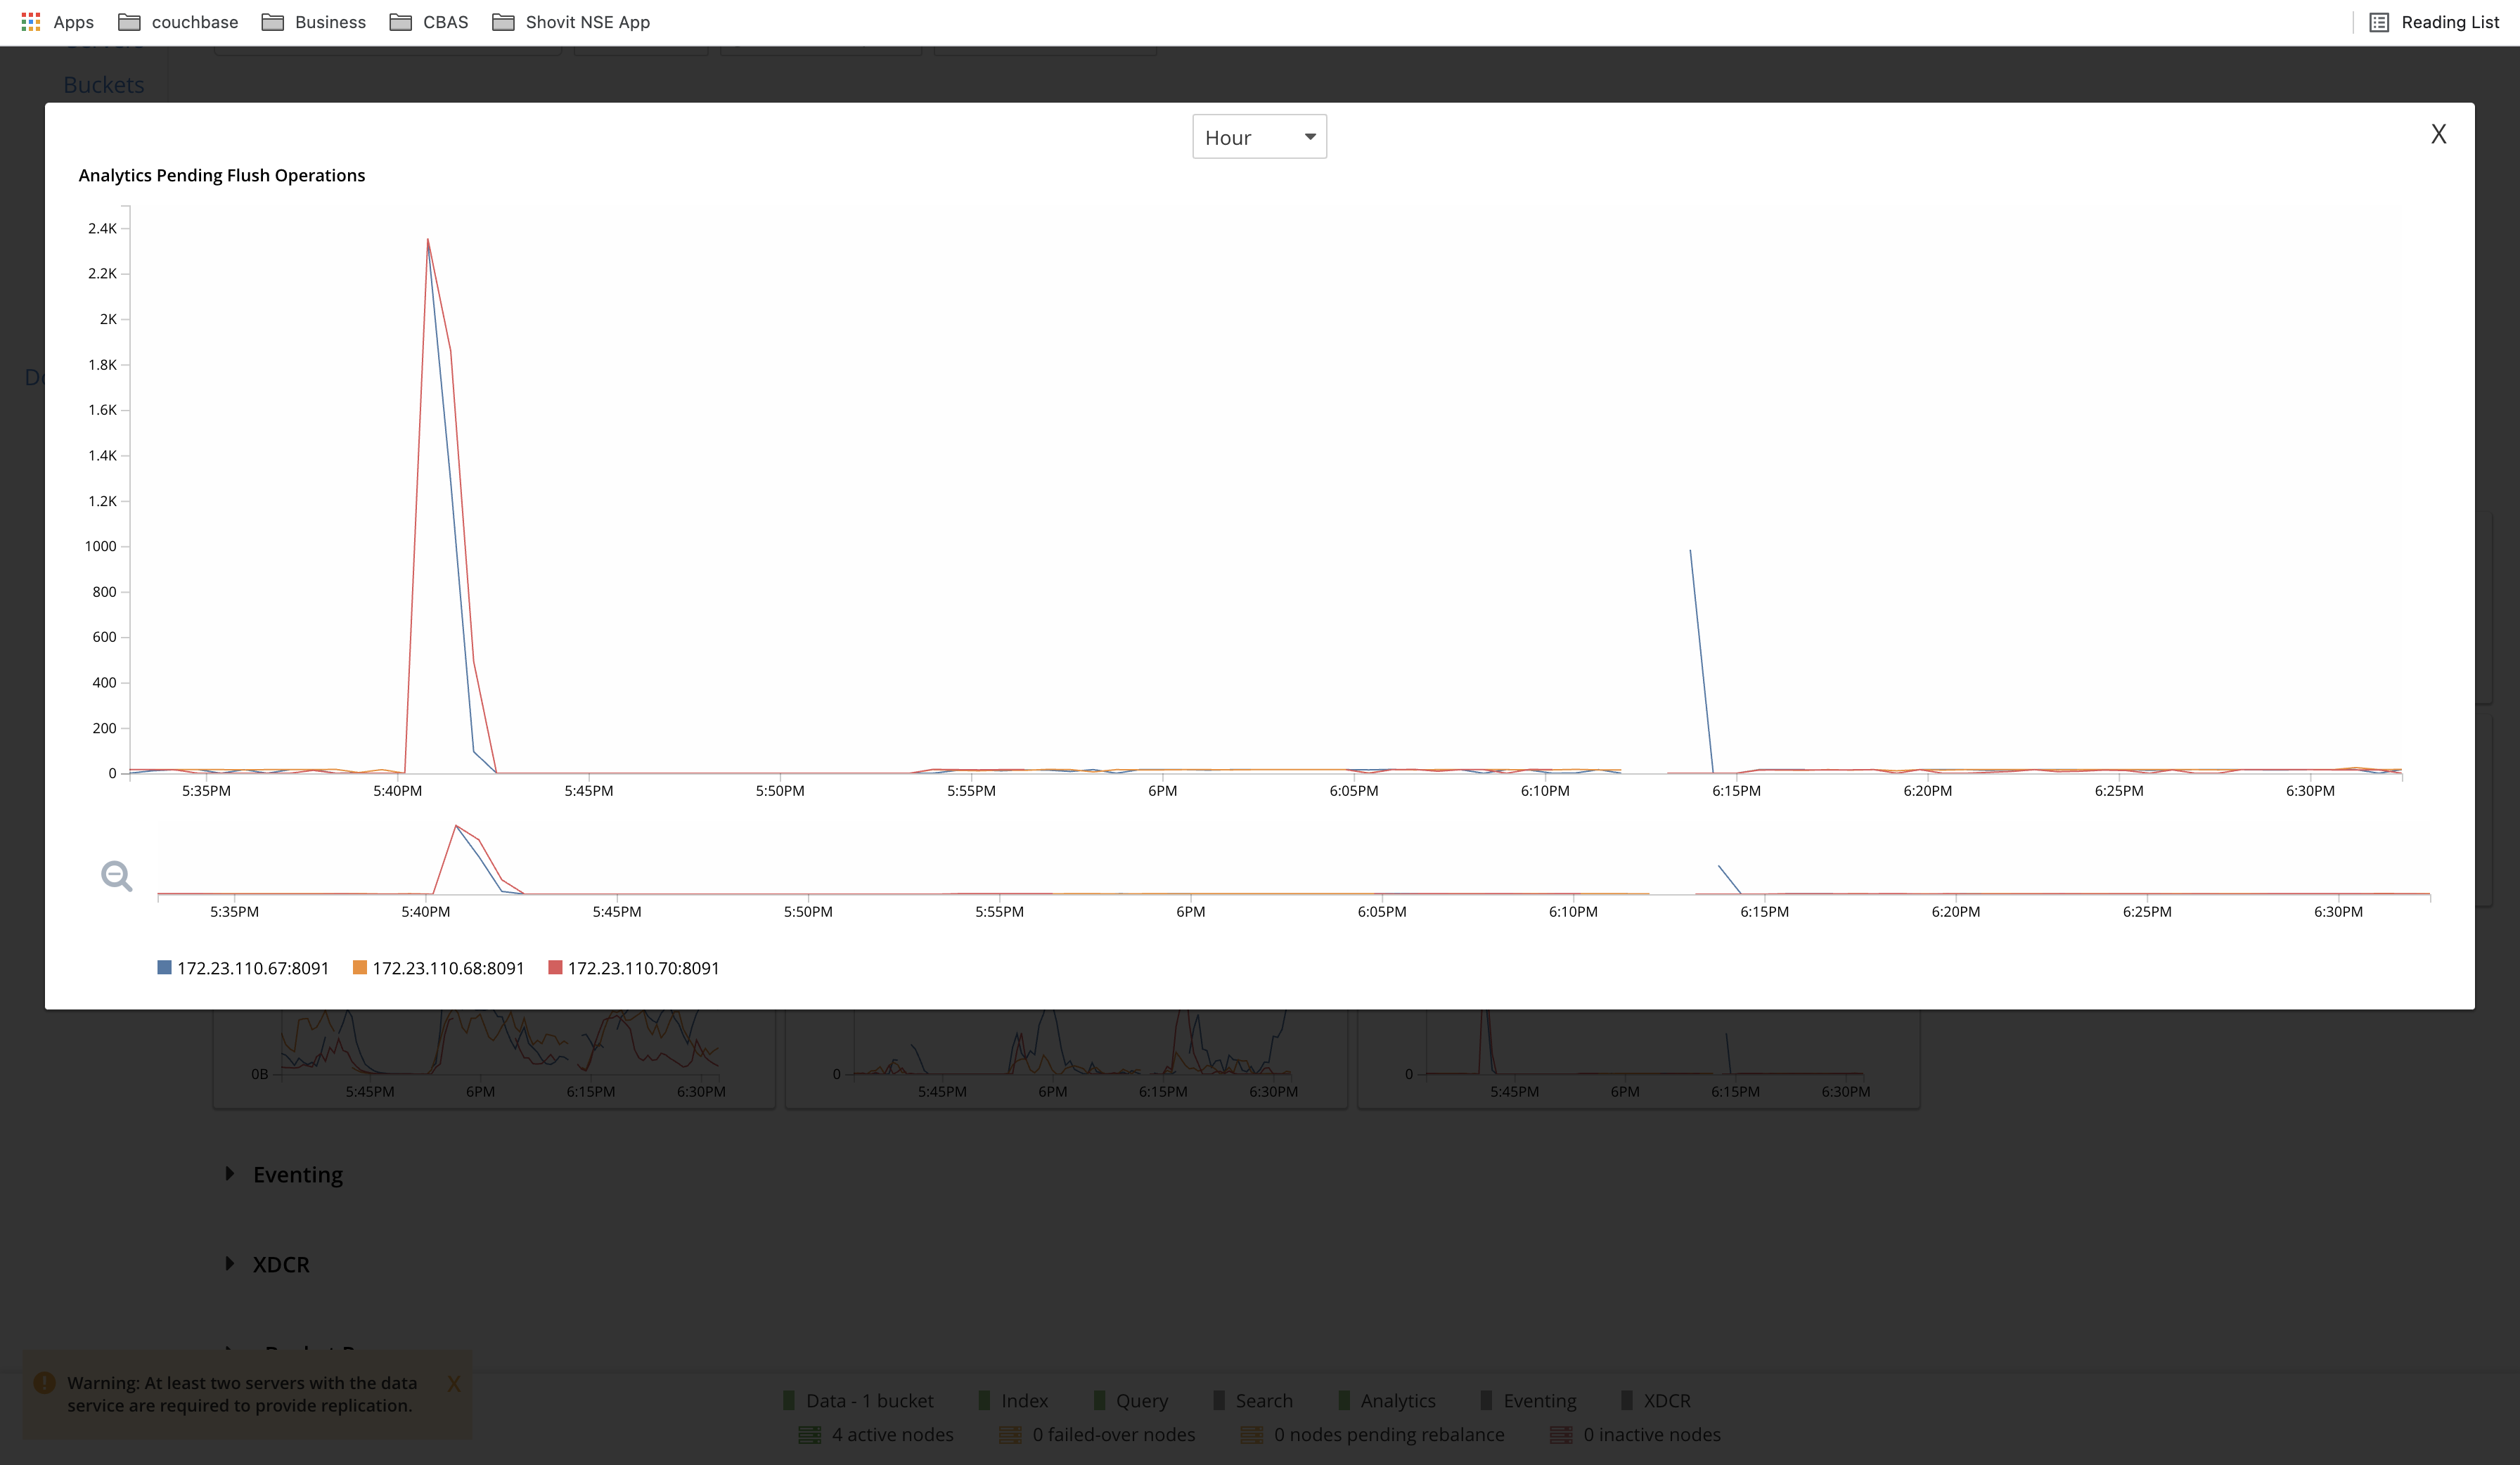
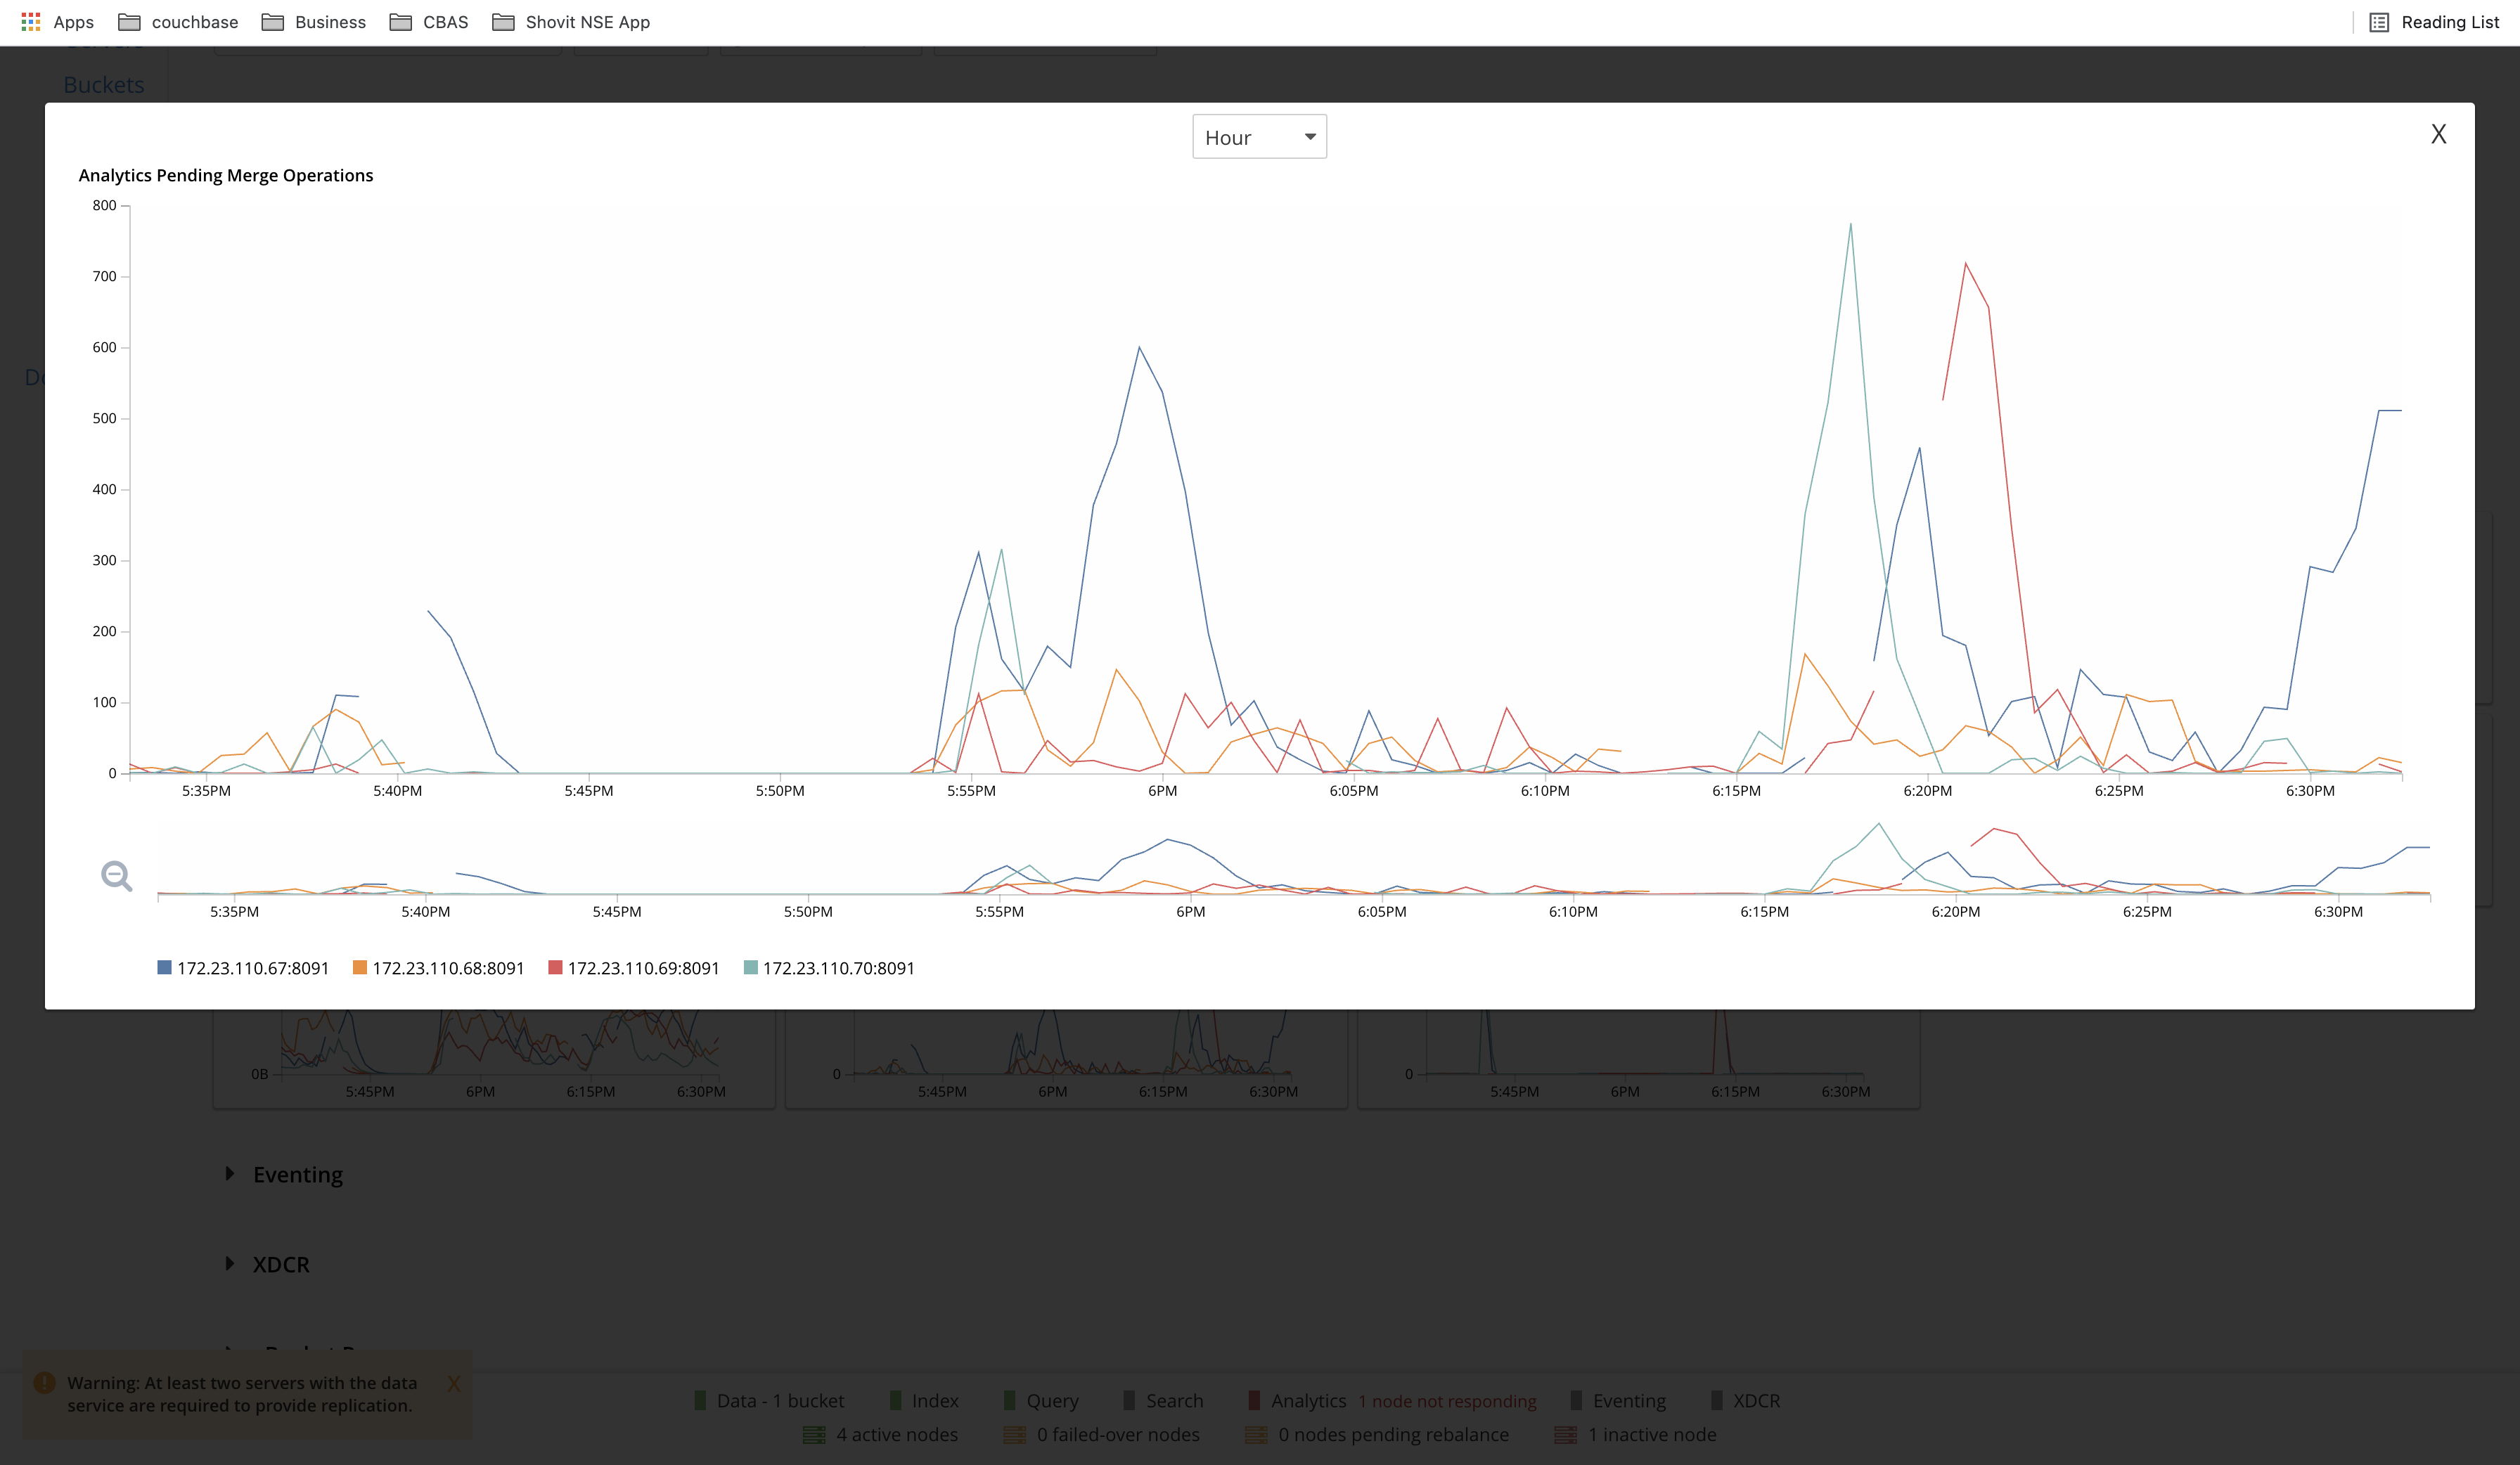
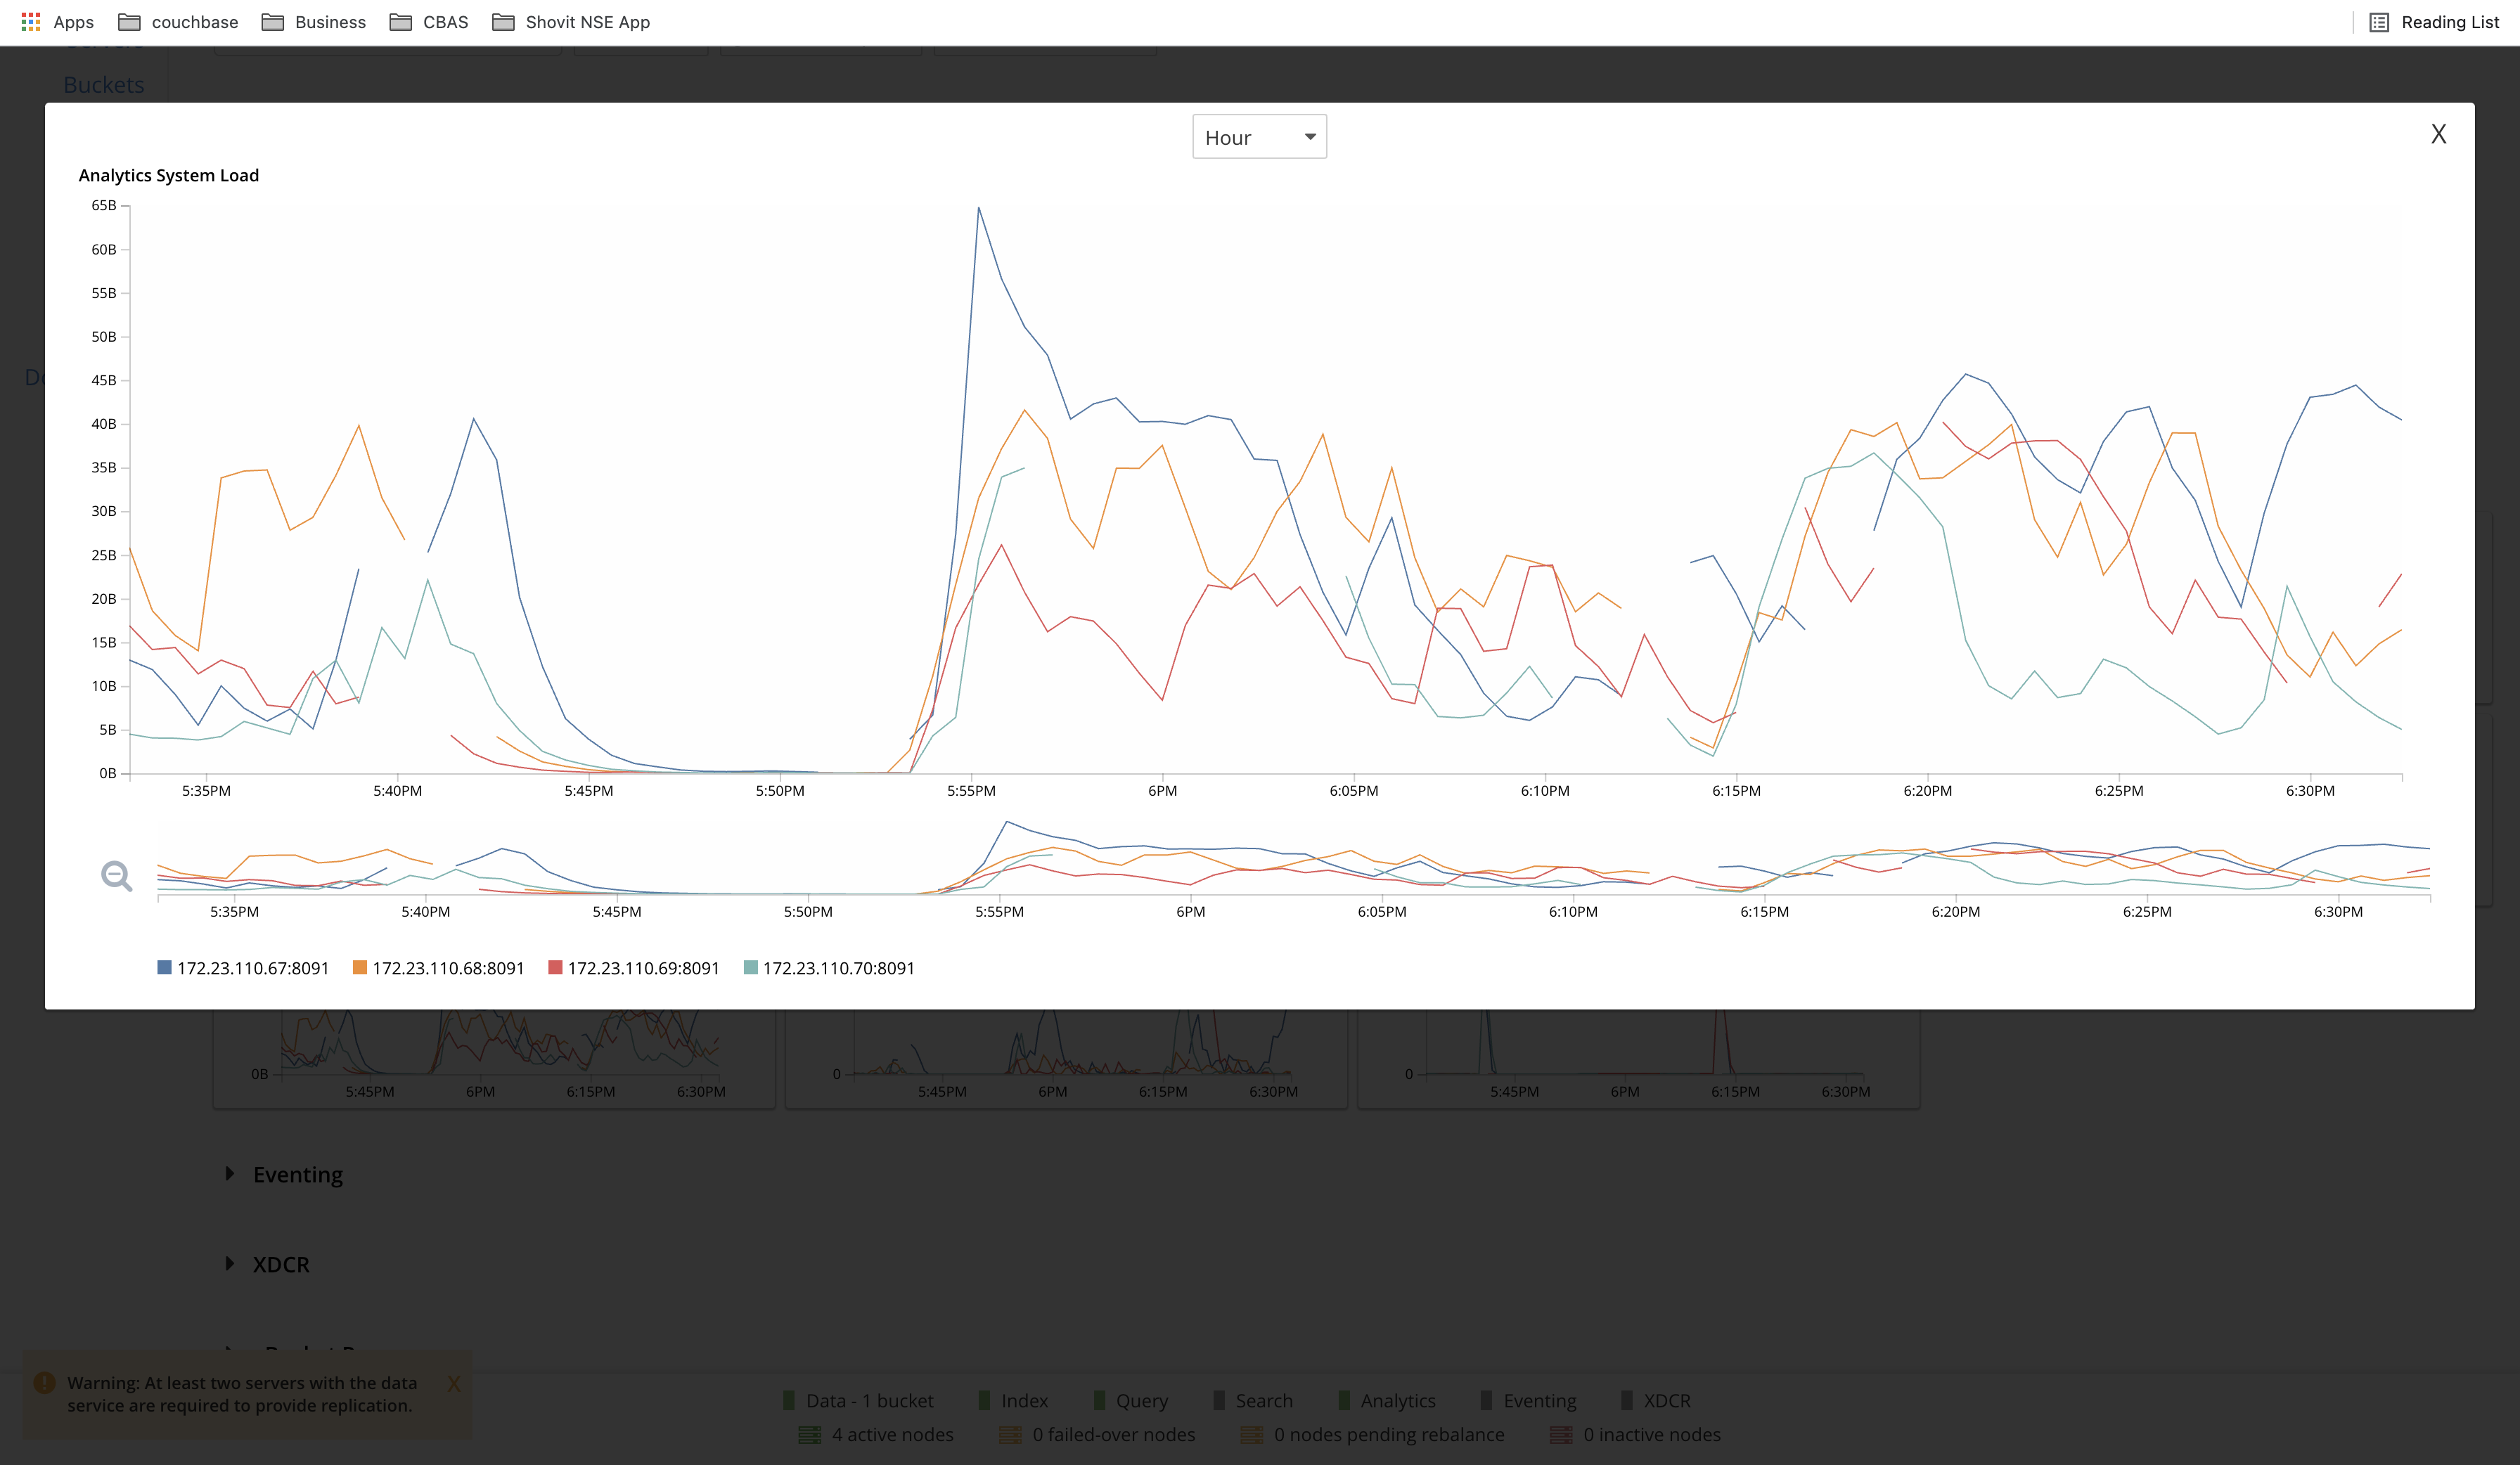
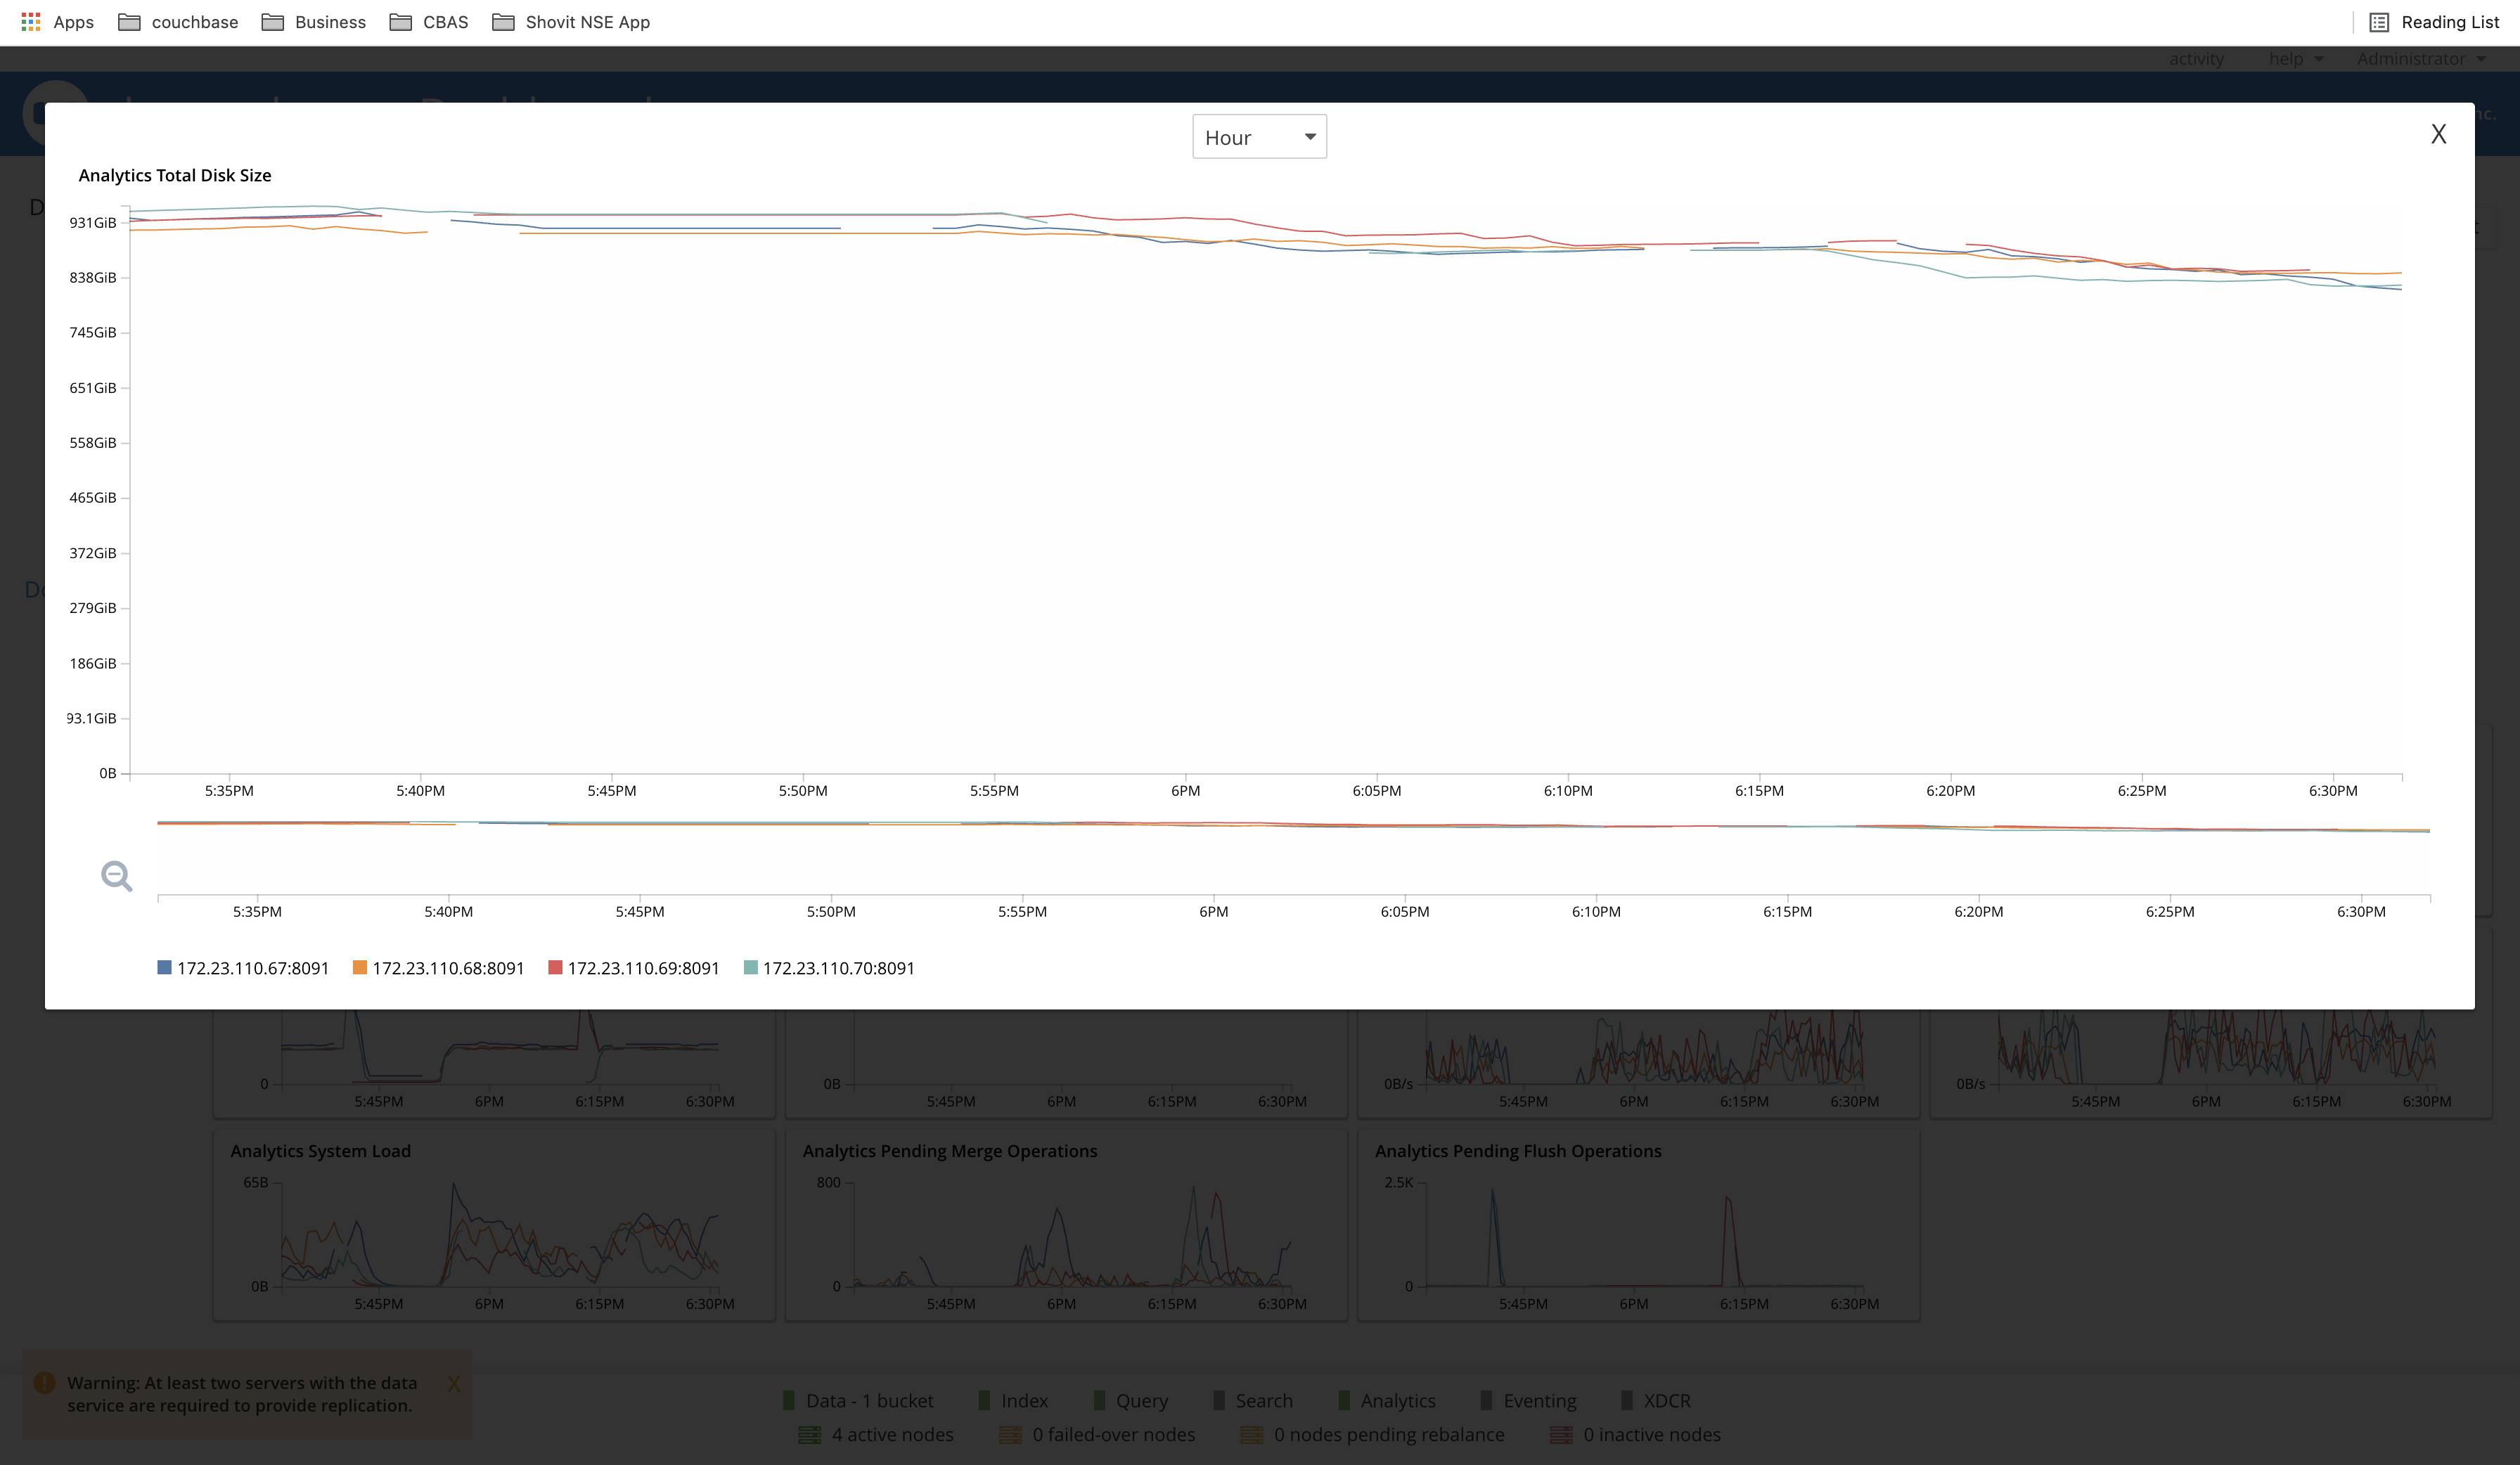
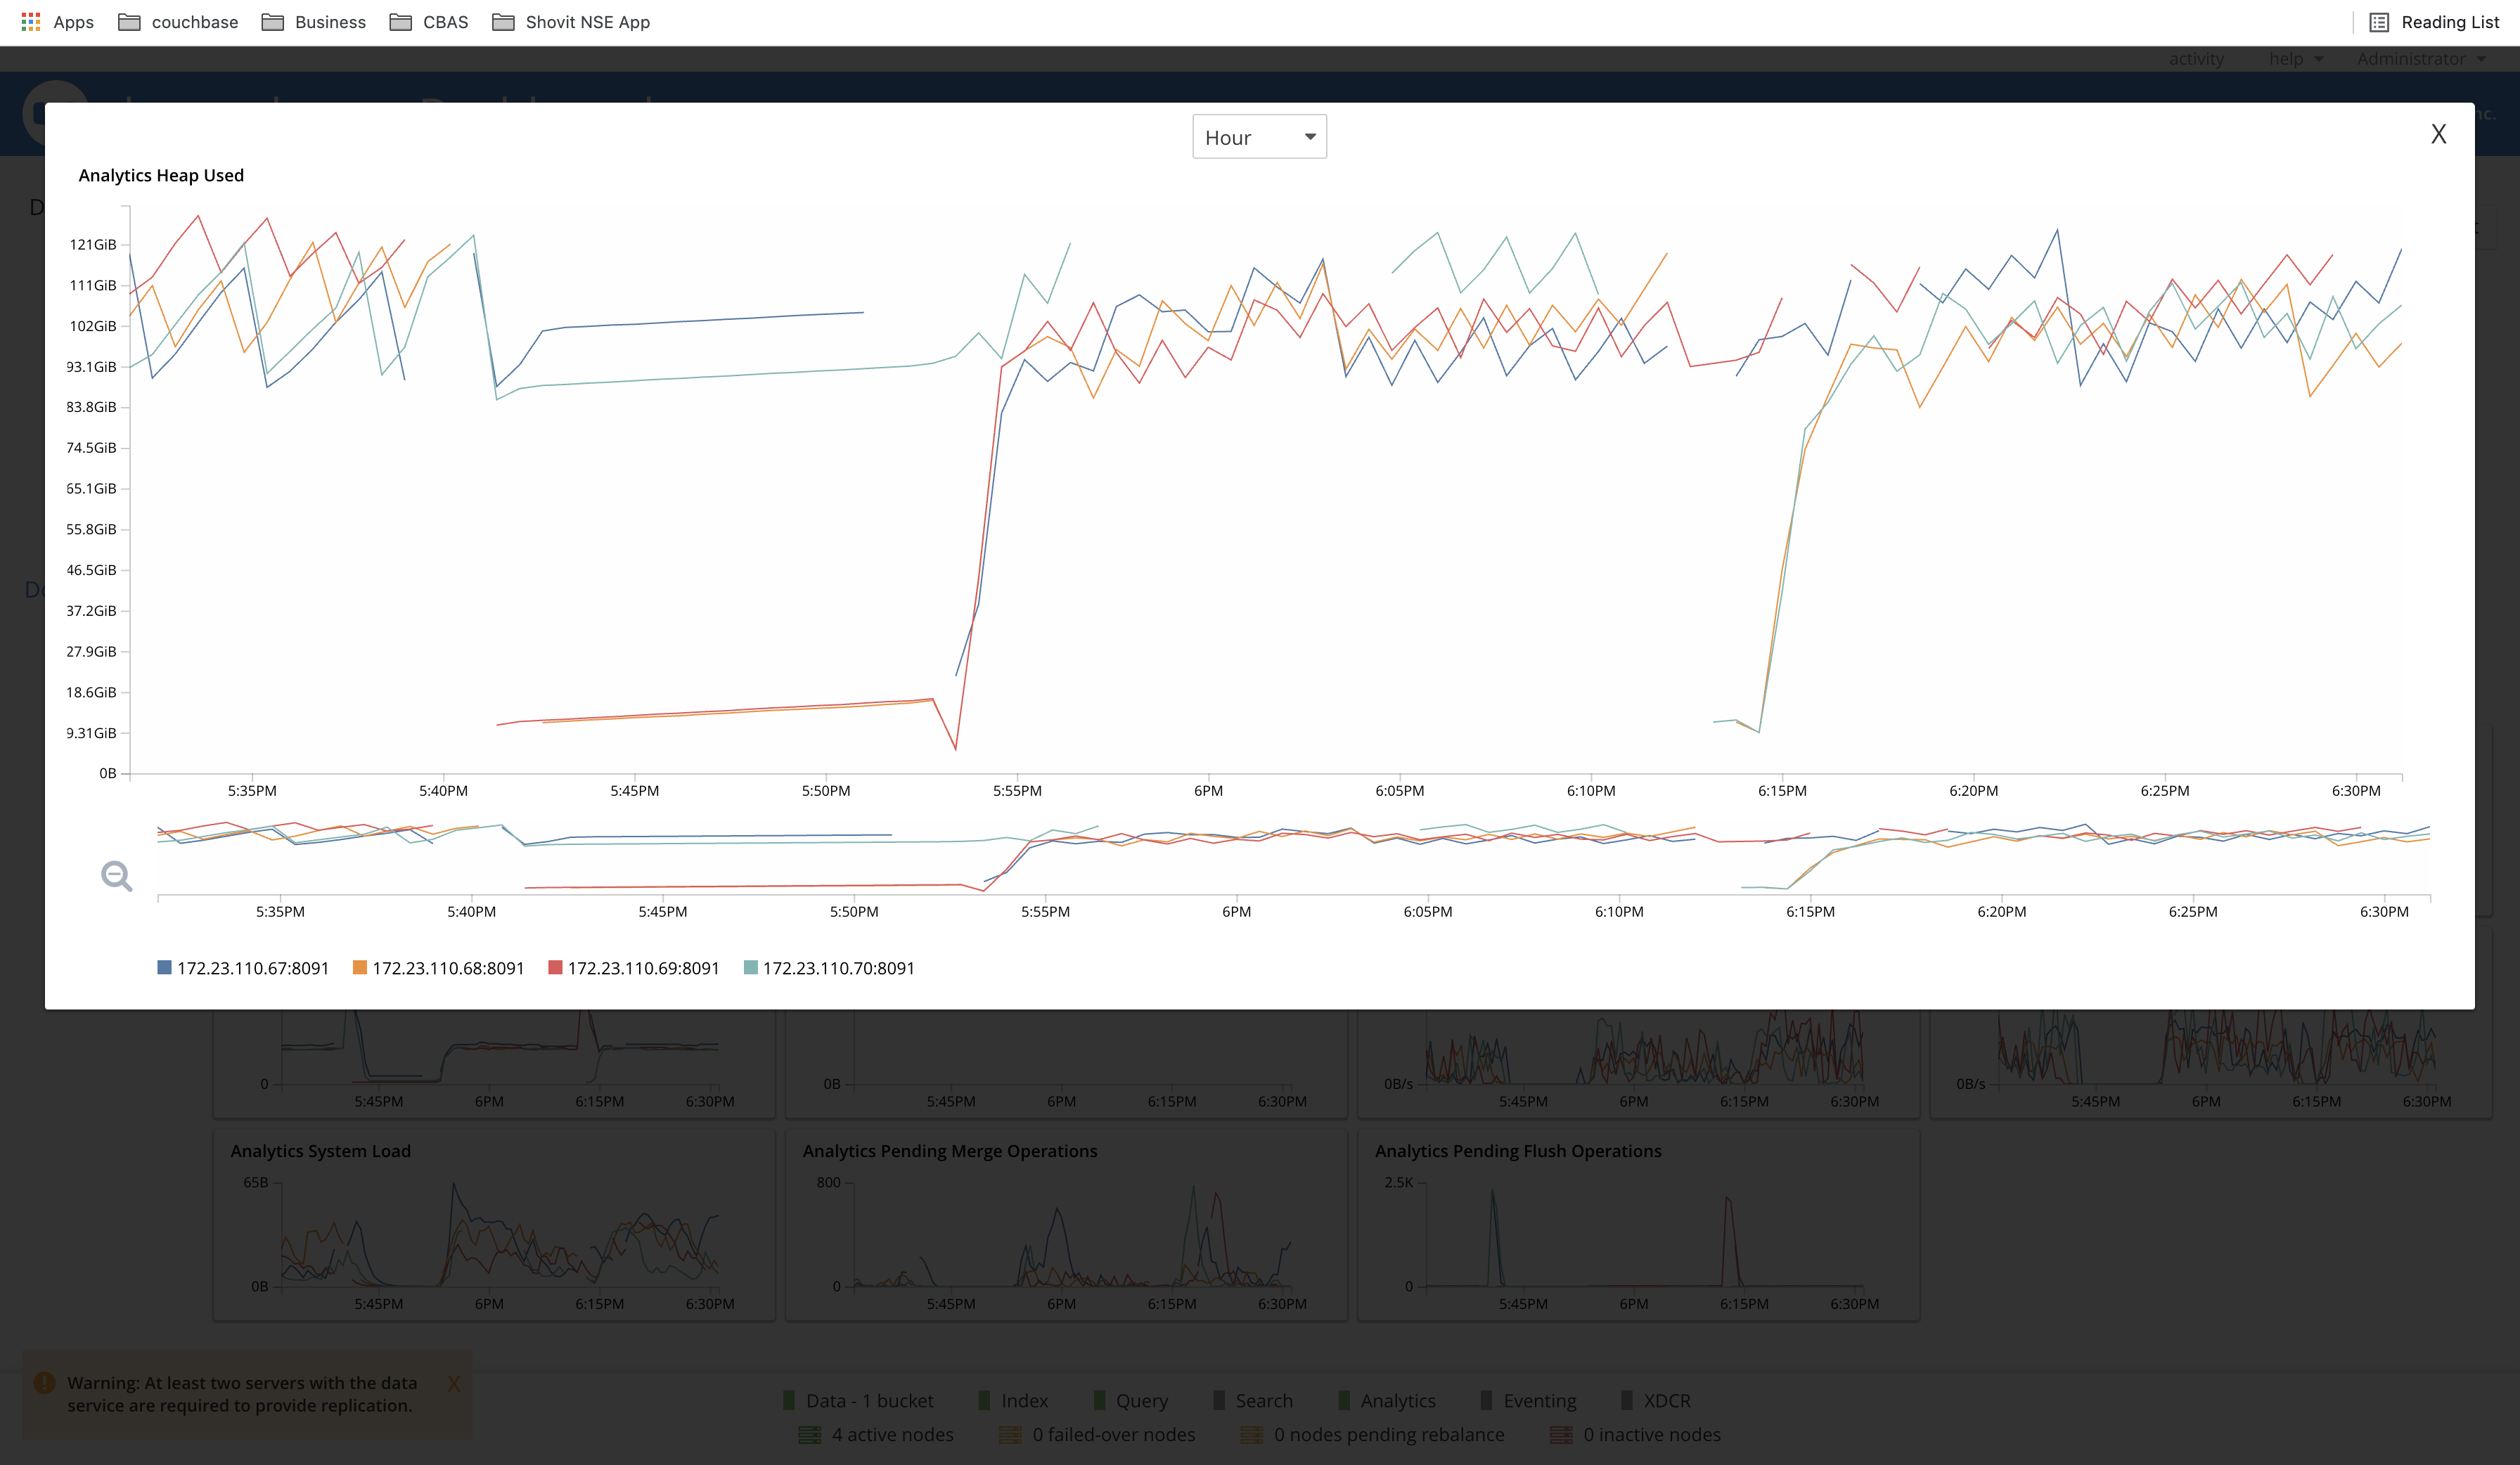
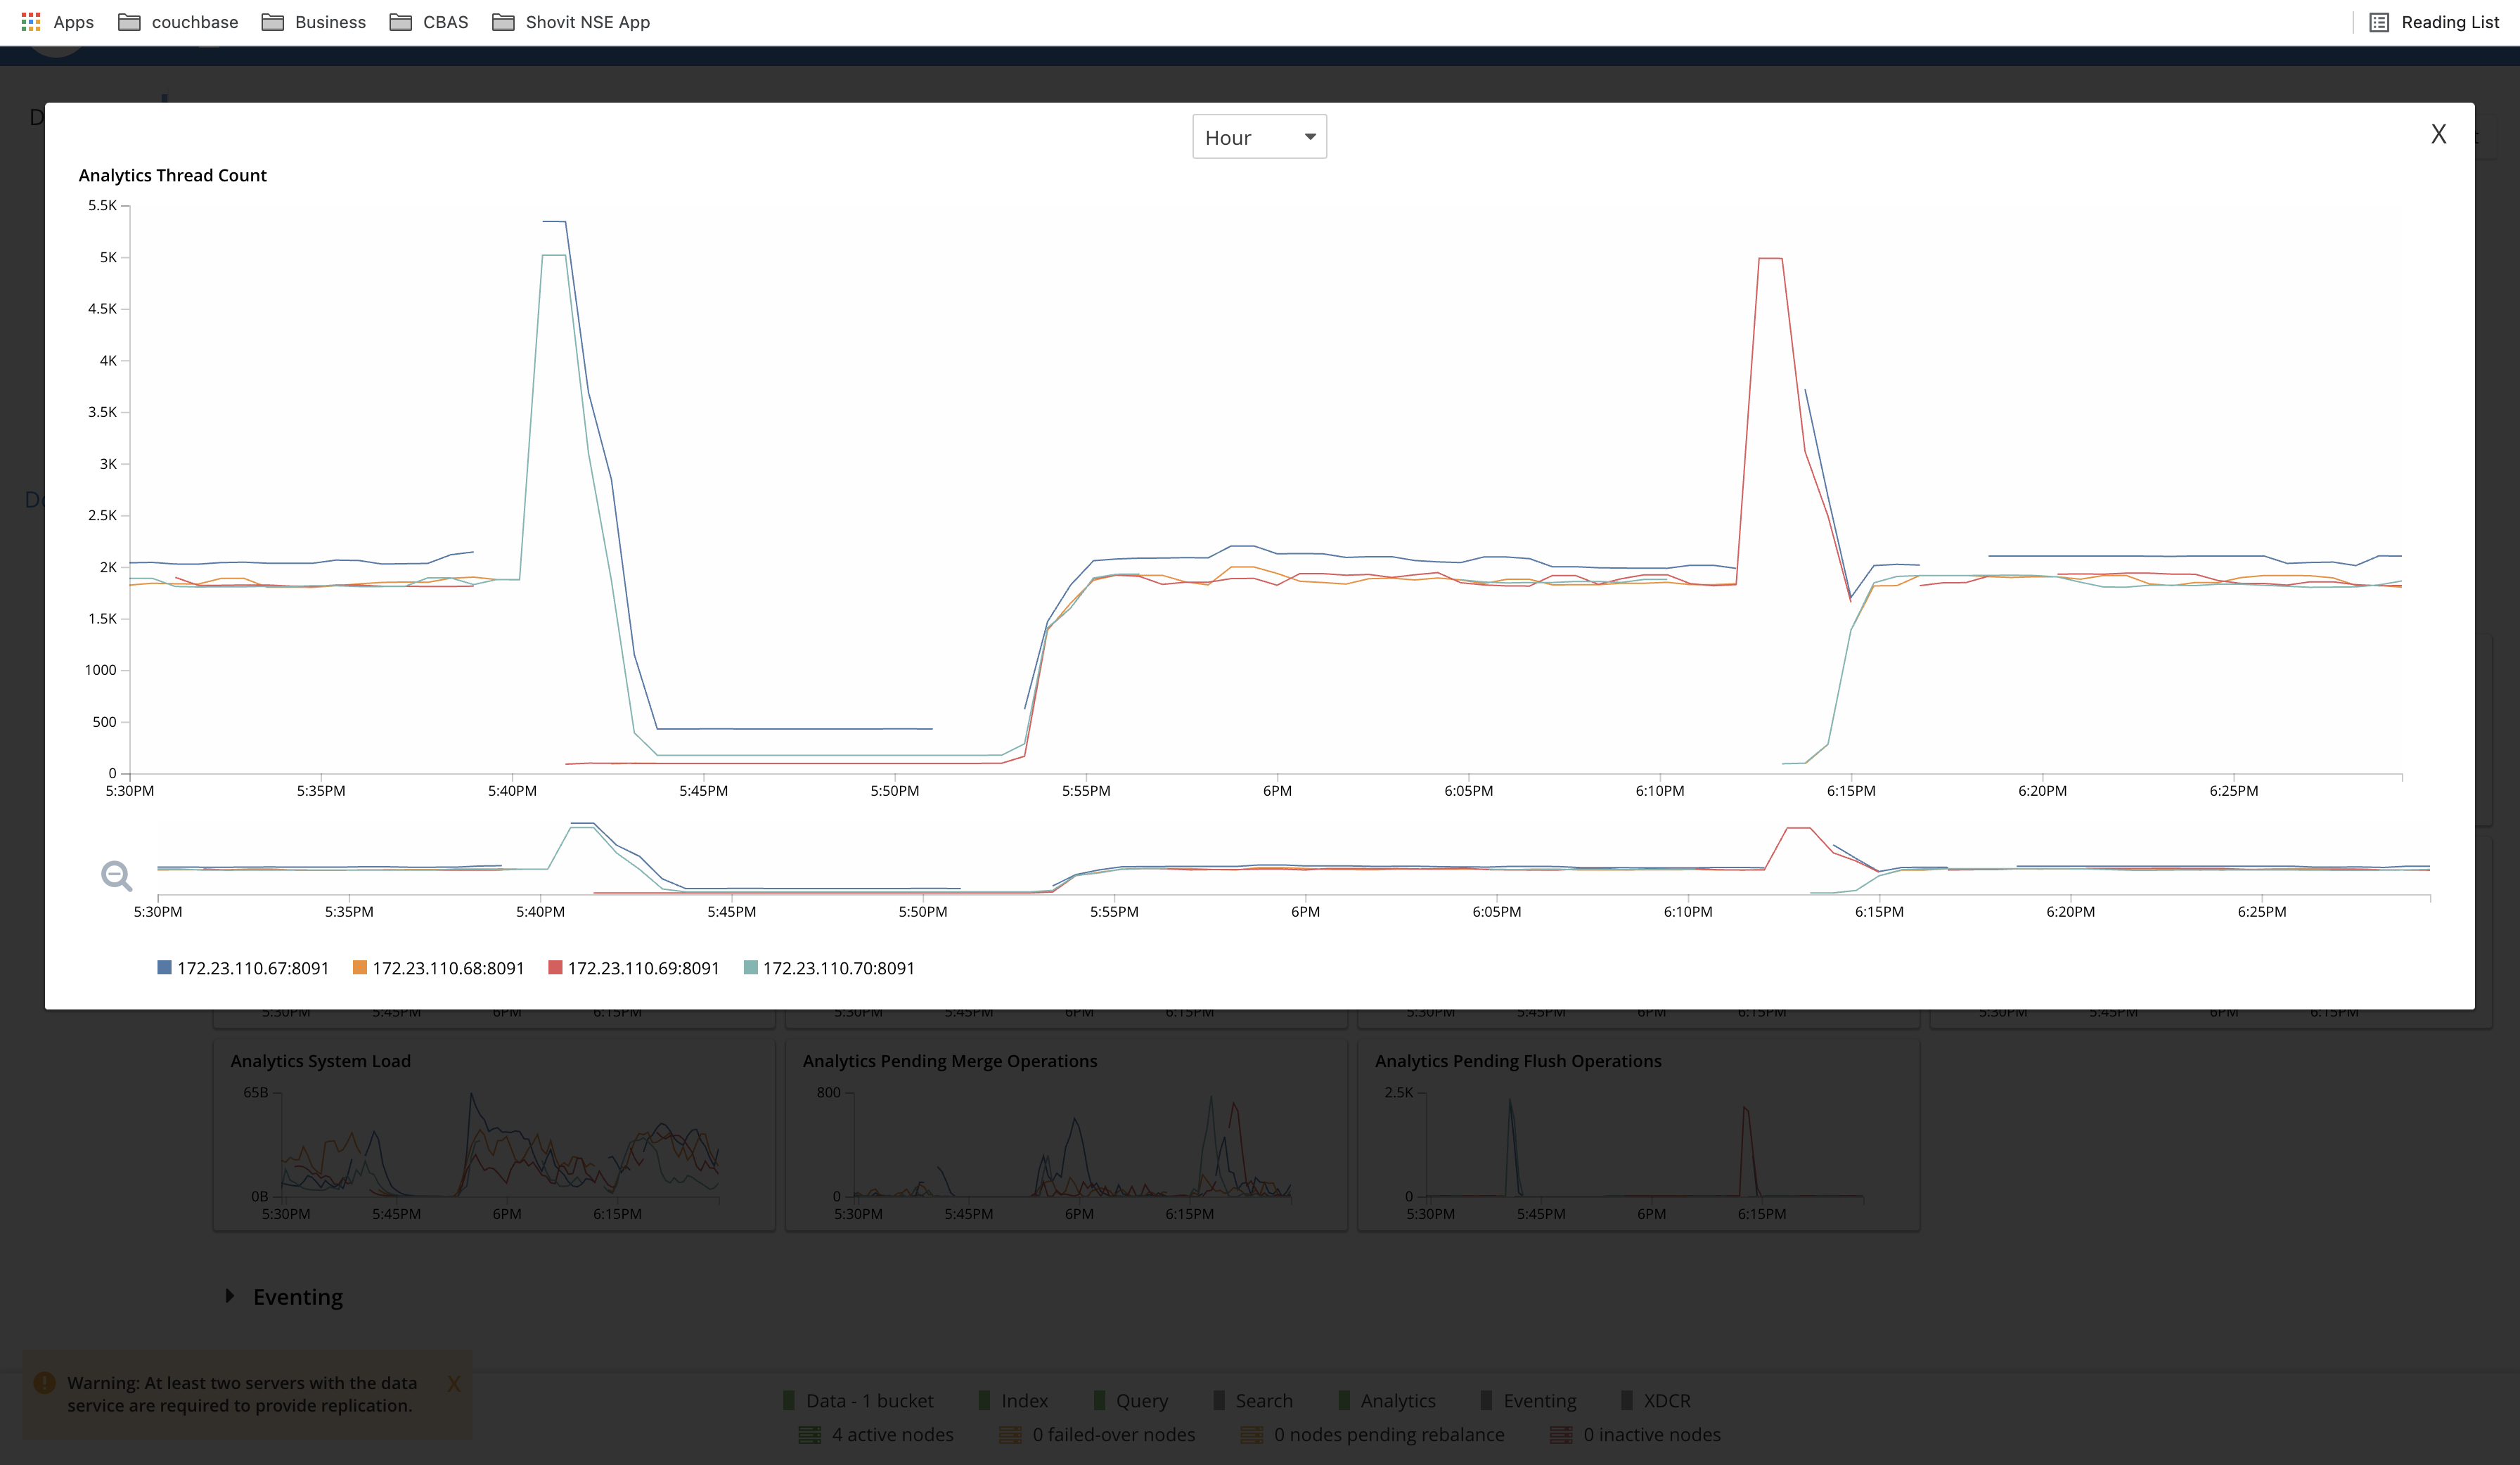
Image_2 to Image_7 - Broken graphs are observed for the stats in the images.
|