Details
-
Bug
-
Resolution: Duplicate
-
 Critical
-
None
-
7.1.0
-
7.1.0 build 2325
-
Untriaged
-
Windows 64-bit
-
1
-
Yes
-
KV 2022-Feb
Description
Script to Repro
guides/gradlew --refresh-dependencies testrunner -P jython=/opt/jython/bin/jython -P 'args=-i /tmp/win10-bucket-ops-temp_rebalance_magma_win.ini rerun=False,disk_optimized_thread_settings=True,get-cbcollect-info=True,bucket_storage=magma,kv_quota_percent=30,services_init=kv:index:n1ql:fts:eventing:cbas-kv:index:n1ql:fts:eventing:cbas-kv:index:n1ql:fts:eventing:cbas-kv:index:n1ql:fts:eventing:cbas-kv:index:n1ql:fts:eventing:cbas-kv:index:n1ql:fts:eventing:cbas -t bucket_collections.collections_rebalance.CollectionsRebalance.test_data_load_collections_with_rebalance_in,nodes_init=4,nodes_in=2,bucket_spec=magma_dgm.10_percent_dgm.4_node_1_replica_magma_512,doc_size=512,randomize_value=True,data_load_spec=volume_test_load_with_CRUD_on_collections,data_load_stage=during,skip_validations=False,GROUP=rebalance_in'
|
Was running bunch of tests to validate MB-50941 when I noticed it.
Steps to Repro
1. Create a 4 node cluster.
|
|
2022-02-16 23:32:41,542 | test | INFO | MainThread | [table_view:display:72] Cluster statistics
|
+----------------+--------------------------------------+-----------------+-----------+----------+---------------------+-------------------+-----------------------+
|
| Node | Services | CPU_utilization | Mem_total | Mem_free | Swap_mem_used | Active / Replica | Version |
|
+----------------+--------------------------------------+-----------------+-----------+----------+---------------------+-------------------+-----------------------+
|
| 172.23.136.138 | cbas, eventing, fts, index, kv, n1ql | 5.33833333333 | 5.99 GiB | 3.36 GiB | 3.33 GiB / 7.62 GiB | 0 / 0 | 7.1.0-2325-enterprise |
|
| 172.23.136.142 | cbas, eventing, fts, index, kv, n1ql | 1.35497741704 | 5.99 GiB | 3.42 GiB | 3.27 GiB / 7.62 GiB | 0 / 0 | 7.1.0-2325-enterprise |
|
| 172.23.136.141 | cbas, eventing, fts, index, kv, n1ql | 4.97174952916 | 5.99 GiB | 3.27 GiB | 3.33 GiB / 7.62 GiB | 0 / 0 | 7.1.0-2325-enterprise |
|
| 172.23.136.137 | cbas, eventing, fts, index, kv, n1ql | 1.25 | 5.99 GiB | 3.34 GiB | 3.32 GiB / 7.62 GiB | 0 / 0 | 7.1.0-2325-enterprise |
|
+----------------+--------------------------------------+-----------------+-----------+----------+---------------------+-------------------+-----------------------+
|
2. Create Bucket/scopes/collections/Data
2022-02-16 23:36:56,727 | test | INFO | MainThread | [table_view:display:72] Bucket statistics
|
+------------------------------------------------------------------------+-----------+-----------------+----------+------------+-----+---------+-----------+----------+-----------+---------------+
|
| Bucket | Type | Storage Backend | Replicas | Durability | TTL | Items | RAM Quota | RAM Used | Disk Used | ARR |
|
+------------------------------------------------------------------------+-----------+-----------------+----------+------------+-----+---------+-----------+----------+-----------+---------------+
|
| UoQtU7JR99ysgk0PaDwPg8rWZom%U0eqtDTErgiiYijKCHCZBHE62BiI0Dr--41-860000 | couchbase | magma | 2 | none | 0 | 3000000 | 2.97 GiB | 2.04 GiB | 4.25 GiB | 27.5666666667 |
|
+------------------------------------------------------------------------+-----------+-----------------+----------+------------+-----+---------+-----------+----------+-----------+---------------+
|
3. Start CRUD on data + scopes/collections
4. Add 2 nodes(172.23.136.136 and 172.23.136.139) and rebalance in.
2022-02-16 23:37:15,099 | test | INFO | pool-3-thread-10 | [table_view:display:72] Rebalance Overview
|
+----------------+--------------------------------------+-----------------------+---------------+--------------+
|
| Nodes | Services | Version | CPU | Status |
|
+----------------+--------------------------------------+-----------------------+---------------+--------------+
|
| 172.23.136.138 | cbas, eventing, fts, index, kv, n1ql | 7.1.0-2325-enterprise | 15.5480741988 | Cluster node |
|
| 172.23.136.142 | cbas, eventing, fts, index, kv, n1ql | 7.1.0-2325-enterprise | 60.9883333333 | Cluster node |
|
| 172.23.136.141 | cbas, eventing, fts, index, kv, n1ql | 7.1.0-2325-enterprise | 11.0416666667 | Cluster node |
|
| 172.23.136.137 | cbas, eventing, fts, index, kv, n1ql | 7.1.0-2325-enterprise | 17.24 | Cluster node |
|
| 172.23.136.136 | None | | | <--- IN --- |
|
| 172.23.136.139 | None | | | <--- IN --- |
|
+----------------+--------------------------------------+-----------------------+---------------+--------------+
|
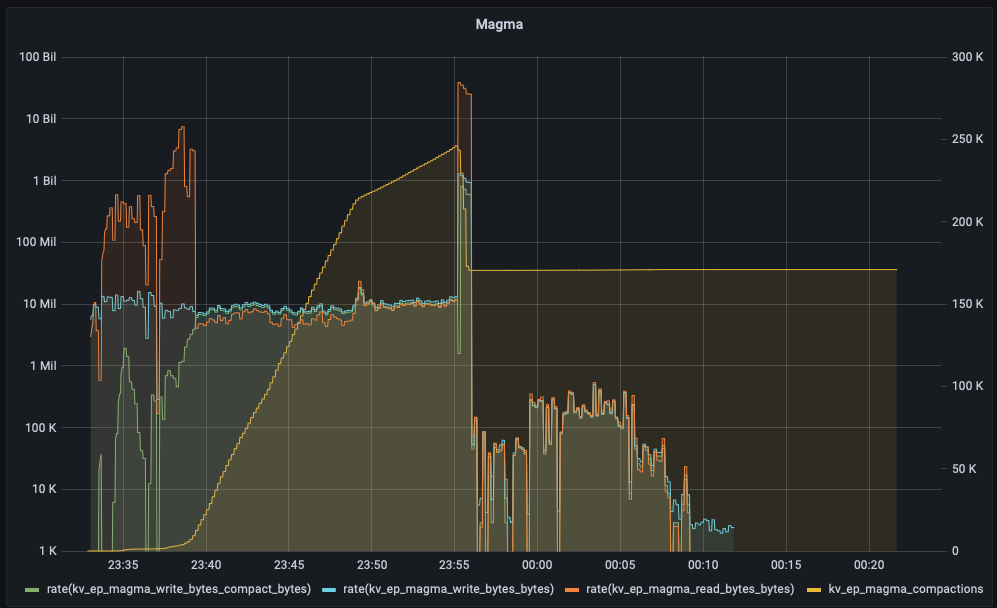
As can be seen from  not a single vbucket movement/incoming docs/outgoing docs happen for first 15 mins. However it does start after 15 mins and finish at the 18 mins mark.
In all fairness, this might not be a bug. But our tests/automation frameworks currently use timeouts anywhere between 5 mins - 35 mins (depending on the amount of data) for rebalance to be considered a hang and fail the testcase. So, was wondering if something has changed recently that could cause this? If this issue occurs on a weekly run we could be looking at 100's of tc's failing as the default timeouts that we have wont work anymore.
cbcollect_info attached.