Details
-
Task
-
Resolution: Unresolved
-
 Major
Major
-
7.1.4
-
0
Description
As per a recent CBSE-14910,
We have designed a test to monitor prometheus CPU utilisation during heavy /range queries.
By Heavy I meant , with a payload which have large number of queries . This is similar to what Capella UI was doing in customer's Case.
For Indexer service Capella UI was asking for 8 stats :
- index_memory_used
- index_resident_percent
- index_items_count
- index_data_size
- index_num_docs_pending_and_queued
- index_num_requests
- index_num_rows_returned
- index_disk_size
I am creating 100 indexes with 2 replica . So in total 300 index instances .. just creating them not building.
For all index instances as a seperate entry in /pools/default/stats/range API's payload ..
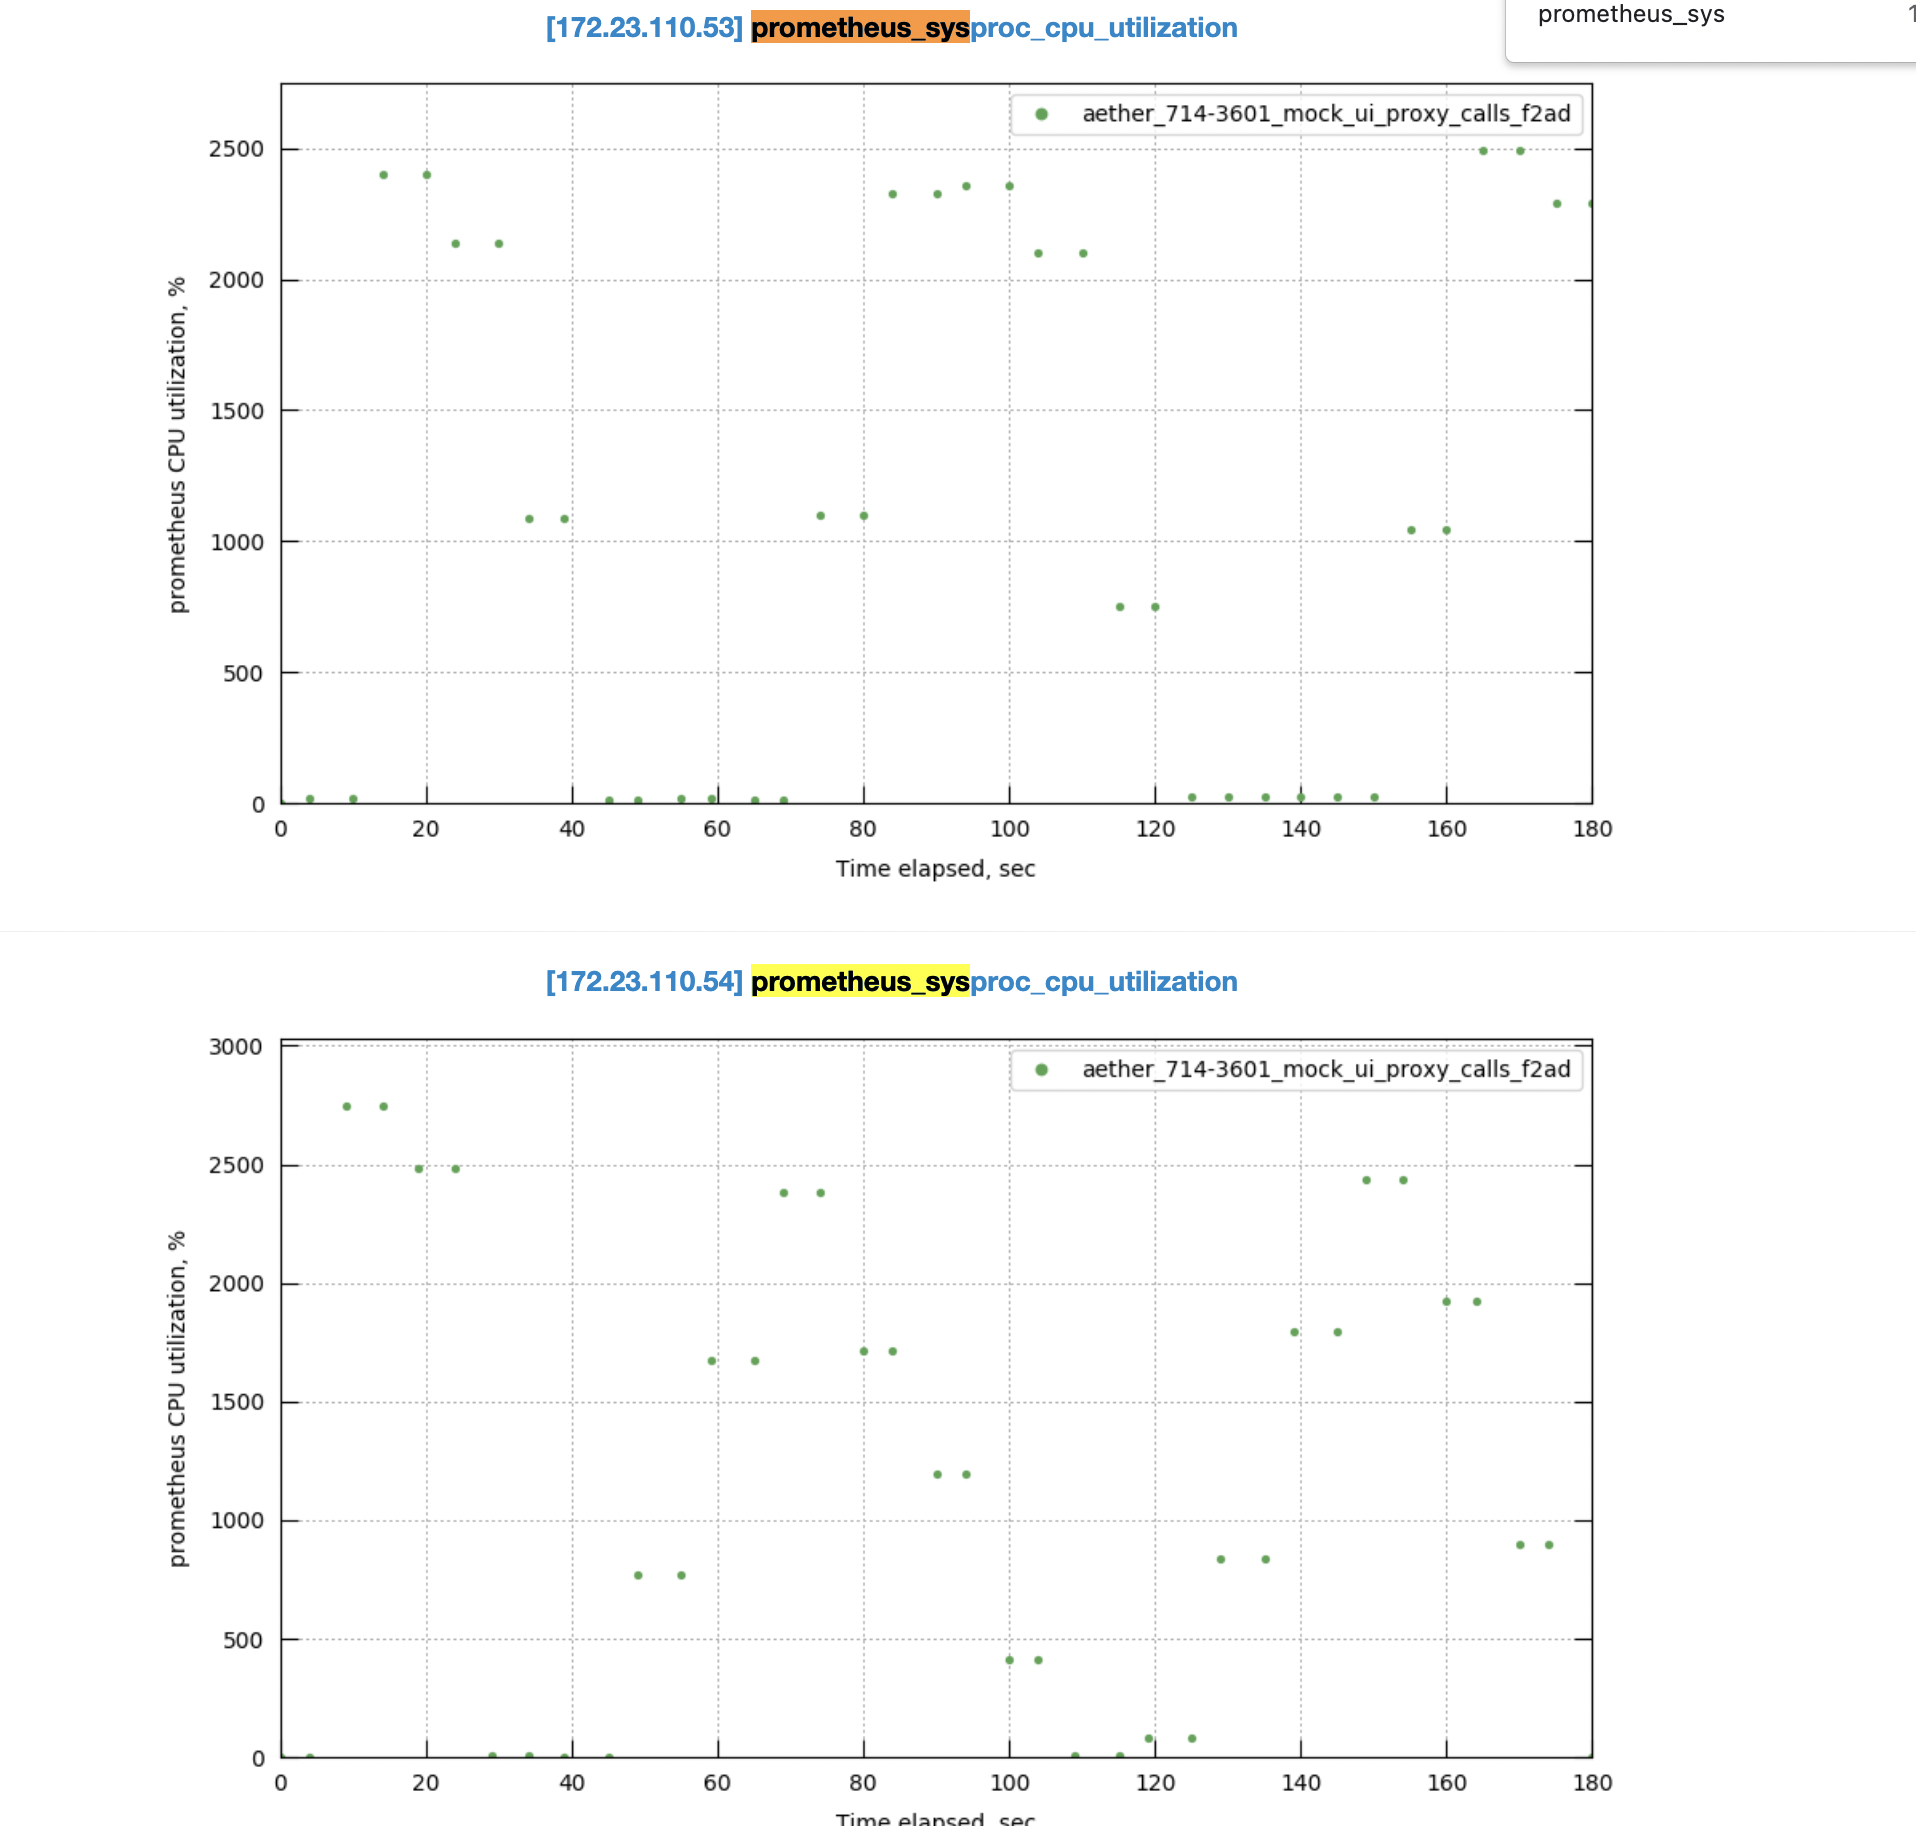
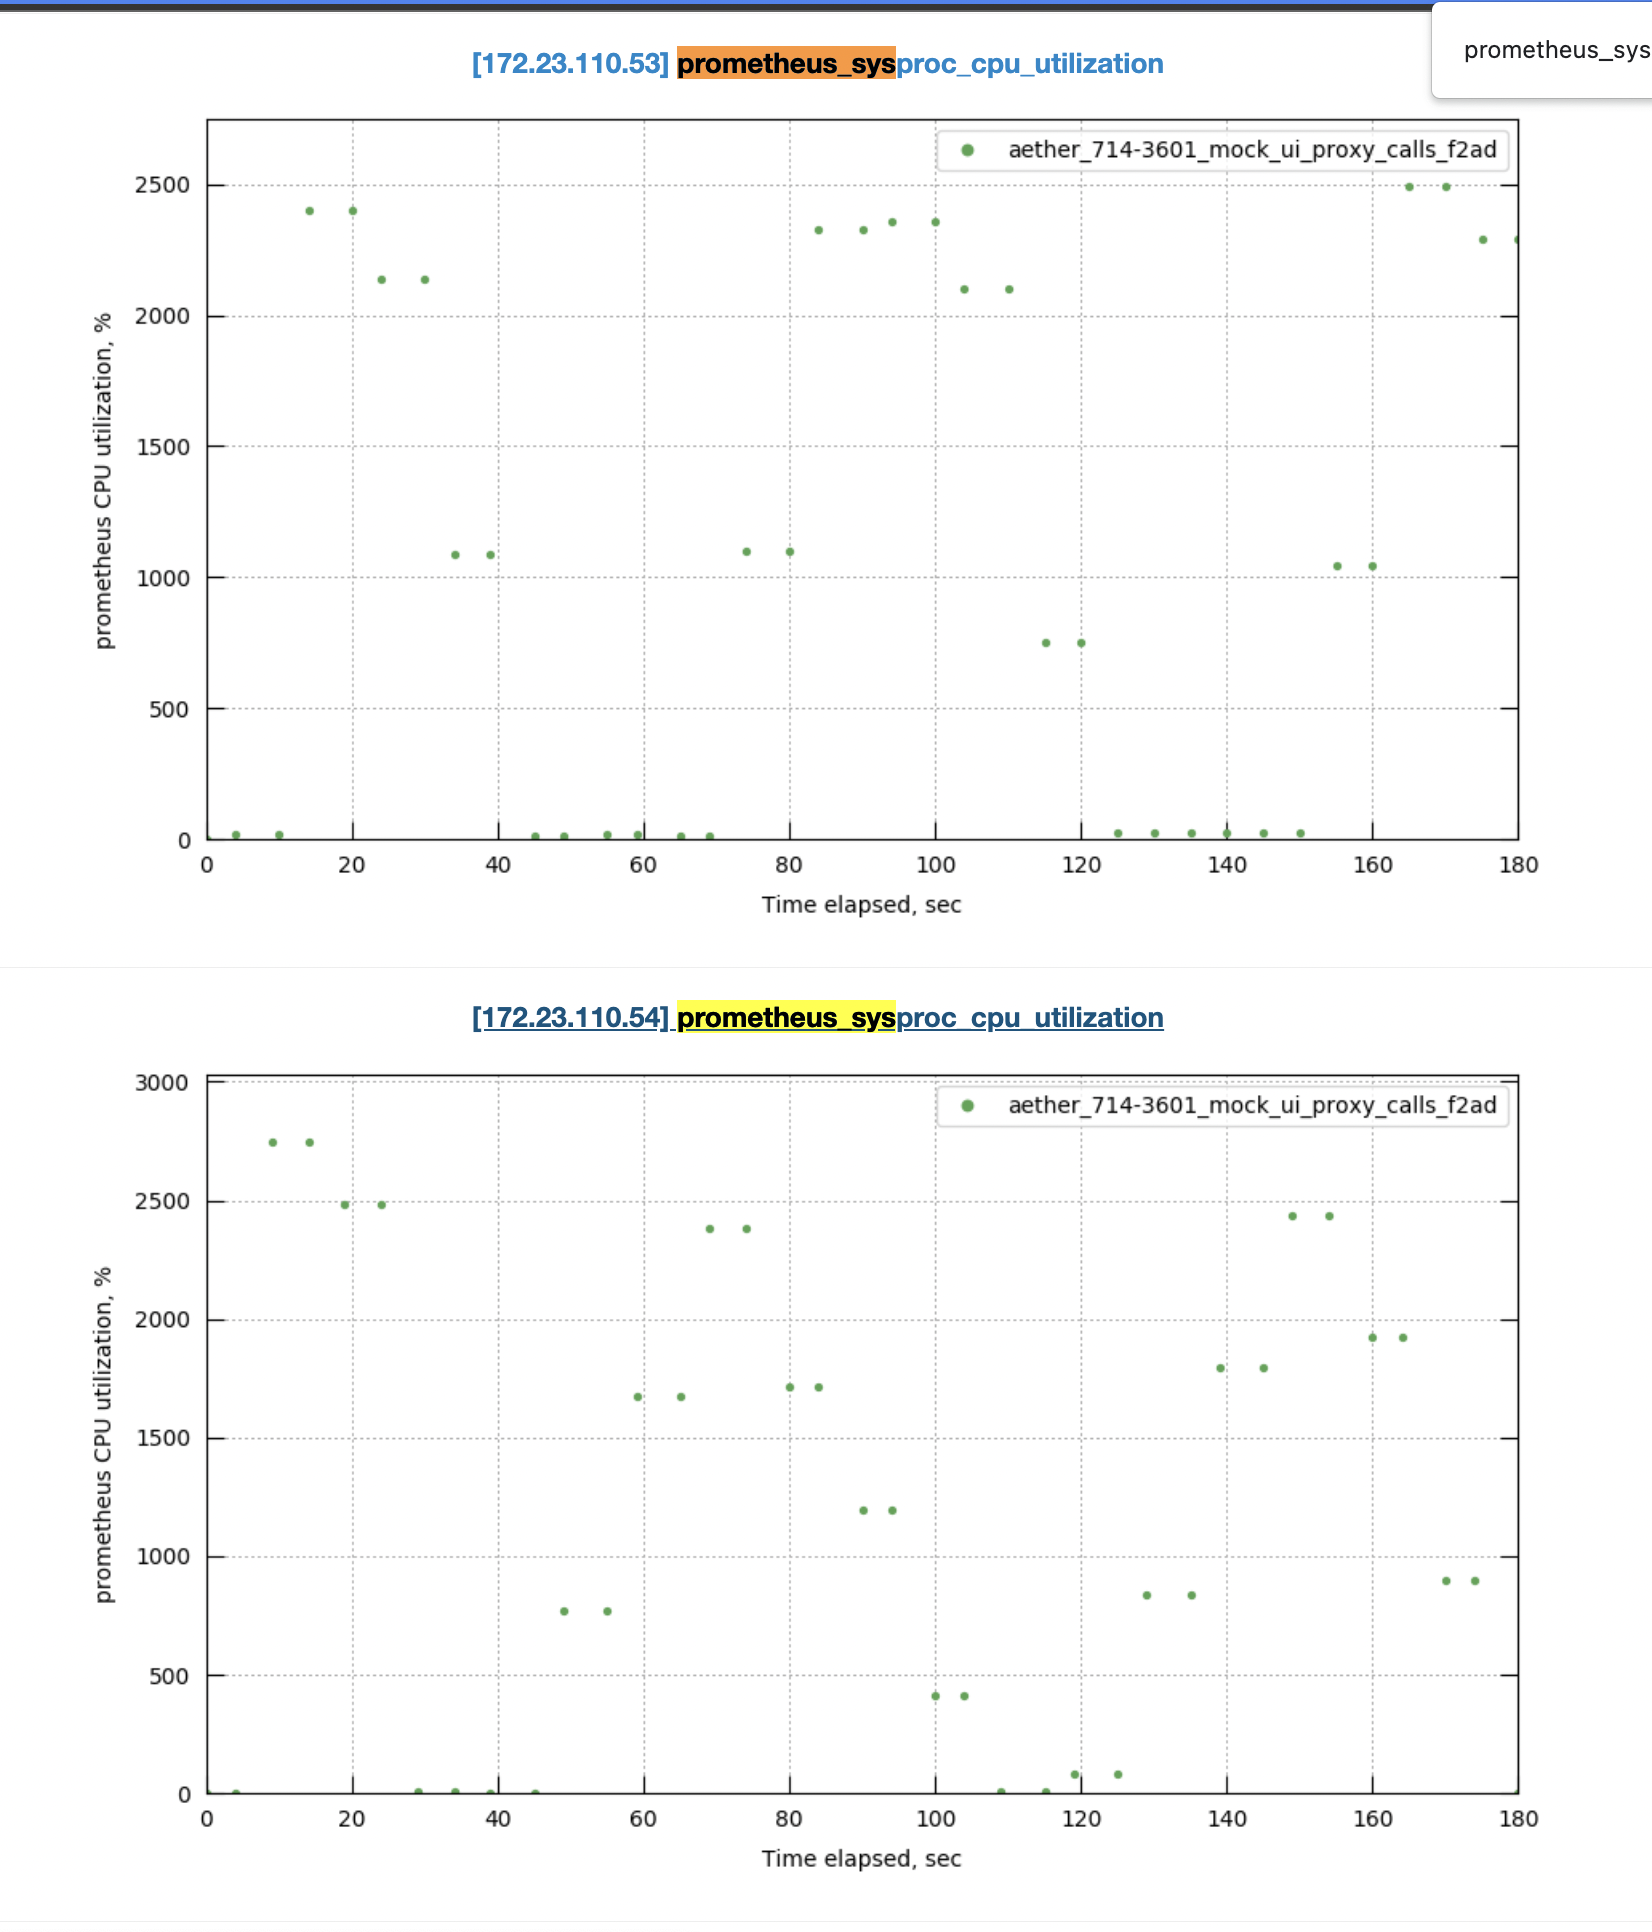
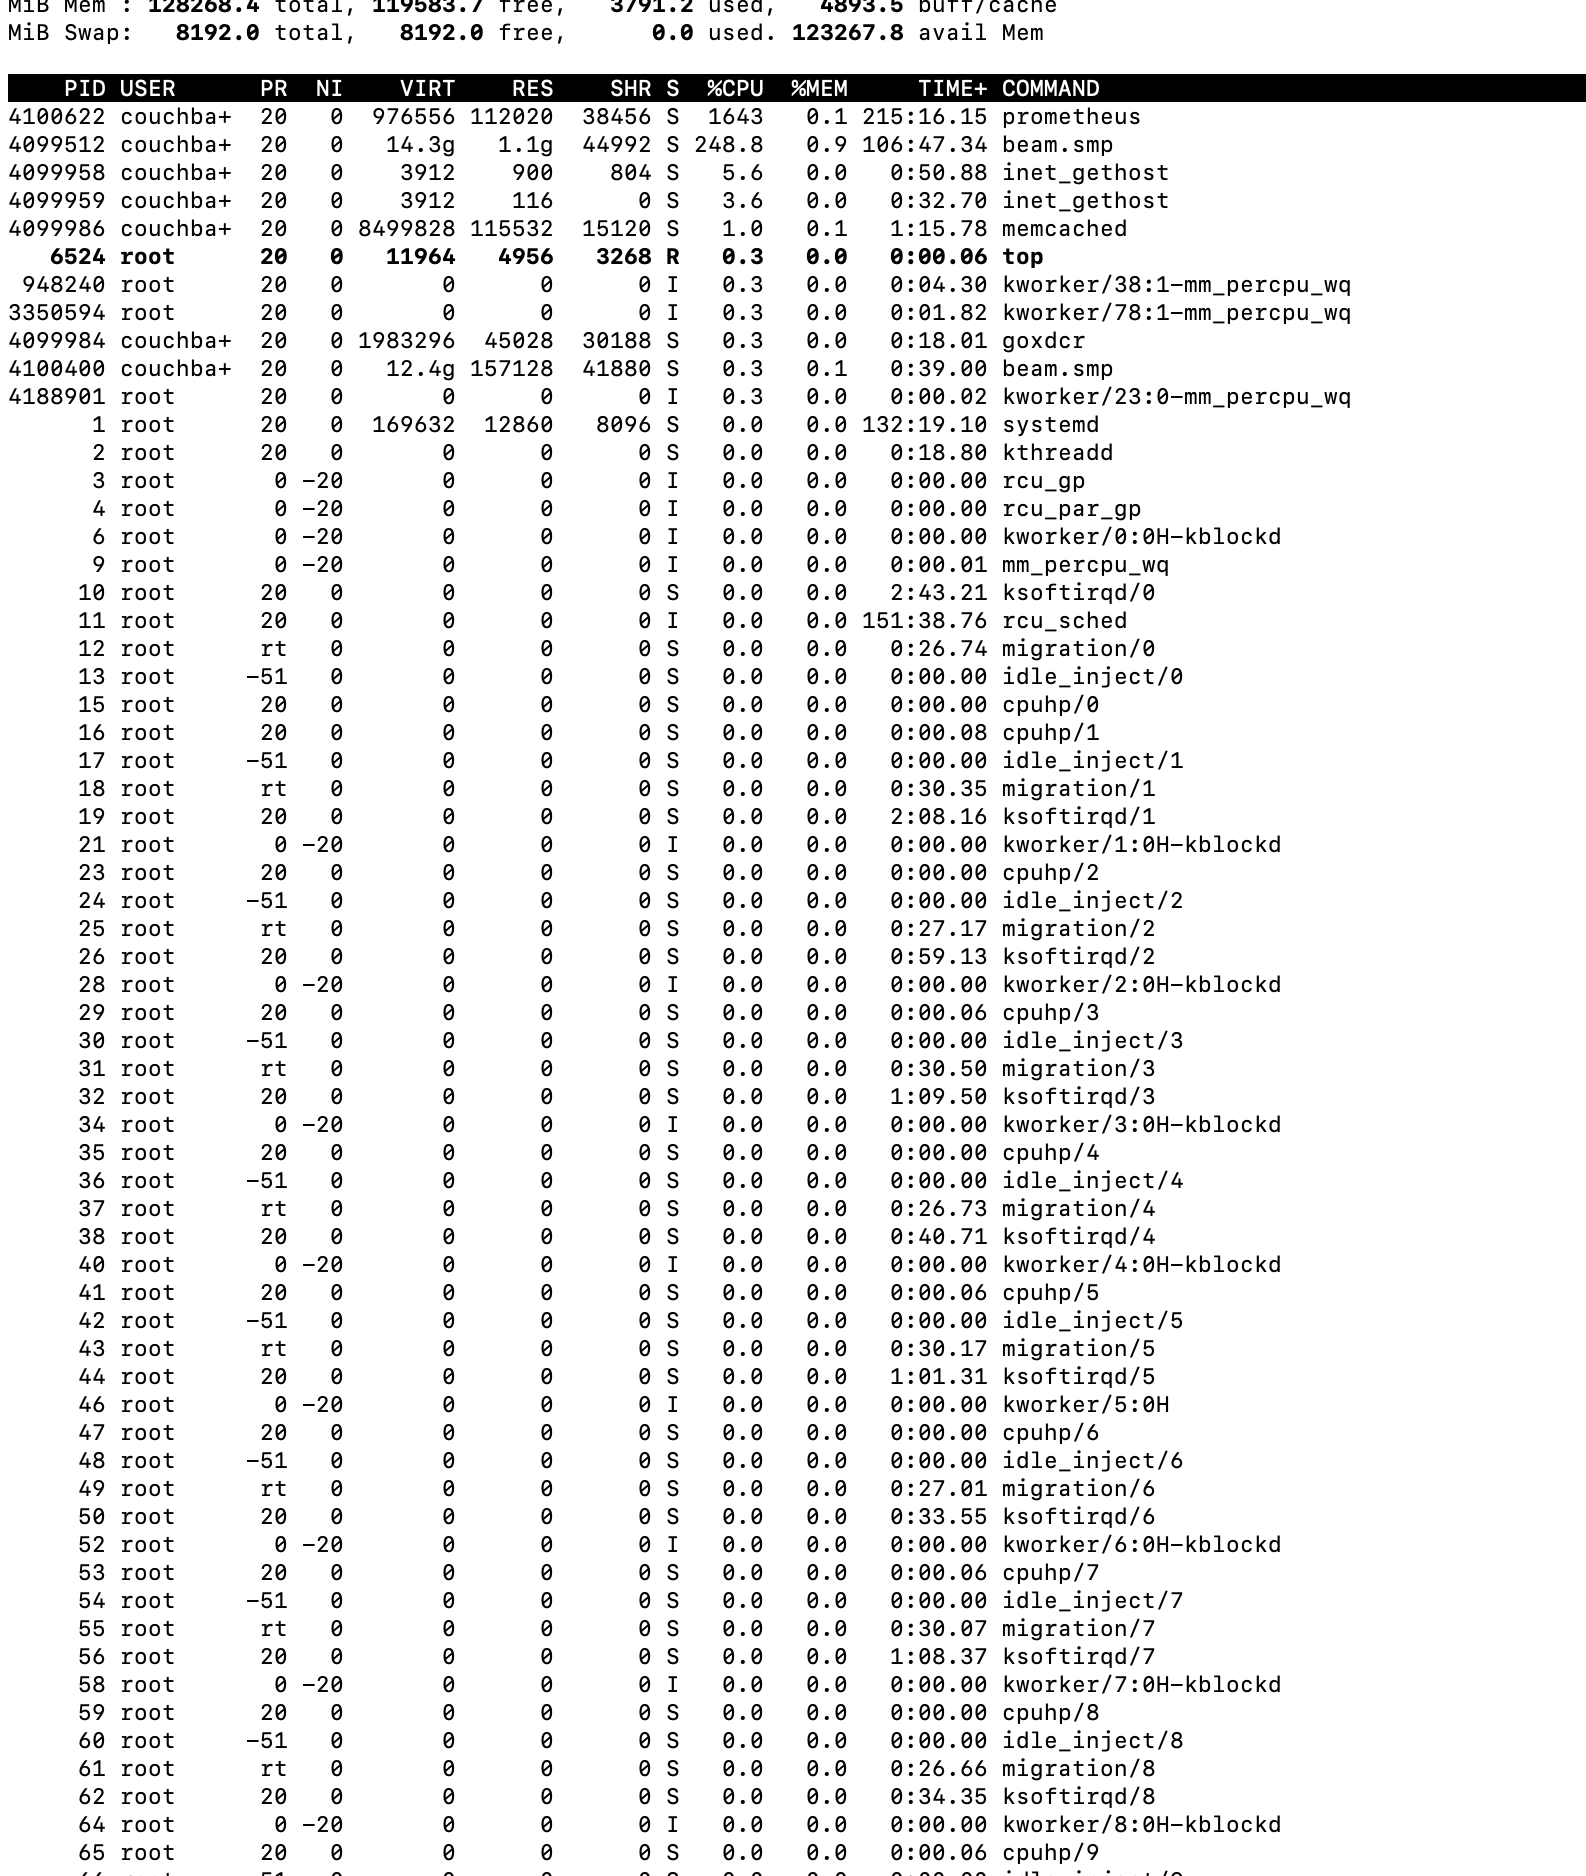
On mocking similar behvaiour in our Test we see that Prometheus CPU is skiping up for using 0.02 cores to using 5 cores of machine is just matter of milliseconds 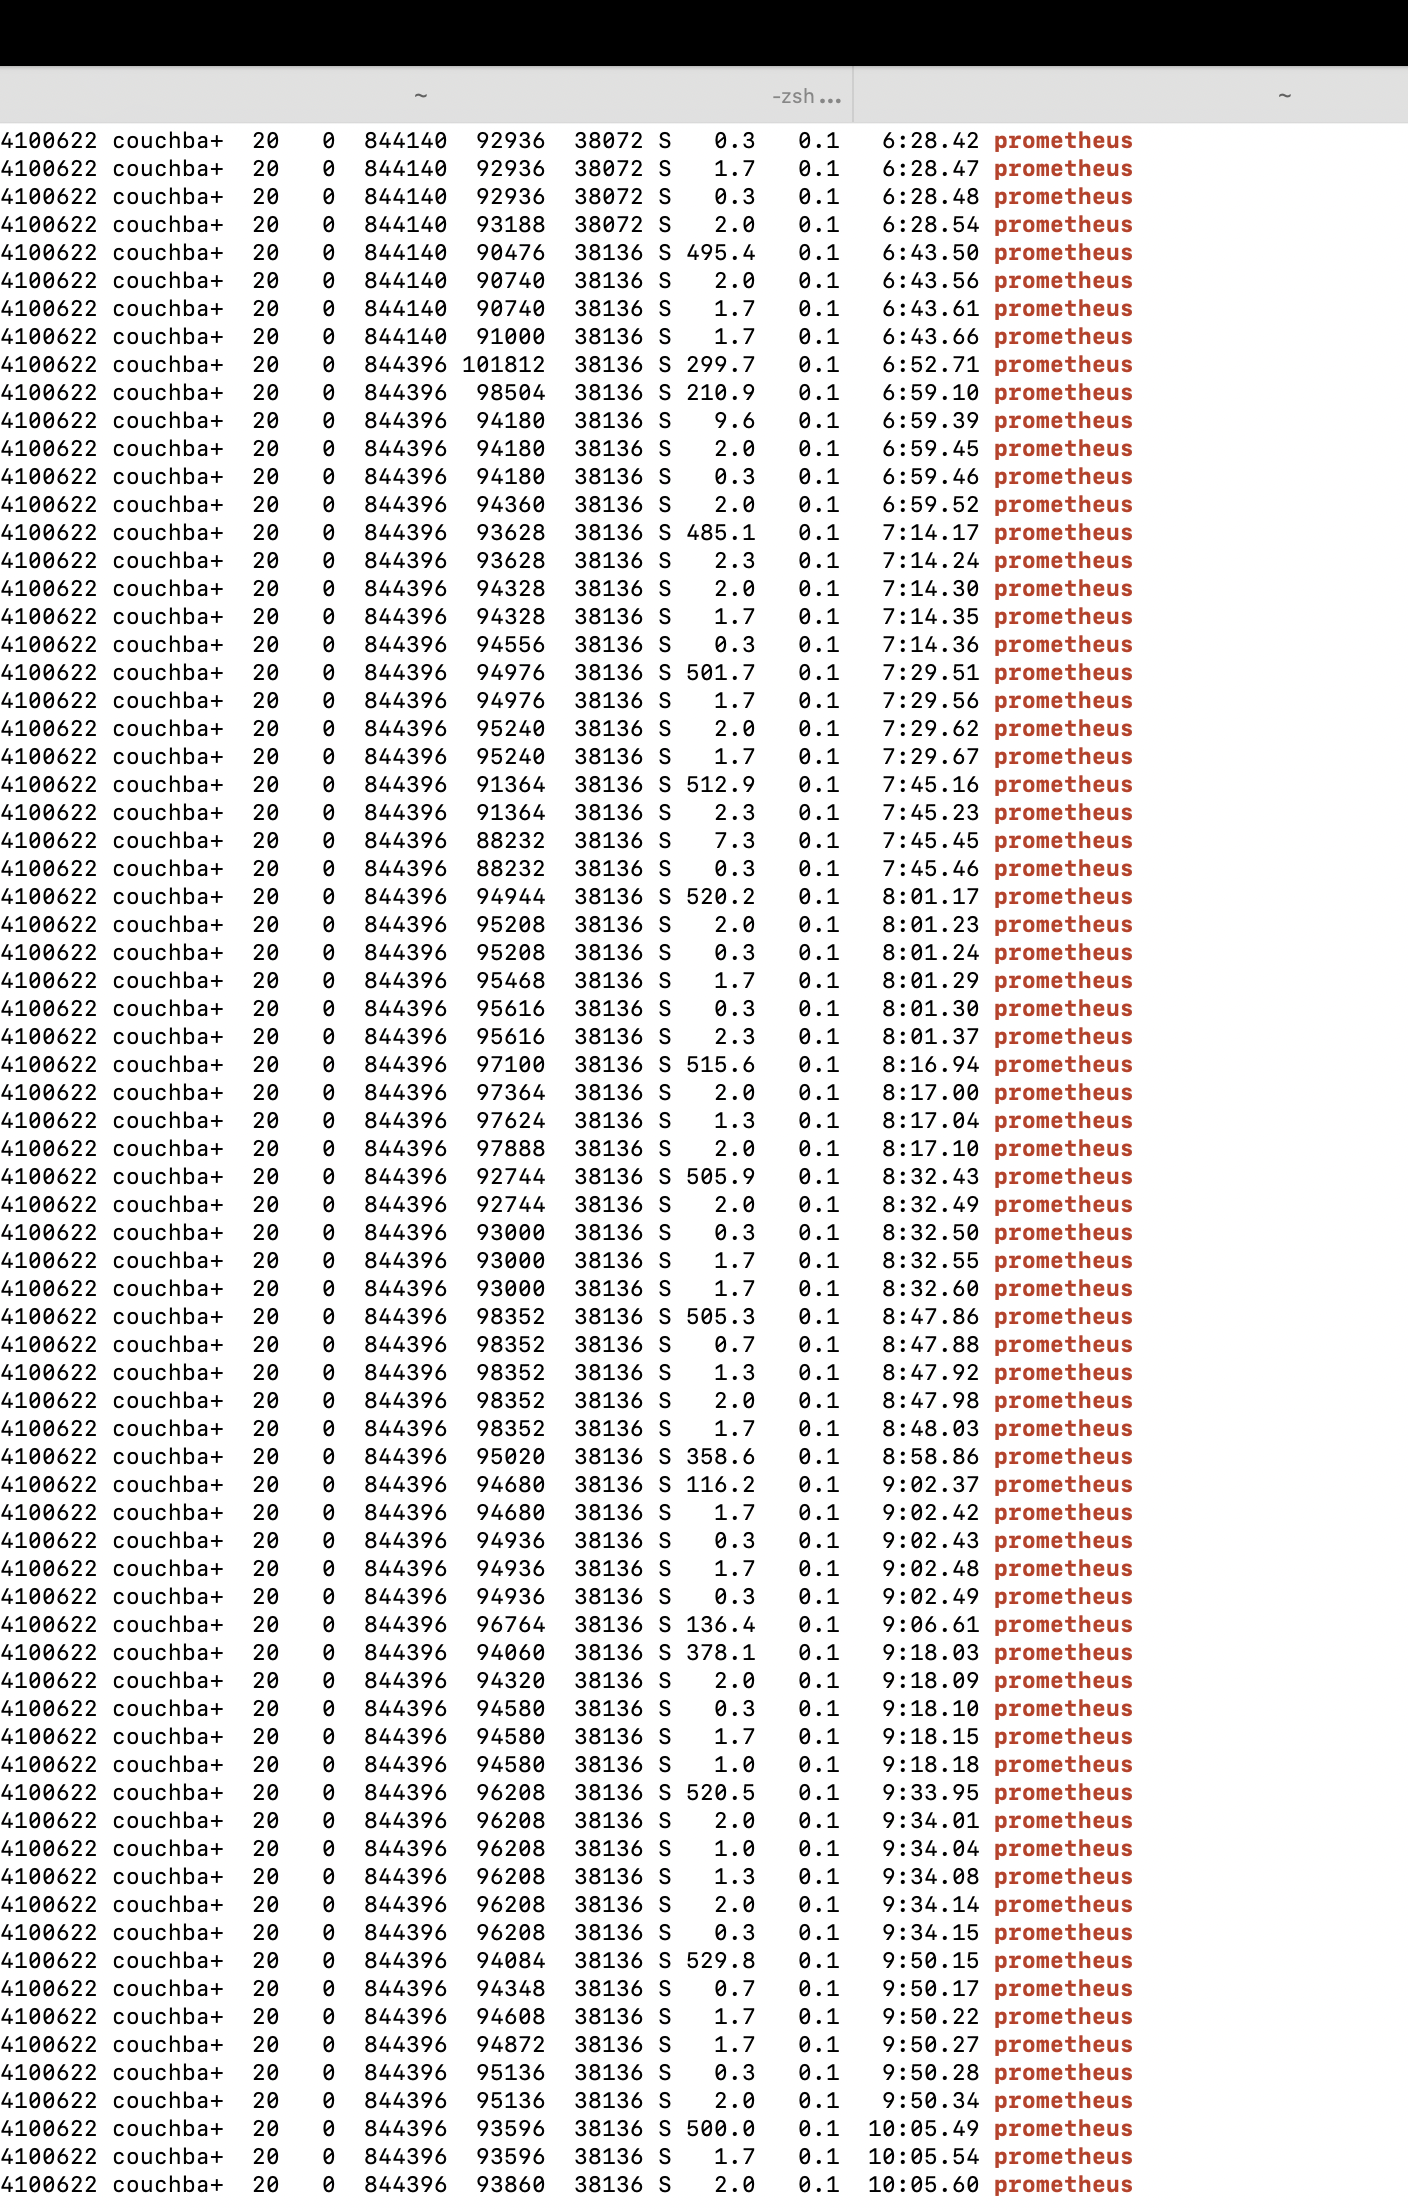
(the third last entry in each row is CPU percentange 1 core = 100%)
This spike happens whenever we are making an api call after polling interval of 10 secs
Also in other variations of this test.
We tried making multiple queries at the same time parallel with same payload .
then we are seeing ..
With 10 parallel request.
CPU utilisation jumping to using 25 cores from 0.02 cores momentarily..with polling interval.
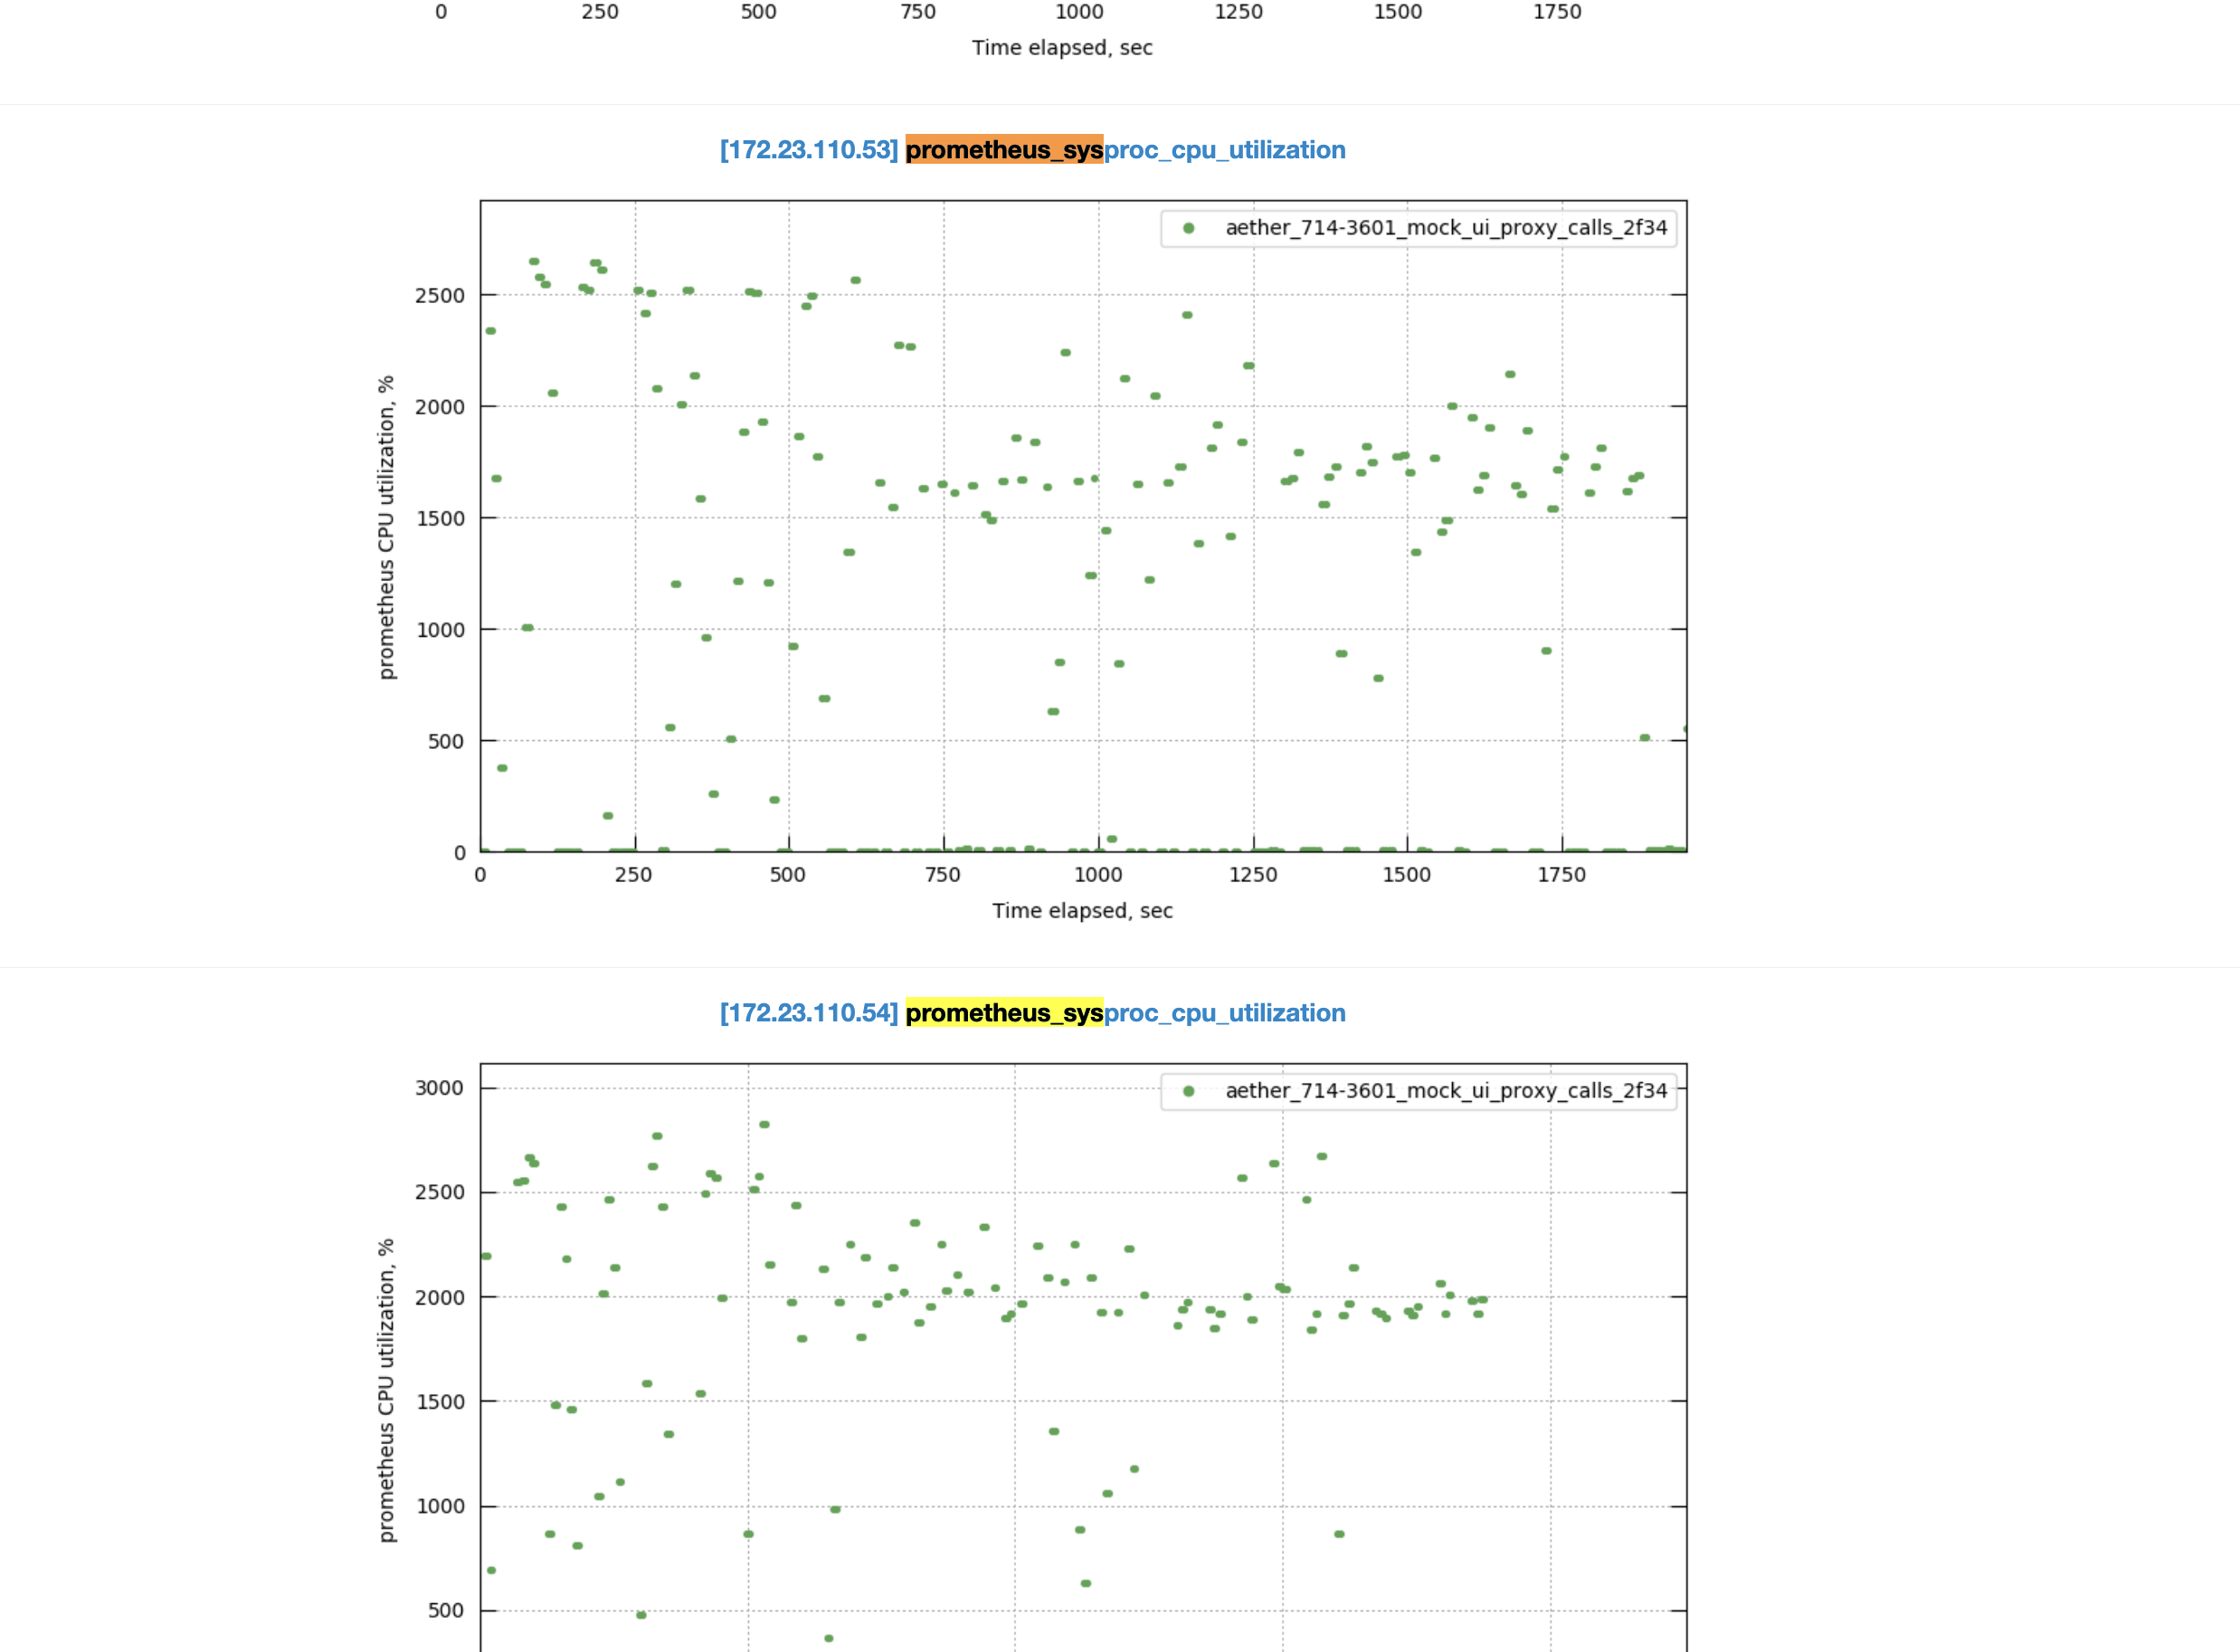
On Trying same scenario without polling interval , the prometheus seems to be taking 16 to 25 cores .. continously ,
We also have a variation of test where .. we are hitting 10 API at a time for 10 minutes continuously .. after that waiting for some time then firing 20 API queries for 10 minutes and then doing same with 100 API requests .. at same time ( as a Capella UI could be open at multiple places at same time)
http://perf.jenkins.couchbase.com/job/aether/2908/console
logs :
https://s3-us-west-2.amazonaws.com/perf-artifacts/jenkins-aether-2908/172.23.110.53.zip
https://s3-us-west-2.amazonaws.com/perf-artifacts/jenkins-aether-2908/172.23.110.54.zip
https://s3-us-west-2.amazonaws.com/perf-artifacts/jenkins-aether-2908/172.23.110.55.zip
https://s3-us-west-2.amazonaws.com/perf-artifacts/jenkins-aether-2908/172.23.110.56.zip
https://s3-us-west-2.amazonaws.com/perf-artifacts/jenkins-aether-2908/172.23.110.71.zip
https://s3-us-west-2.amazonaws.com/perf-artifacts/jenkins-aether-2908/172.23.110.72.zip
https://s3-us-west-2.amazonaws.com/perf-artifacts/jenkins-aether-2908/172.23.110.73.zip
stats can be seen here :
http://cbmonitor.sc.couchbase.com/reports/html/?snapshot=aether_714-3601_mock_ui_proxy_calls_2f34