Uploaded image for project: 'Couchbase Server'
  1. Couchbase Server
  2. MB-60094

[UI] Some query graphs show cumulative values instead of showing current value

    XMLWordPrintable

Details

    • Bug
    • Resolution: Fixed
    • Major
    • 7.6.0
    • 7.6.0, 7.2.4
    • UI
    • Untriaged
    • 0
    • Unknown

    Description

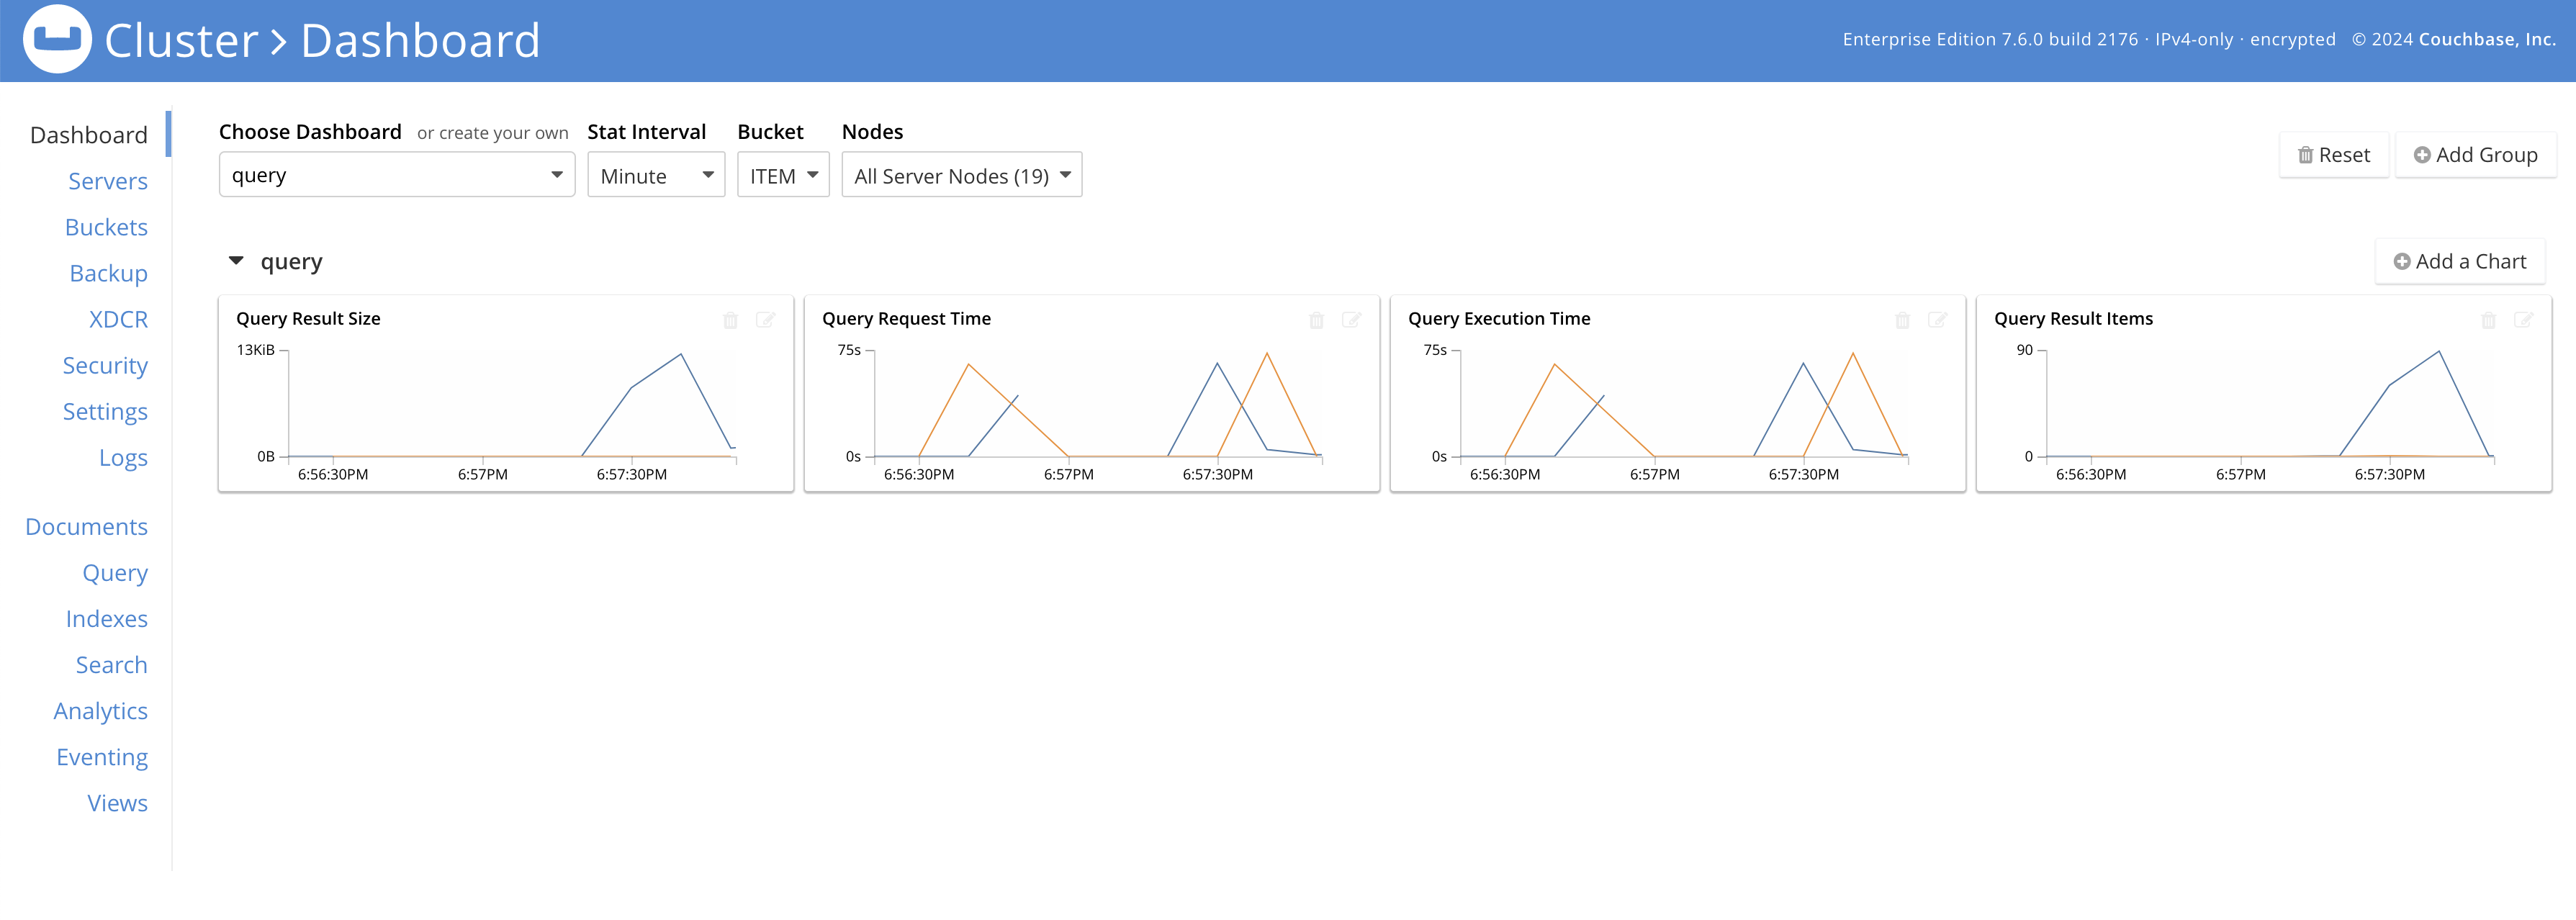
      I think UI should show current values for the following query metrics in server UI:

      query.n1ql_avg_req_time
      query.n1ql_avg_svc_time
      query.n1ql_avg_response_size
      query.n1ql_avg_result_count
      

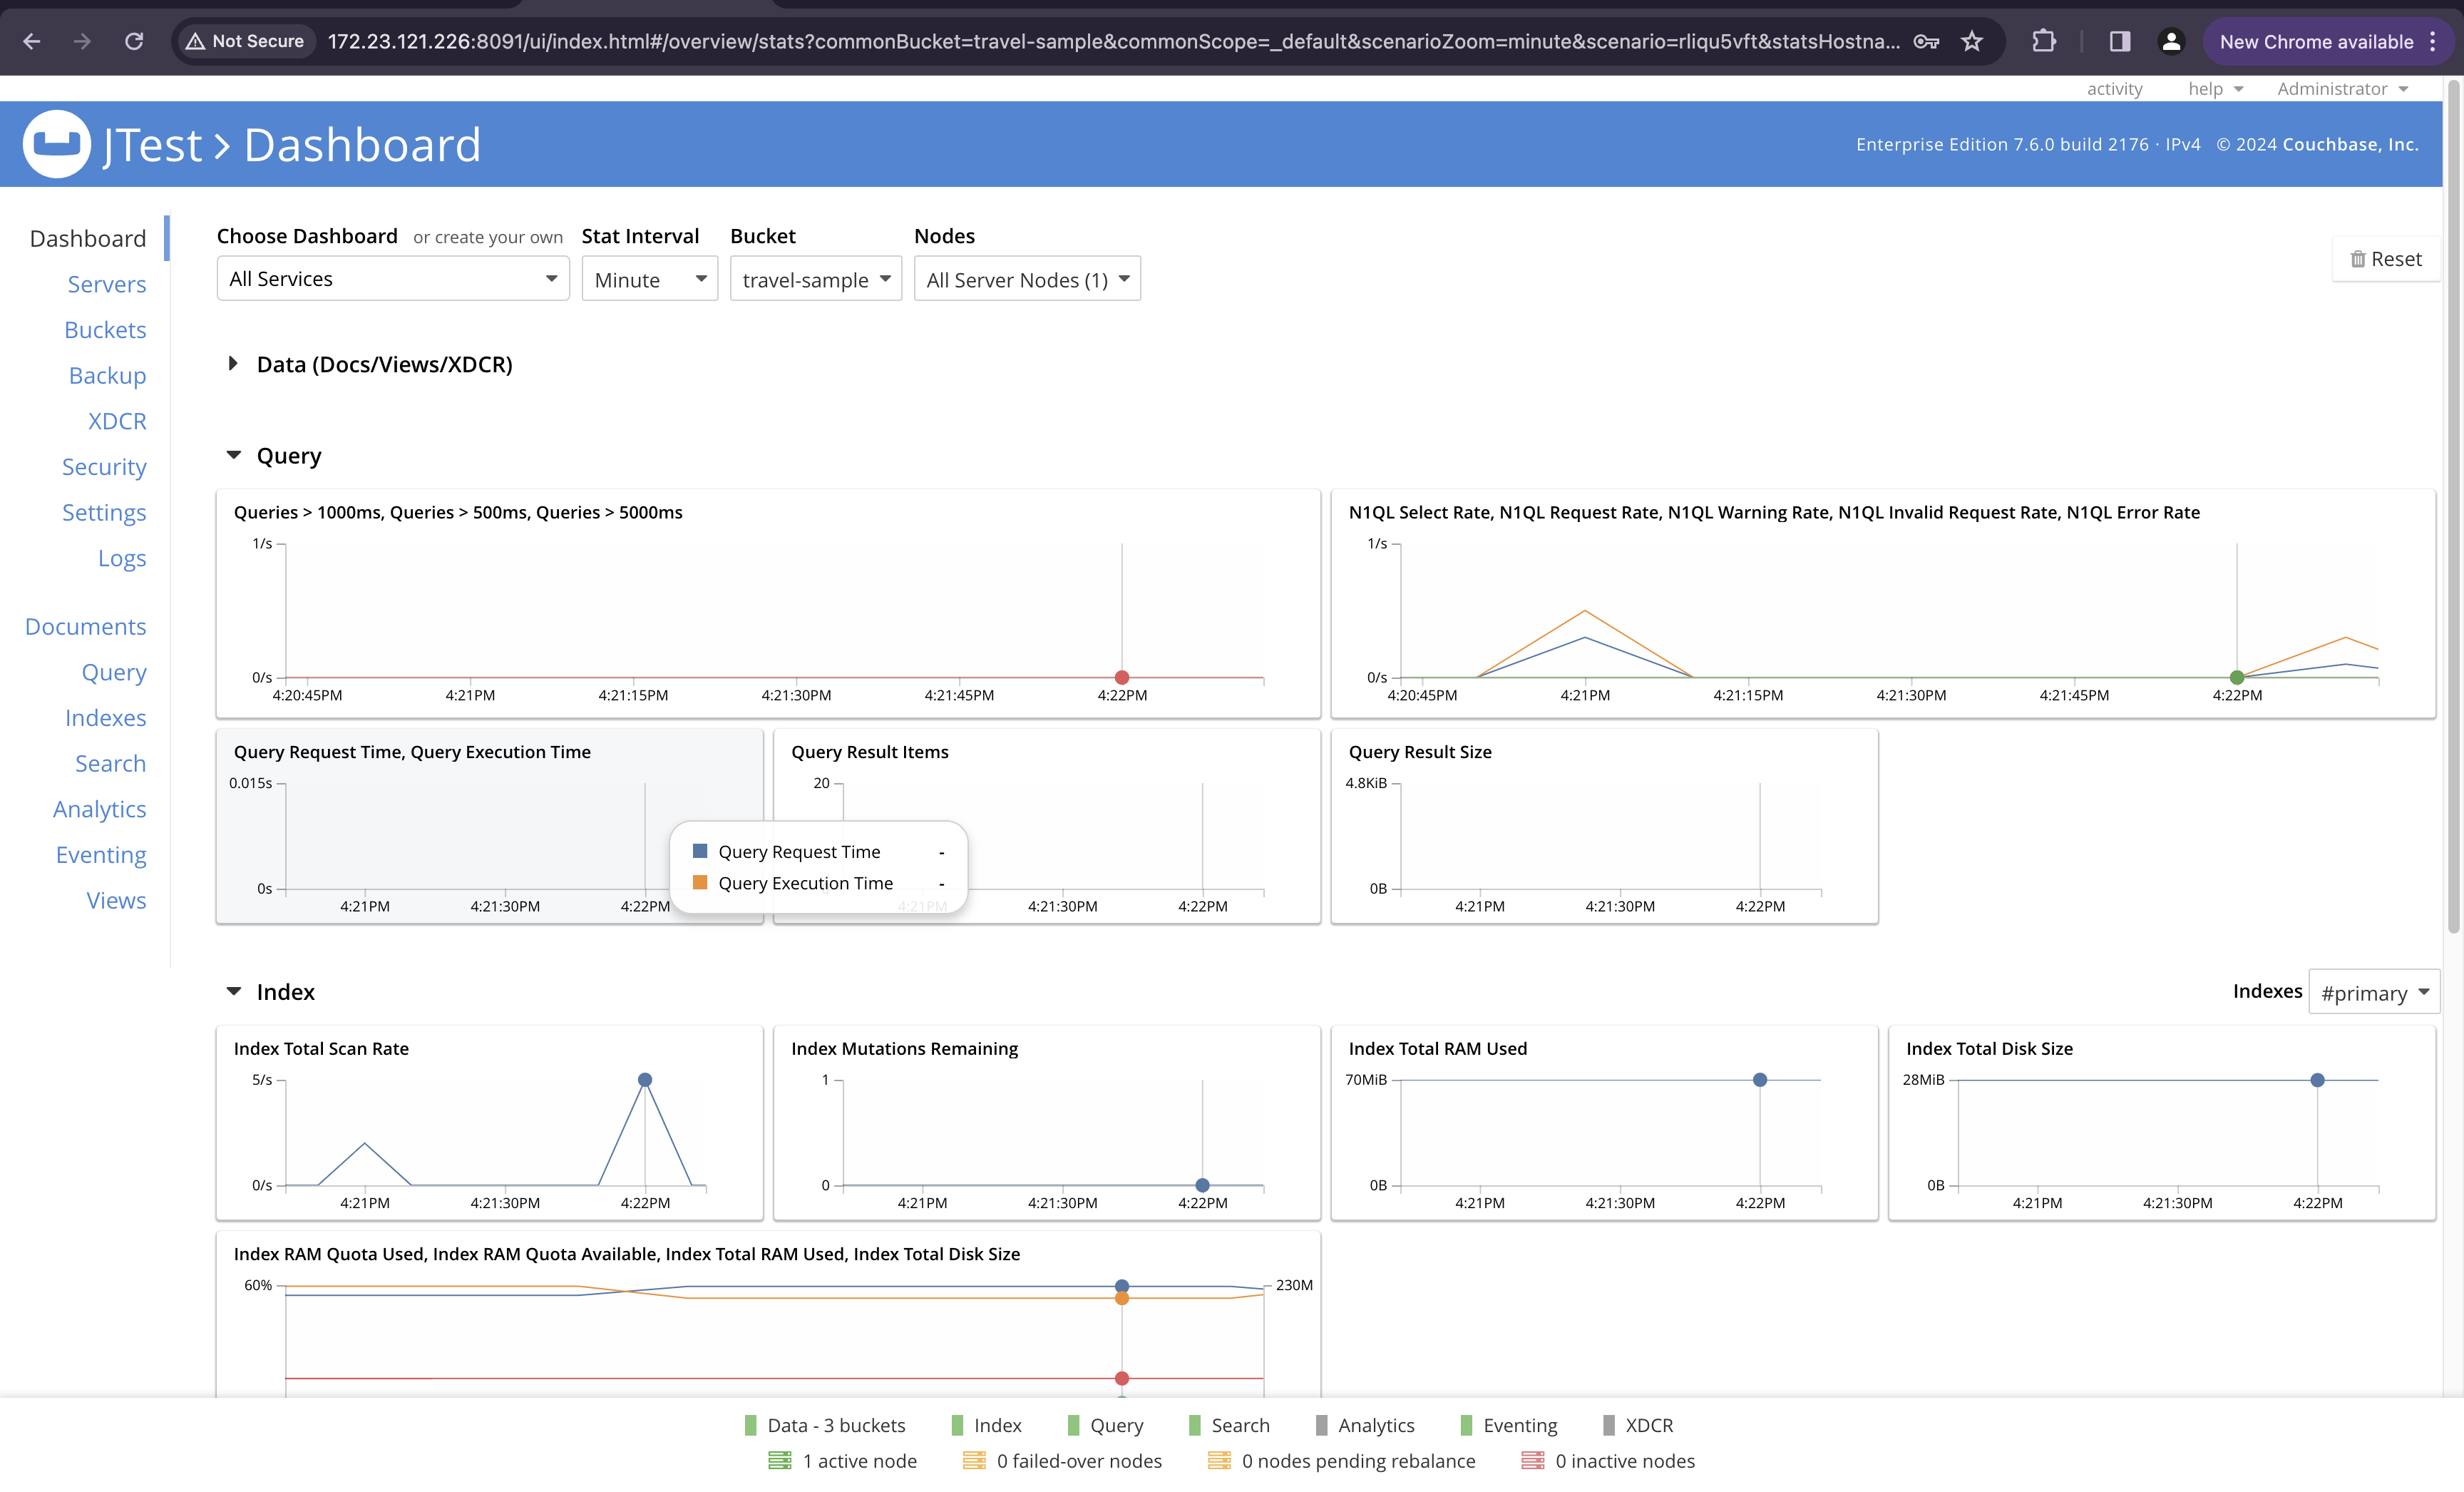
      Showing cumulative values for those metrics doesn't make much sense.
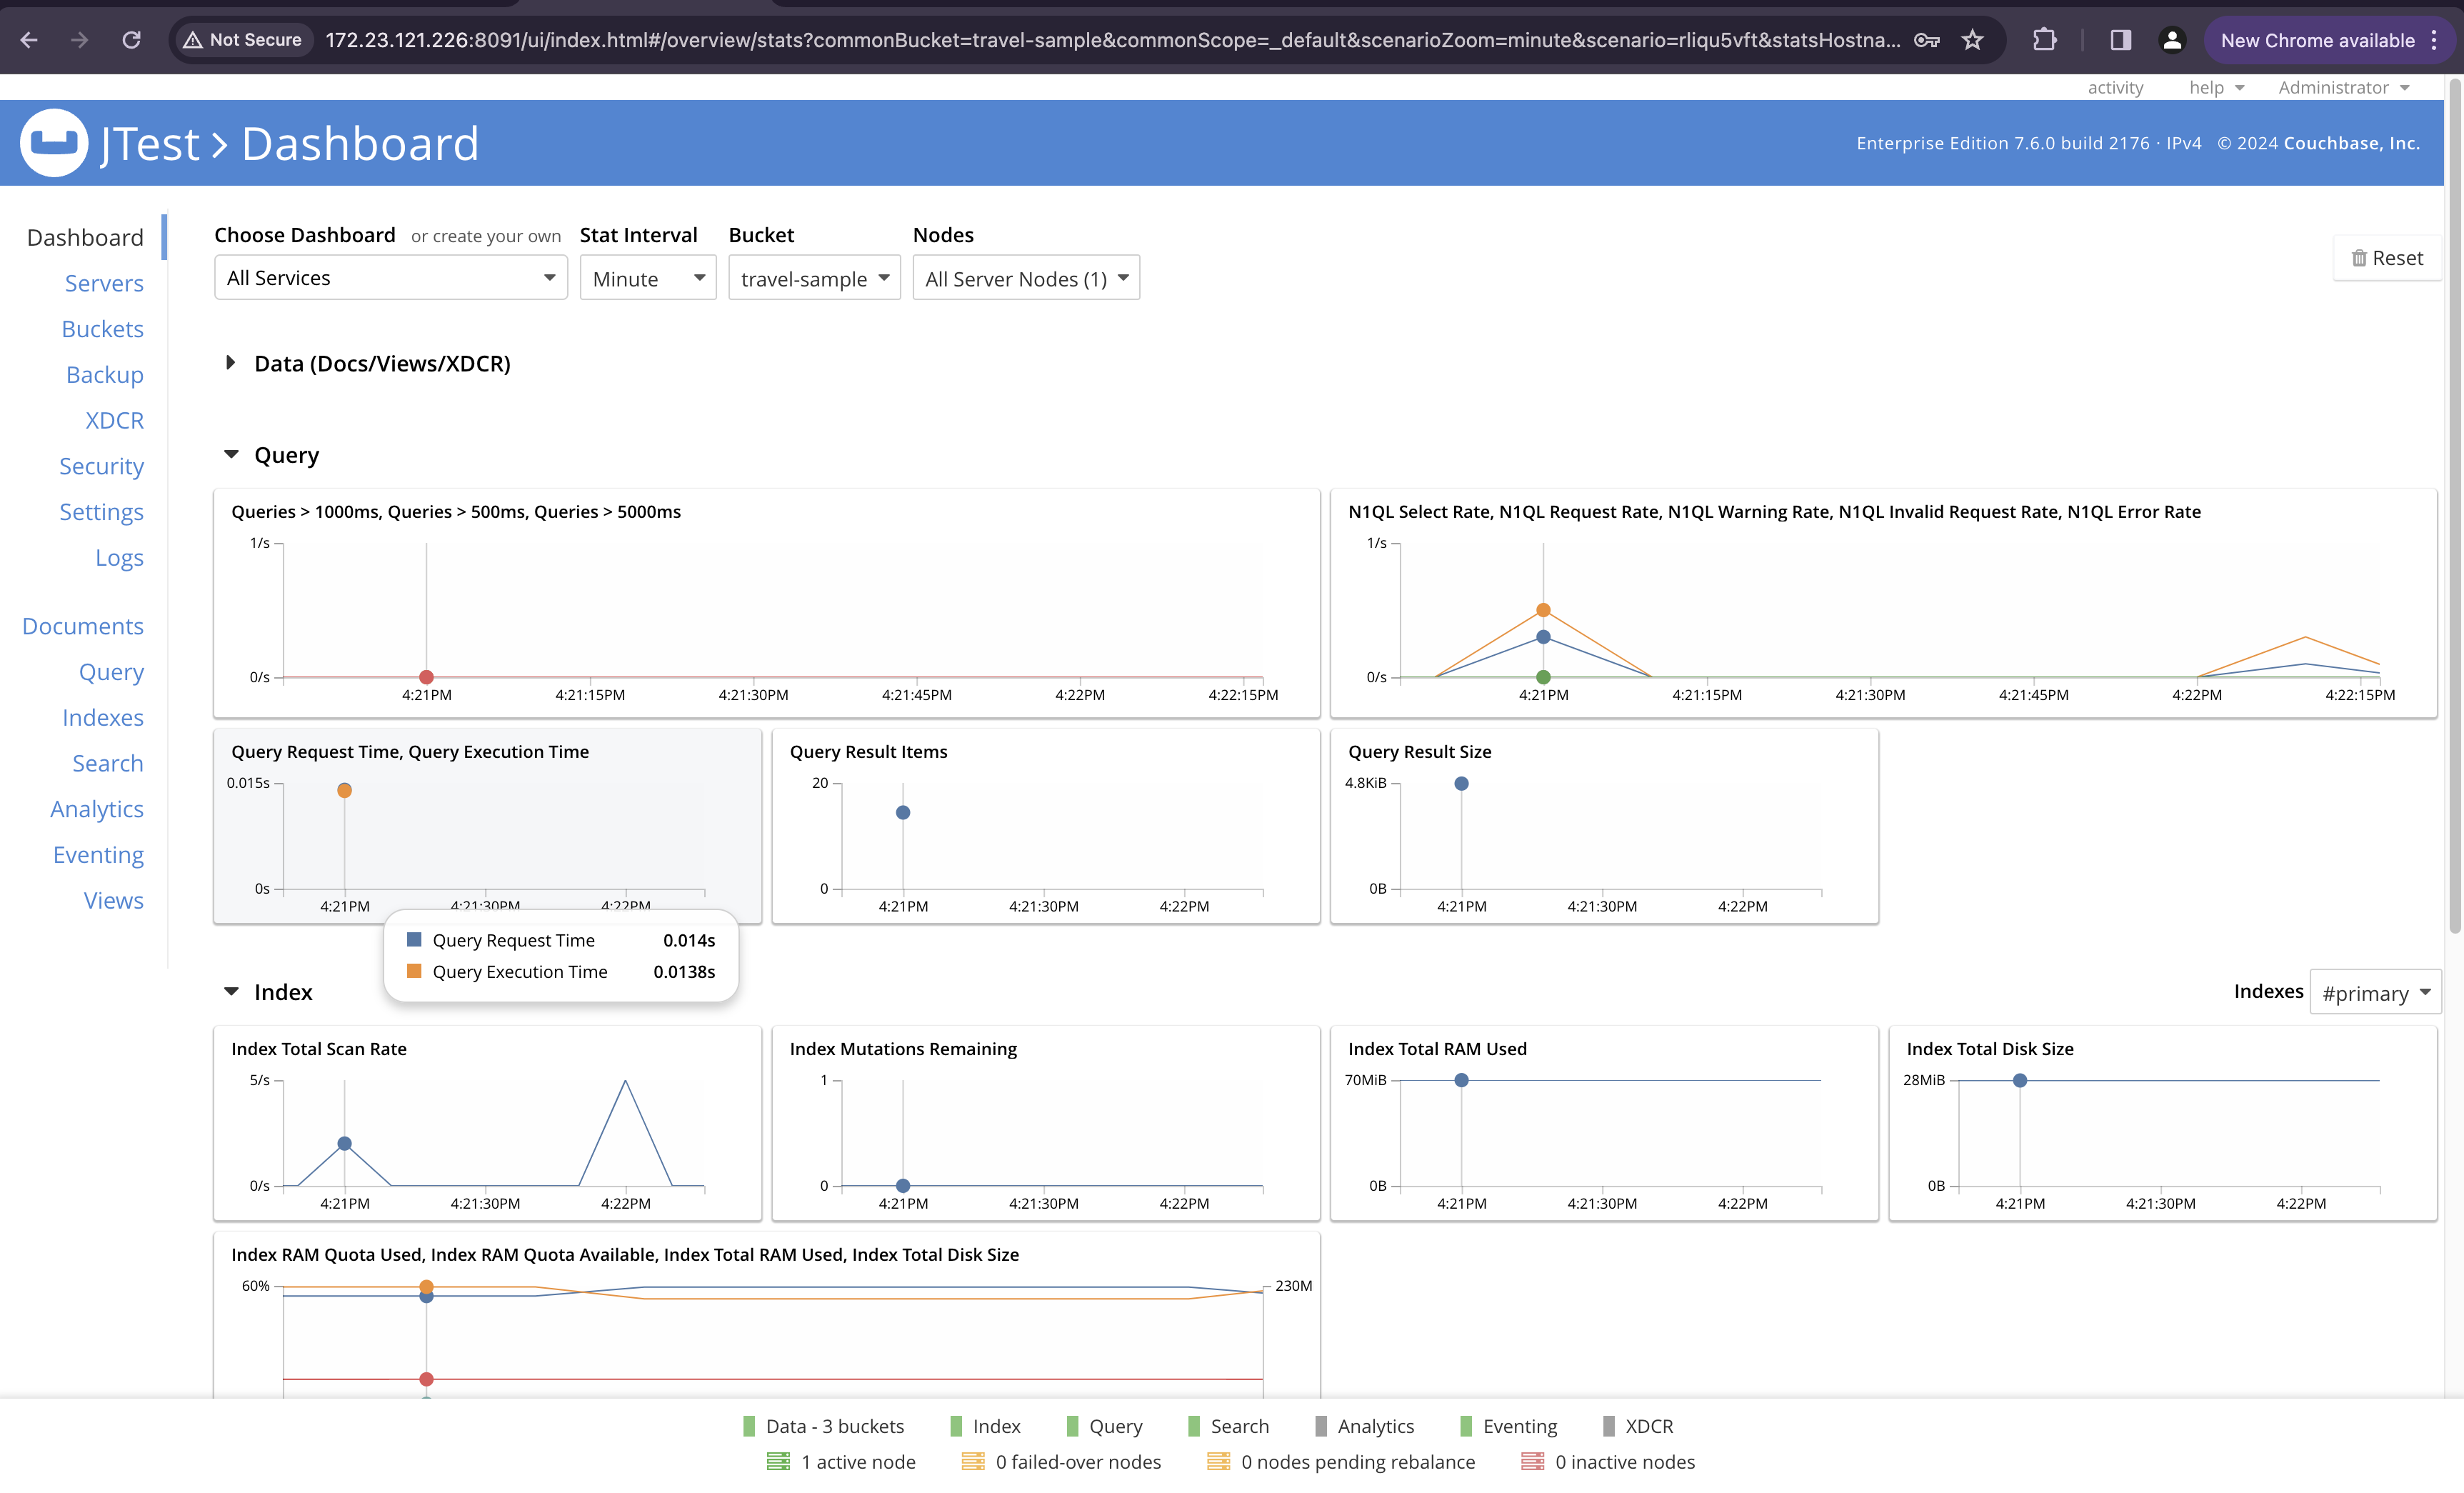
      These are derived metrics that are calculated on the fly by ns_server the following way (the example shows req_time, other stats are calculated likewise):

      (sum n1ql_req_time across cluster) / (sum n1ql_requests across cluster)
      

      In order to show current value we should apply rate function to req_time and to number of requests (because rate shows change of the counter per second = number of new request):

      (sum rate(n1ql_req_time) across cluster) / (sum rate(n1ql_requests) across cluster)
      

      Attachments

        No reviews matched the request. Check your Options in the drop-down menu of this sections header.

        Activity

          People

            jyotsna.nayak Jyotsna Nayak
            timofey.barmin Timofey Barmin
            Votes:
            0 Vote for this issue
            Watchers:
            4 Start watching this issue

            Dates

              Created:
              Updated:
              Resolved:

              Gerrit Reviews

                There are no open Gerrit changes

                PagerDuty