Details
-
Bug
-
Resolution: Not a Bug
-
 Major
Major
-
7.6.0
-
Untriaged
-
0
-
Unknown
Description
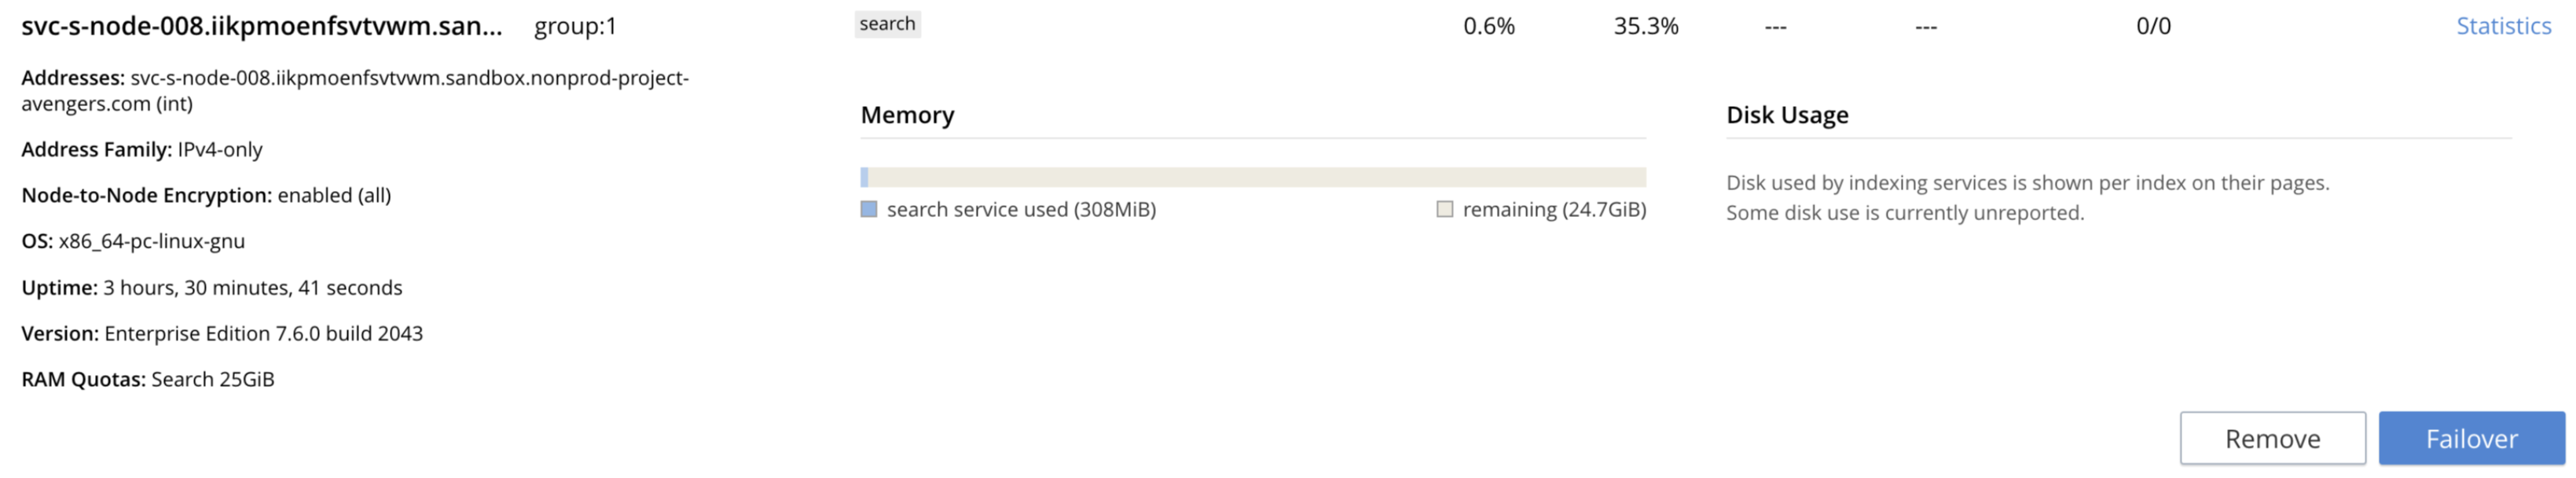
Build: 7.6.0-2043
the RAM utilisation% on the server ui shows 35% while the "search service used" field shows 308 Mib which is <2%.
The discrepancy in both of these metrics was not temporary and remained the same throughout the life of the cluster.
This in turn also affected the node graphs for RAM utilisation and the RAM utlisation metric on Capella as well.
Also if I directly get stats from nsstats, I get the expected RAM%, i.e. 1.2%
https://svc-s-node-008.iikpmoenfsvtvwm.sandbox.nonprod-project-avengers.com:18094/api/nsstats -k | jq | grep pct_used_ram % Total % Received % Xferd Average Speed Time Time Time Current Dload Upload Total Spent Left Speed 100 1810 100 1810 0 0 1709 0 0:00:01 0:00:01 {}:{}:{} 1727 "pct_used_ram": 1.2282013300720405
