Details
-
Bug
-
Resolution: Fixed
-
 Critical
-
7.6.0, 7.2.4
-
Untriaged
-
0
-
Unknown
Description
After MB-58069, the sys_cpu_utilization_rate and sysproc_cpu_utilization_rate metrics were replaced with Prometheus recording rules and started being derived from sys_cpu_seconds_total monotonic counters of time spent per CPU mode.
Since the old metrics were expressed in overall CPU utilisation (sys_cpu_utilization_rate, out of 100%) and (sysproc_cpu_utilization_rate, out of X00%, X = num CPUs), and the metrics sys_cpu_seconds_total are not, these had to be adapted.
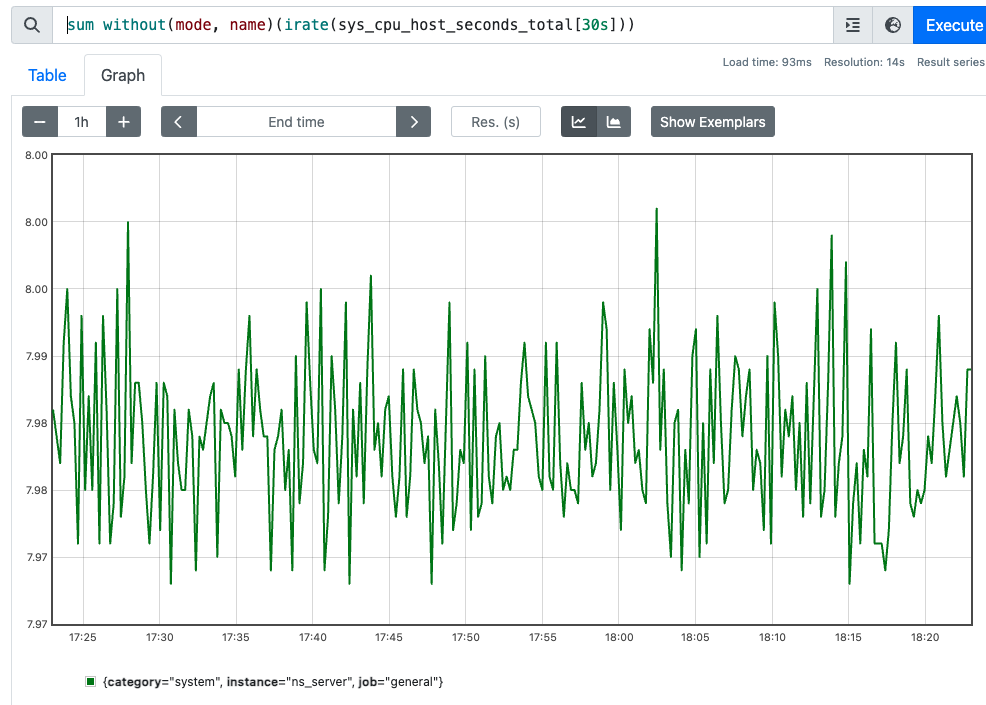
To calculate the overall CPU utilisation, the recording rules use sys_cpu_host_cores_available to divide the seconds per CPU by (1s * num_cpus), resulting in value [0-100].
I've noticed in MB-60533, where the Xen HVM hypervisor is used, that the sys_cpu_host_cores_available can be reported as what appears to be the number of CPUs on the hypervisor host.
Checking /proc/interrupts and /proc/zoneinfo, or /sys/fs/cgroup/cpuset.cpus.effective:0-7, we see we have 8 CPUs. However, if we check Cpus_allowed_list for each process, we do see the number of CPUs on which tasks can be scheduled is 64. I'm not sure if that is what erlang uses for it's :erlang.system_info(:logical_processors). The code is in a NIF here: https://github.com/erlang/otp/blob/413da54ce2eca7c40786871859b87930cc21d239/erts/lib_src/common/erl_misc_utils.c#L262
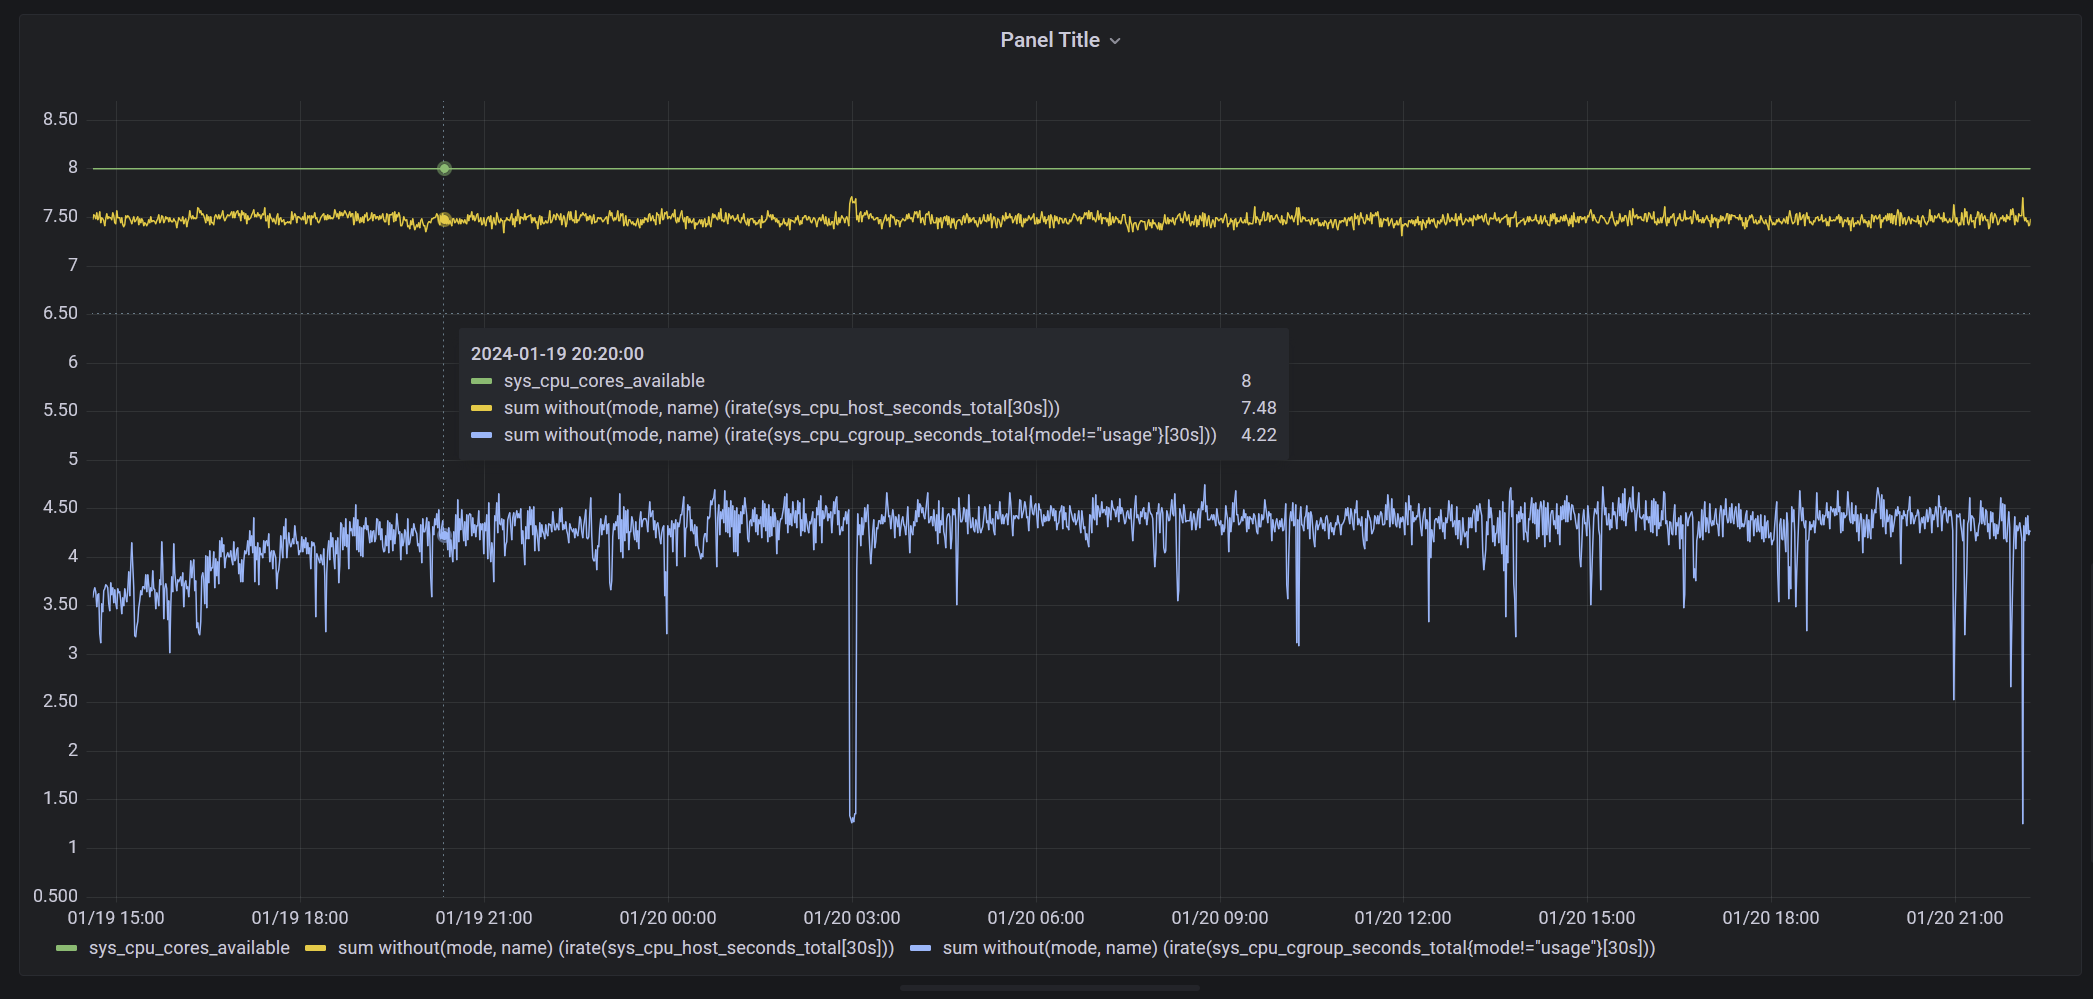
However, all of this seems to result in incorrect metrics. Here's a screenshot of:
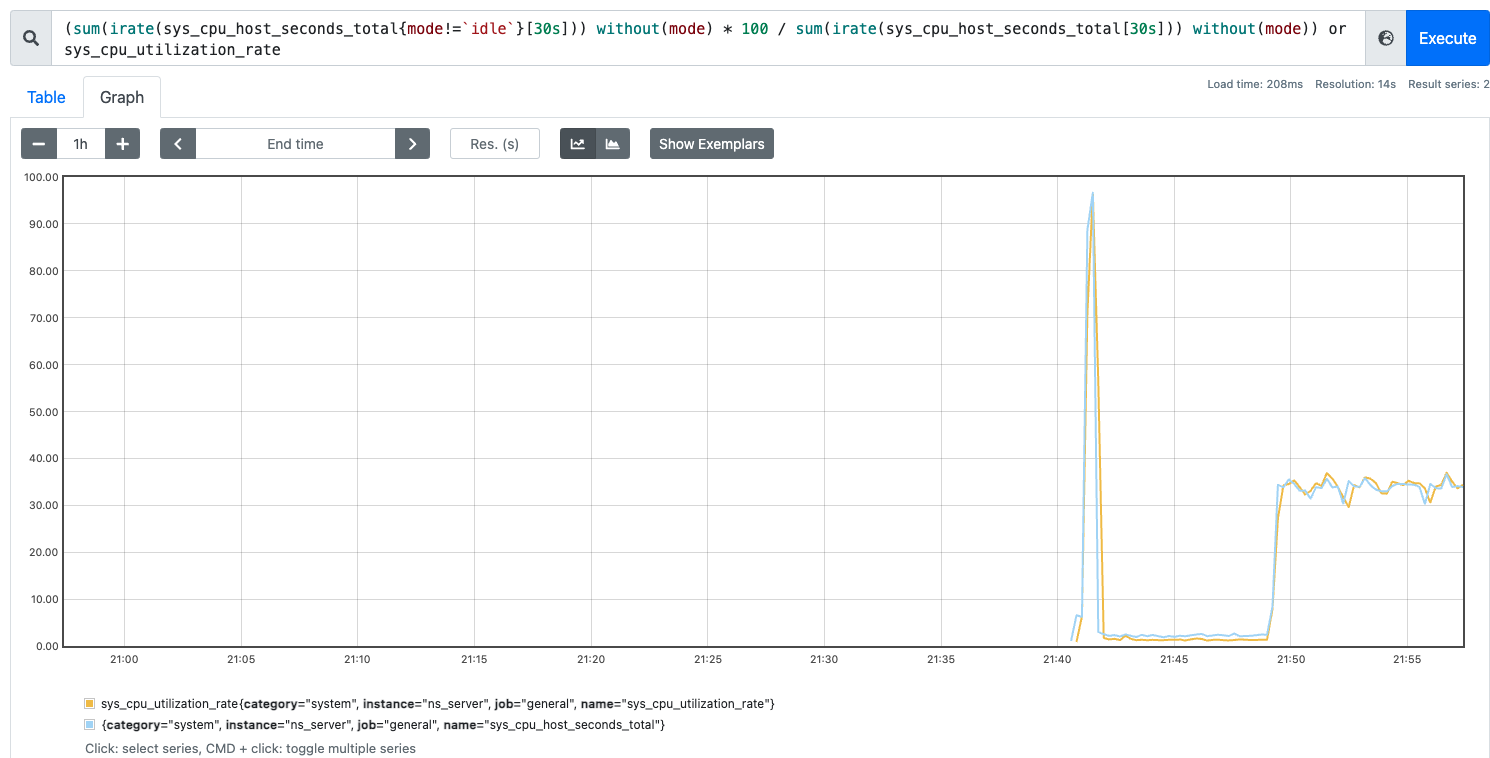
- sys_cpu_utilization_rate = 94% (which uses max of values derived from 3. and 4.)
- sys_cpu_host_utilization_rate = 94% (which is based on 3.)
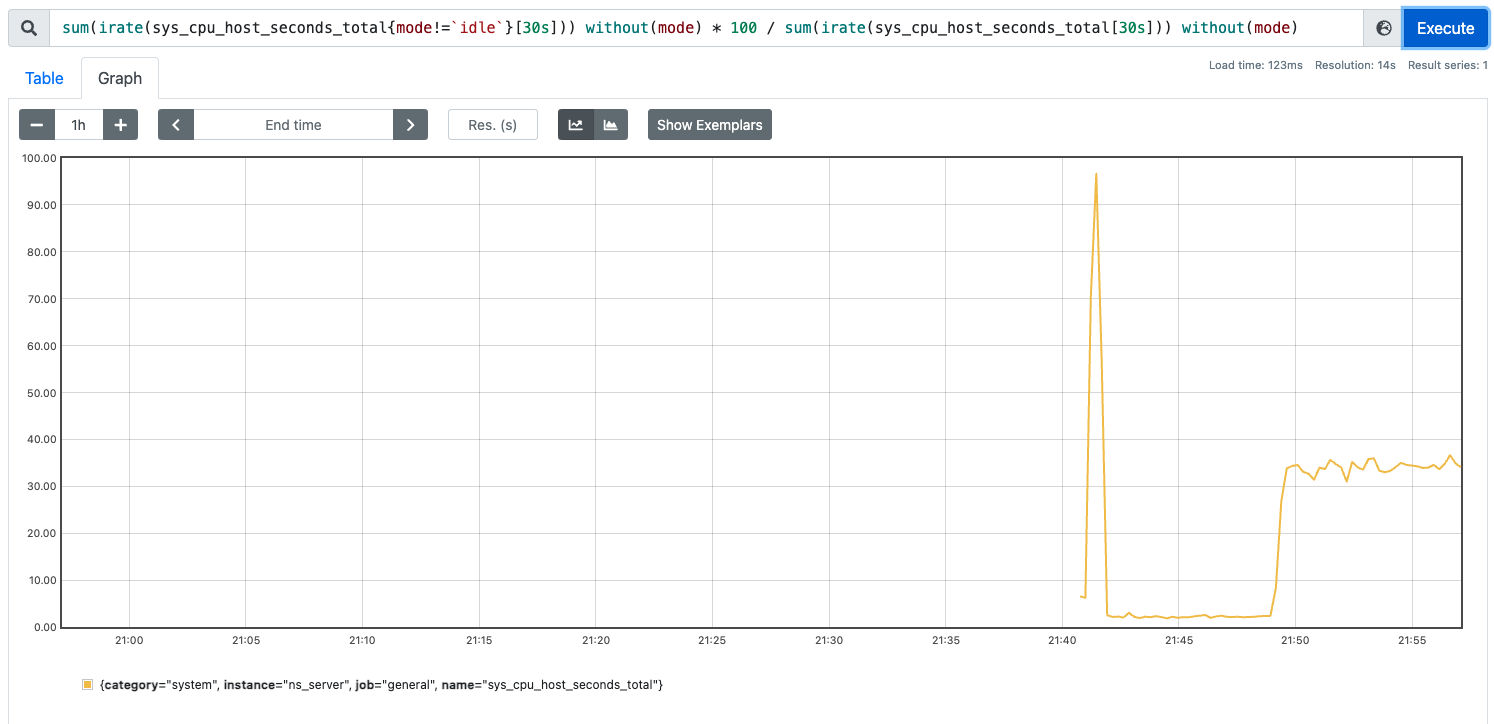
- 100 - (irate(sys_cpu_host_seconds_total{mode=`idle`}[30s]) / ignoring(name,mode) sys_cpu_host_cores_available * 100) (which is the LHS of the sys_cpu_utilization_rate max())
- irate(sys_cpu_cgroup_seconds_total{mode=`usage`}[30s]) / ignoring(name,mode) sys_cpu_cores_available * 100 (which is the RHS of the sys_cpu_utilization_rate max())
- sys_cpu_cores_available = 8 (the VM guest)
- sys_cpu_host_cores_available = 64 (the VM host)
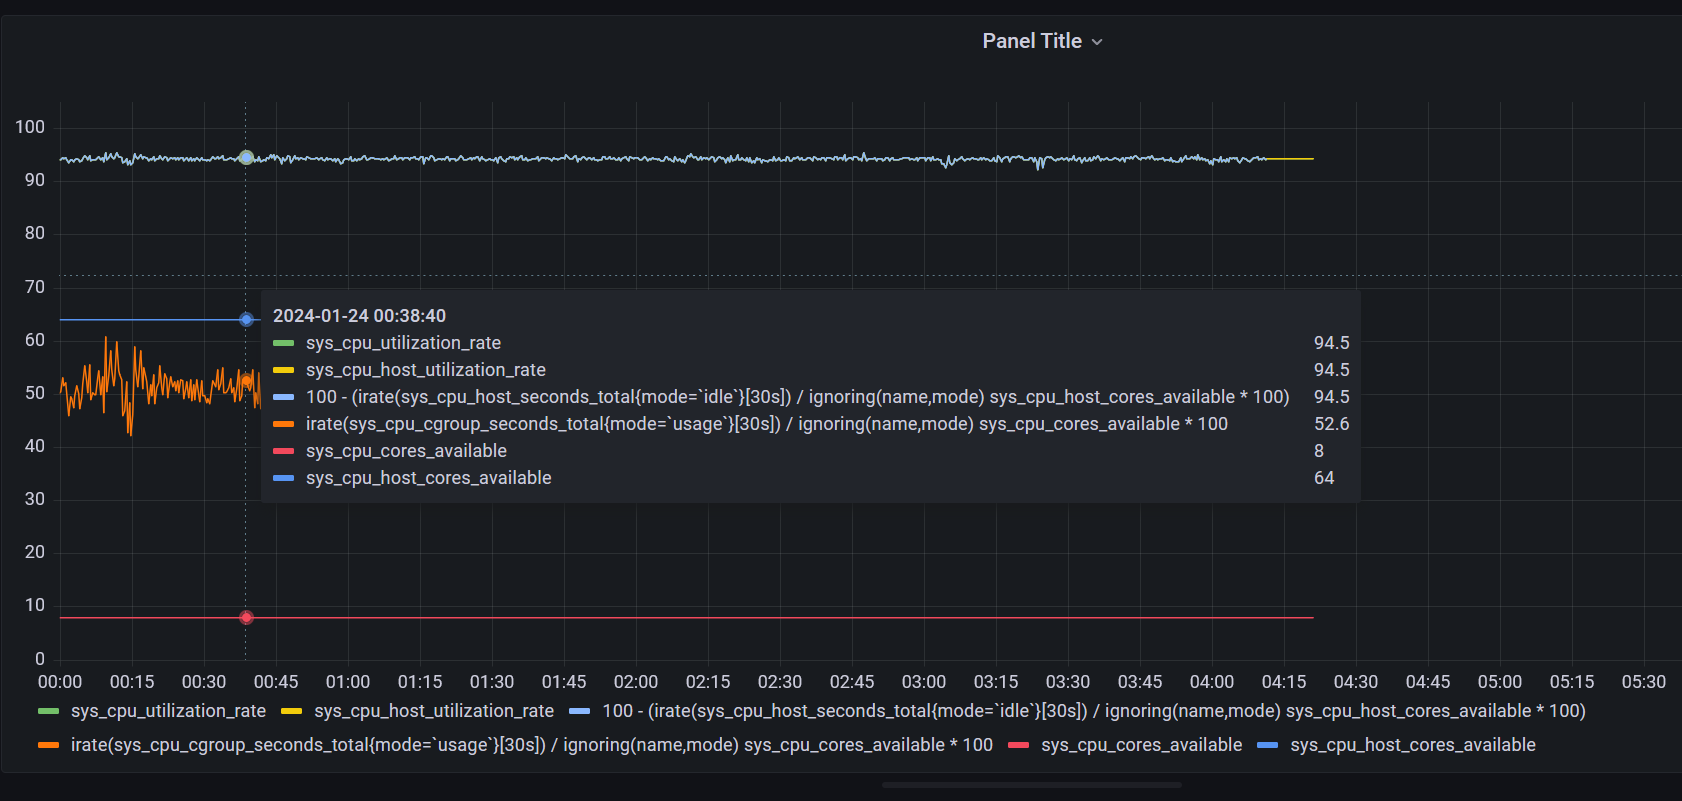
In this instance, I believe the correct value to display for both cpu utilisation rates is 52.6. If we sum the processes tracked by sys_cpuproc_utilisation_rate, the result is ~400% which is also 50% of 8 CPUs. However, 94.5 is displayed instead, which is the result of dividing by 64 and subtracting that from 1, resulting in a larger value.