Details
-
Bug
-
Resolution: Unresolved
-
 Minor
Minor
-
7.6.0
-
None
-
Untriaged
-
0
-
Unknown
Description
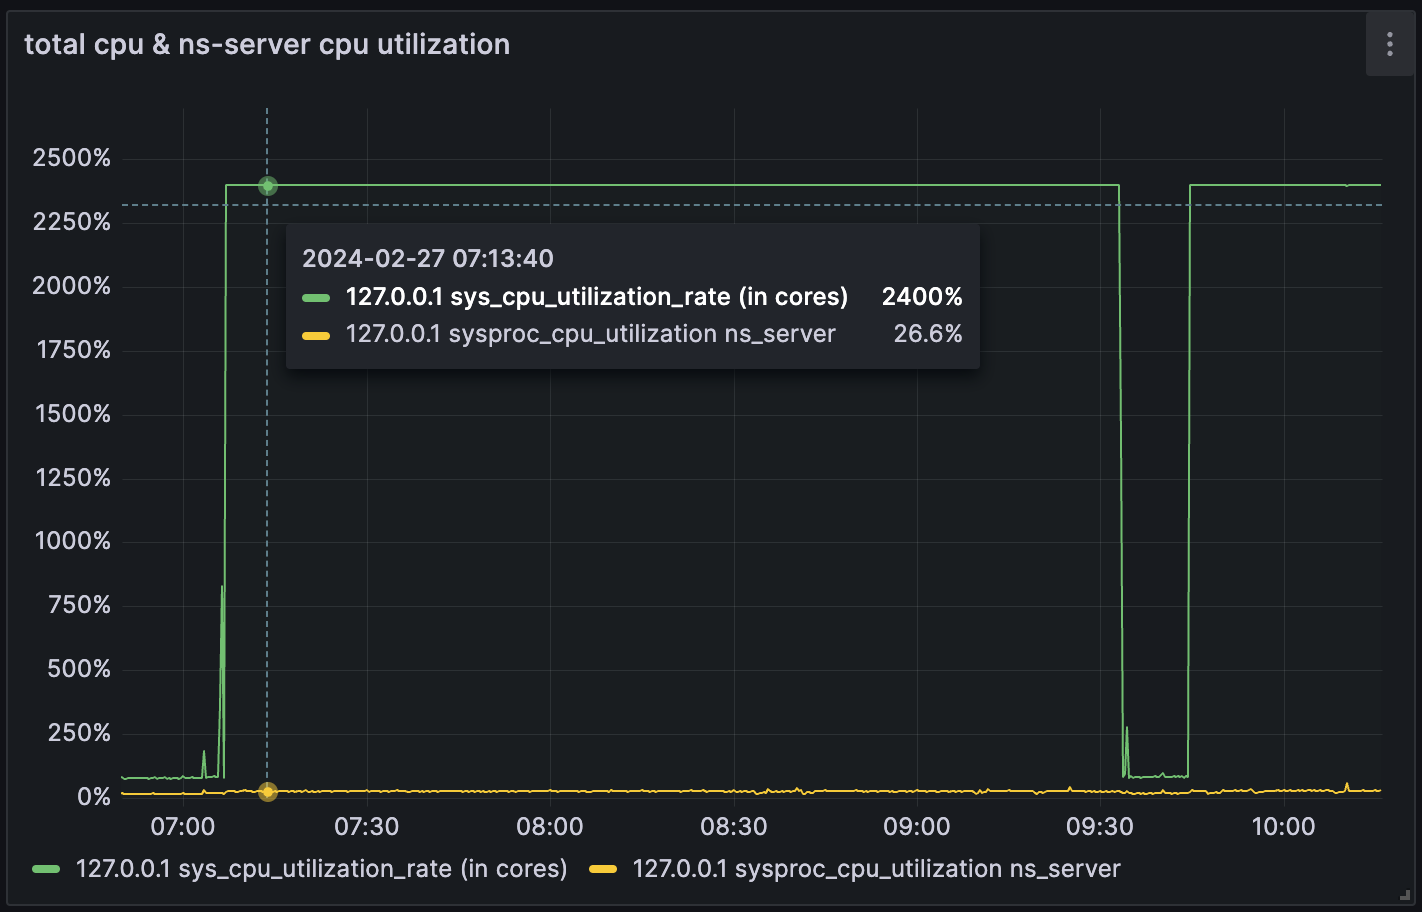
When running a "continuous vector search" it seems like the ns_server component on a single node (source build from Feb 23 05:30) on a debian 11 bullseye system 24vCPU 64GB system (2x nvme non-cloud) somehow doesn't respond "promptly".
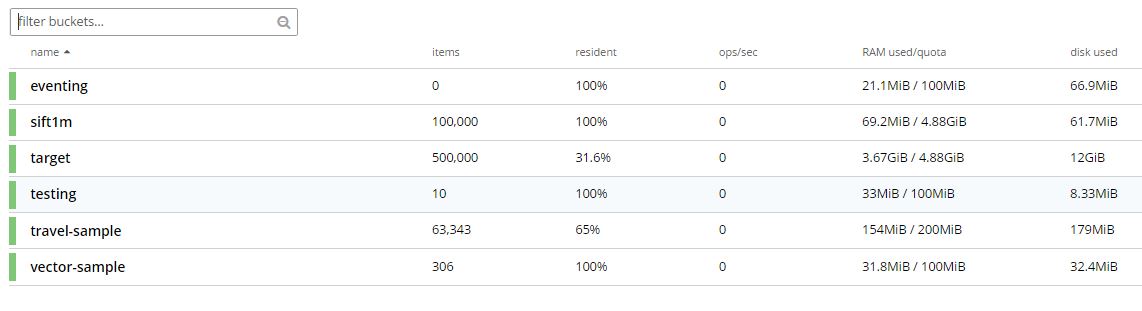
If I stop the "continuous vector search" the system behaves correctly and flush is fast. Not there are no KV ops although KV and Search are running on the same node on this single node system.
Since Search is operating on port 8094 accessing a different bucket 'target' and ns_server on 8091 trying to flush a bucket 'testing' with just 10 items I wouldn't expect this behaviour
From the UI's onprem log
Flushing "testing" failed with error:
|
{error,{flush_wait_failed,['ns_1@127.0.0.1'],[]}}ns_orchestrator 000ns_1@127.0.0.110:08:43 AM 27 Feb, 2024
|
Flushing bucket "testing" from node 'ns_1@127.0.0.1'ns_orchestrator 000ns_1@127.0.0.110:07:43 AM 27 Feb, 2024
|
I will attach a /cbcollect "cbcollect_issue_with_flush_while_heavy_vector_search.zip" when it is complete. It was over 150MB so I had to split it (sorry)
split -n 2 cbcollect_issue_with_flush_while_heavy_vector_search.zip
|
ls -ltr cbcollect_issue_with_flush_while_heavy_vector_search.zip xaa xab
|
-rw-r--r-- 1 root root 160787912 Feb 27 10:38 cbcollect_issue_with_flush_while_heavy_vector_search.zip
|
-rw-r--r-- 1 linuxbrew linuxbrew 80393956 Feb 27 10:43 xaa
|
-rw-r--r-- 1 linuxbrew linuxbrew 80393956 Feb 27 10:43 xab
|
Top output during the load (after all the images)
top - 10:30:35 up 11 days, 16:54, 9 users, load average: 74.18, 72.69, 70.69
|
Tasks: 379 total, 4 running, 375 sleeping, 0 stopped, 0 zombie
|
%Cpu(s): 98.4 us, 1.5 sy, 0.0 ni, 0.0 id, 0.0 wa, 0.0 hi, 0.1 si, 0.0 st
|
MiB Mem : 64198.9 total, 18342.4 free, 24700.9 used, 21155.7 buff/cache
|
MiB Swap: 65433.0 total, 62388.9 free, 3044.1 used. 37475.0 avail Mem PID USER PR NI VIRT RES SHR S %CPU %MEM TIME+ COMMAND
|
369345 linuxbr+ 20 0 45.1g 16.3g 886500 R 2274 25.9 4429:51 cbft
|
355737 linuxbr+ 20 0 6480800 322216 46120 S 32.5 0.5 202:11.70 beam.smp
|
375156 root 20 0 109076 29604 10404 R 29.6 0.0 0:16.65 python3
|
356167 linuxbr+ 20 0 12.4g 4.2g 18740 S 22.5 6.6 231:21.98 memcached
|
240219 linuxbr+ 20 0 1352160 53856 7512 R 22.2 0.1 1015:23 python3.11
|
356082 linuxbr+ 20 0 4182296 283692 39124 S 16.7 0.4 185:44.10 indexer
|
374660 linuxbr+ 20 0 2129800 22244 11360 S 3.2 0.0 1:25.15 cb_fts_bench
|
355956 linuxbr+ 20 0 1818204 158640 51480 S 1.6 0.2 17:36.96 prometheus
|
380089 linuxbr+ 20 0 10396 4020 3224 R 1.3 0.0 0:00.15 top
|
356108 linuxbr+ 20 0 6901240 100452 66748 S 1.0 0.2 9:07.71 cbq-engine
|
858 root 20 0 2169664 11884 5608 S 0.6 0.0 27:33.44 containerd
|
356063 linuxbr+ 20 0 2140372 45060 33292 S 0.6 0.1 4:56.70 goxdcr
|
12 root 20 0 0 0 0 I 0.3 0.0 16:21.10 rcu_sched
|
63 root 20 0 0 0 0 S 0.3 0.0 0:36.01 ksoftirqd/10
|
123 root 20 0 0 0 0 S 0.3 0.0 0:27.66 ksoftirqd/22
|
The system HW
Architecture: x86_64
|
CPU op-mode(s): 32-bit, 64-bit
|
Byte Order: Little Endian
|
Address sizes: 46 bits physical, 48 bits virtual
|
CPU(s): 24
|
On-line CPU(s) list: 0-23
|
Thread(s) per core: 2
|
Core(s) per socket: 12
|
Socket(s): 1
|
NUMA node(s): 1
|
Vendor ID: GenuineIntel
|
CPU family: 6
|
Model: 86
|
Model name: Intel(R) Xeon(R) CPU D-1567 @ 2.10GHz
|
Stepping: 4
|
CPU MHz: 2400.107
|
CPU max MHz: 2700.0000
|
CPU min MHz: 800.0000
|
BogoMIPS: 4200.18
|
Virtualization: VT-x
|
L1d cache: 384 KiB
|
L1i cache: 384 KiB
|
L2 cache: 3 MiB
|
L3 cache: 18 MiB
|
NUMA node0 CPU(s): 0-23
|