Details
-
Improvement
-
Resolution: Unresolved
-
 Critical
-
None
-
0
Description
Some of the important node level metrics are very useful to be able to see per node. The list of stats can be found below.
E.g. customer needs to know which are some of my least loaded nodes where I can put indexes. There is no easy way to find it out from the admin console currently.
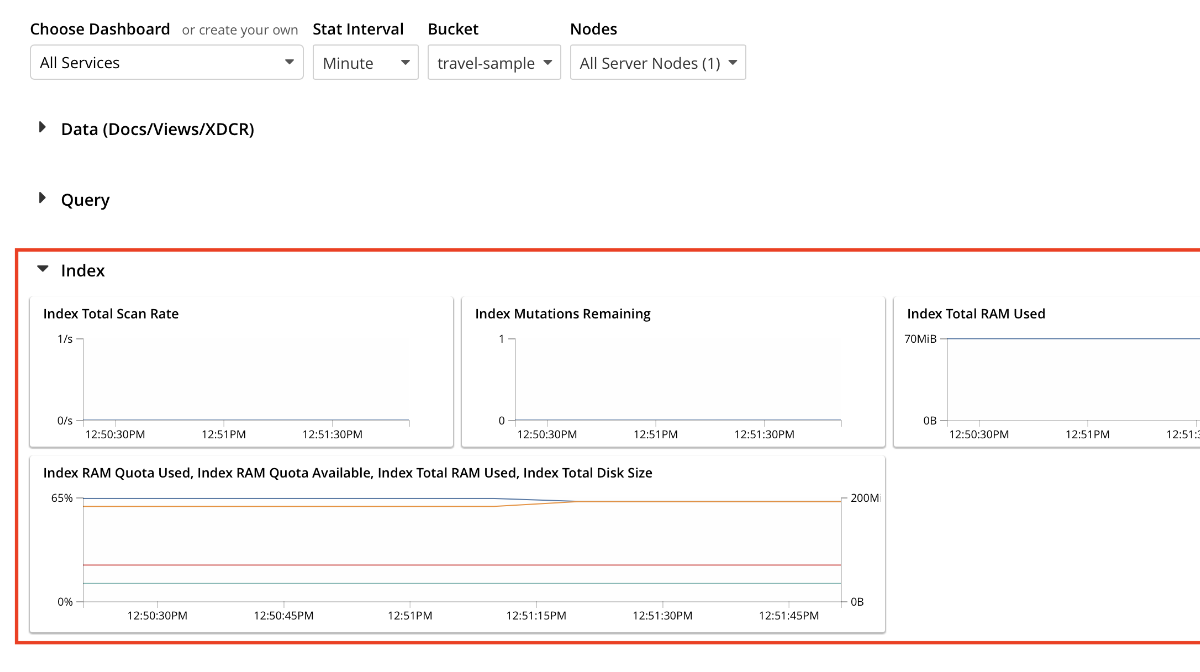
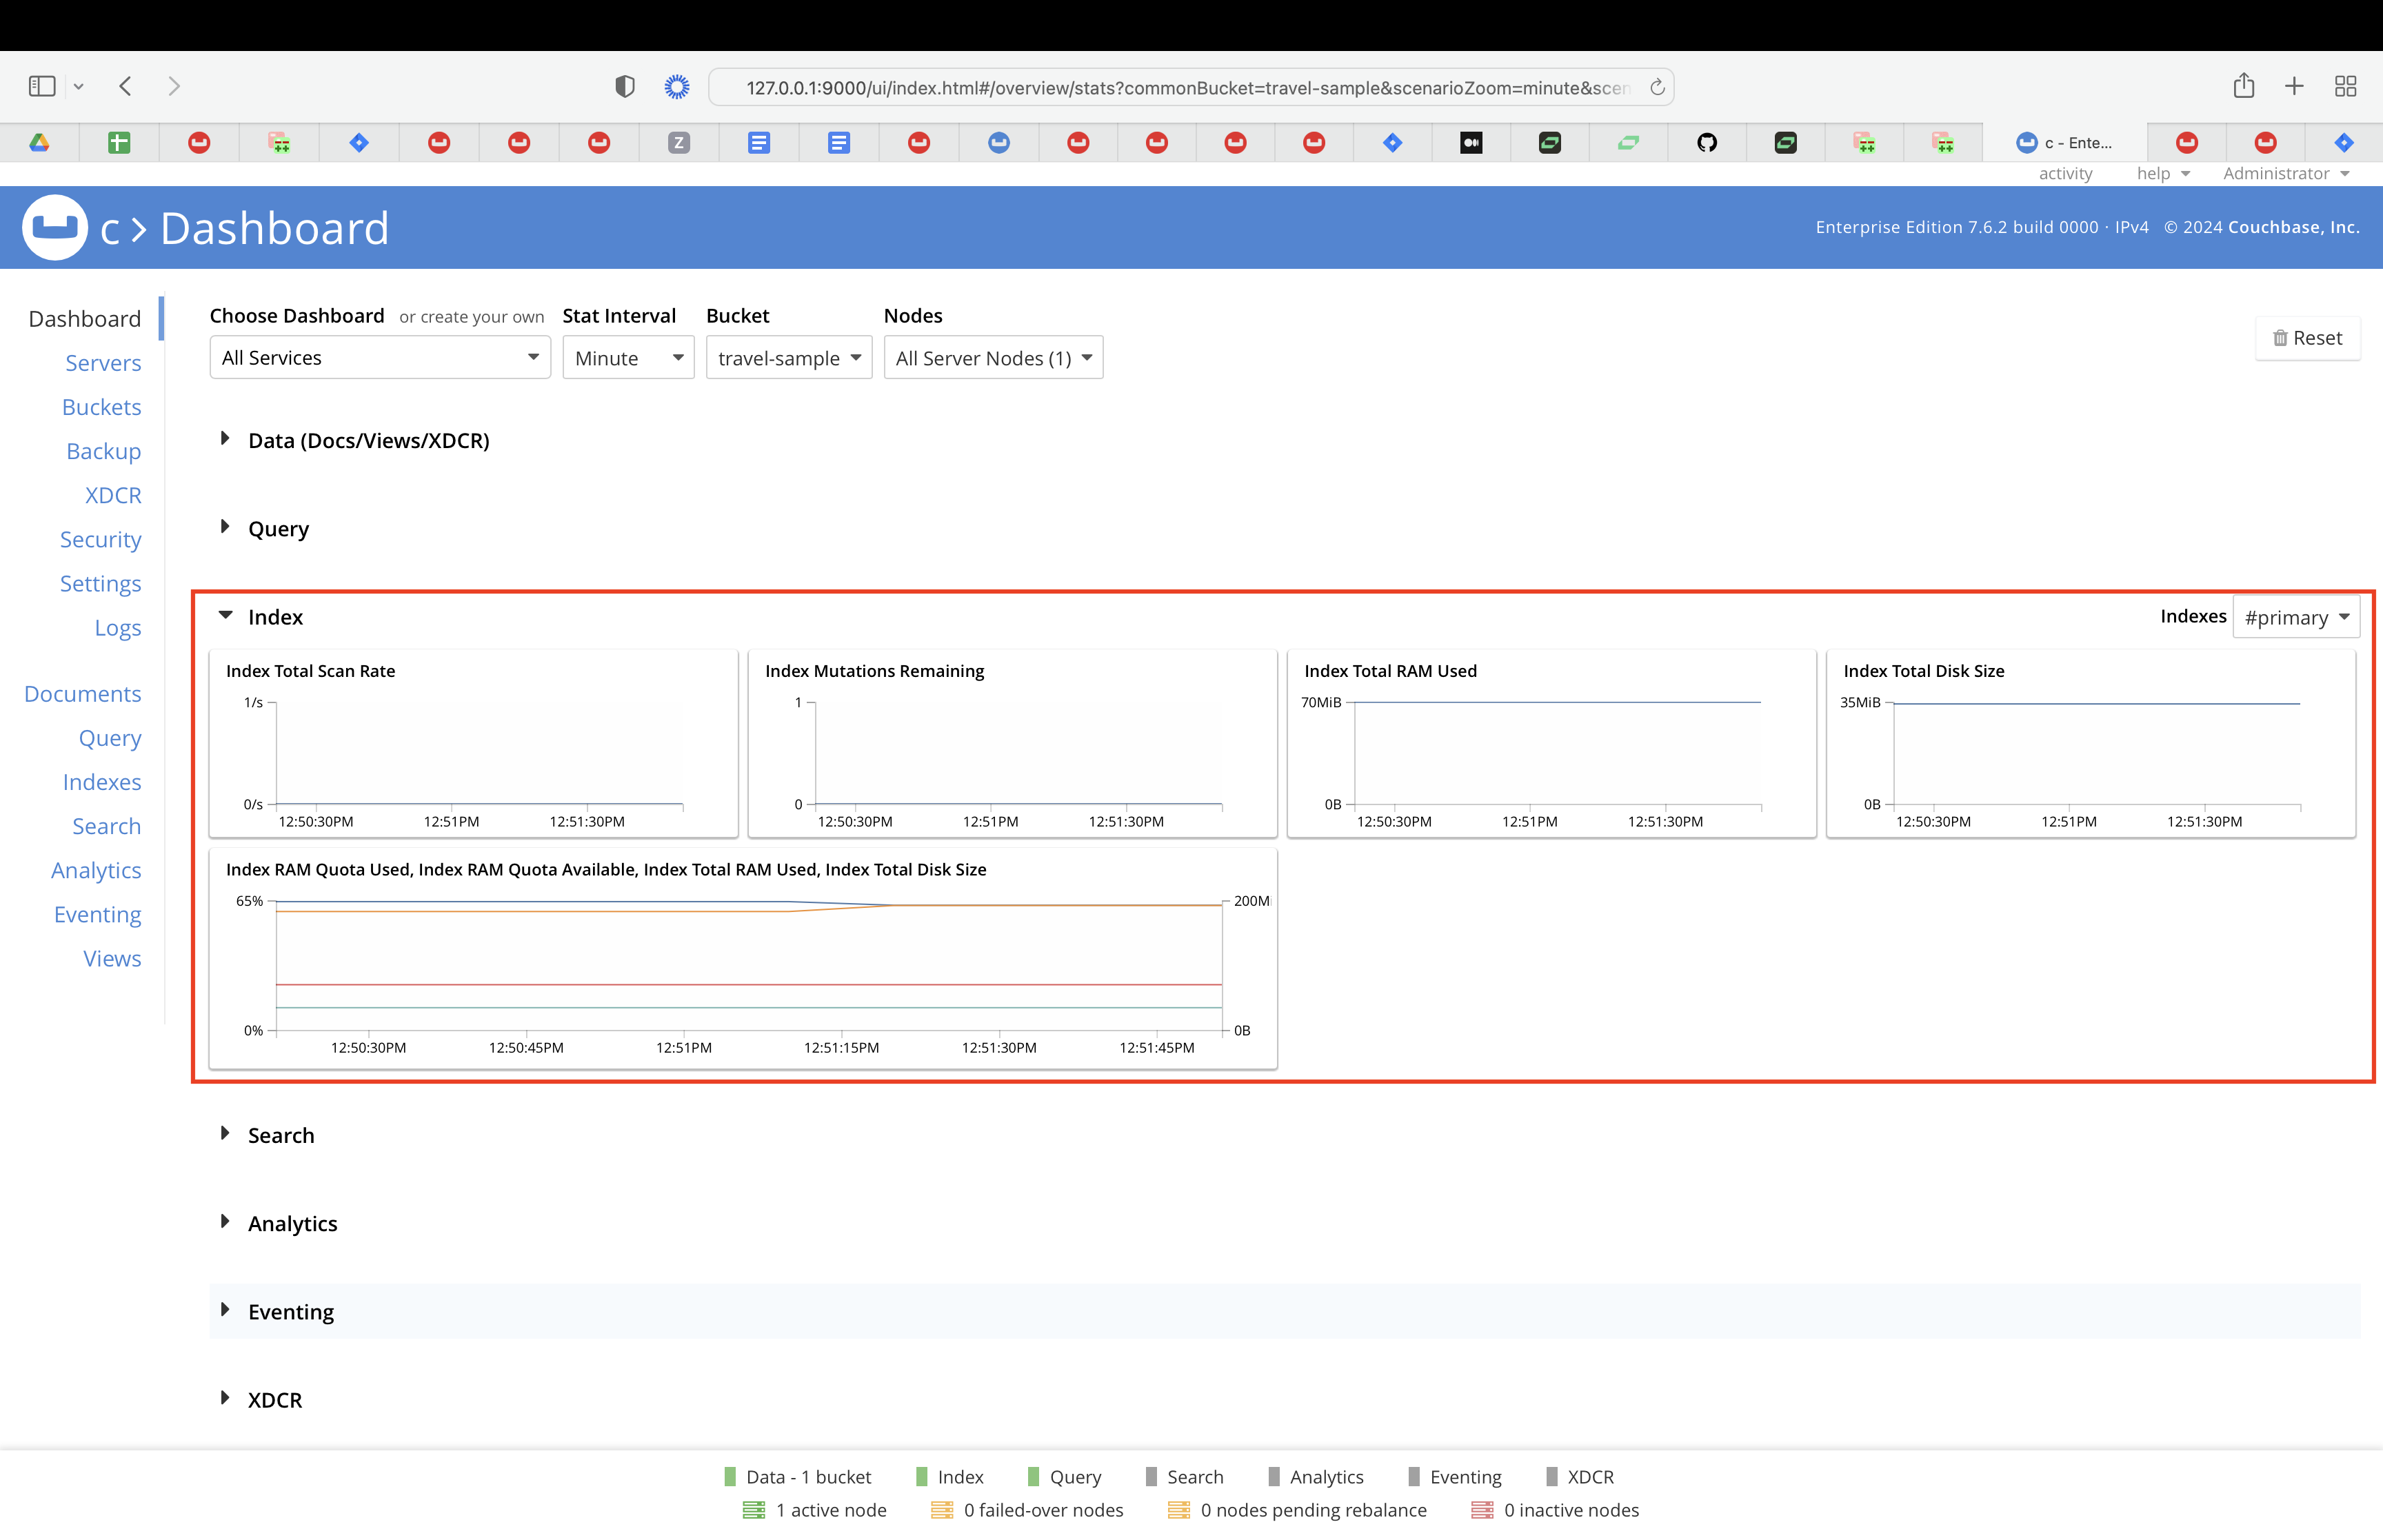
There is a “Dashboard” tab available and under “Index Service” there is an option to see “Total Disk Size”. We can add more relevant stats here to make it a proper dashboard. This can also be added to the node level dashboard.
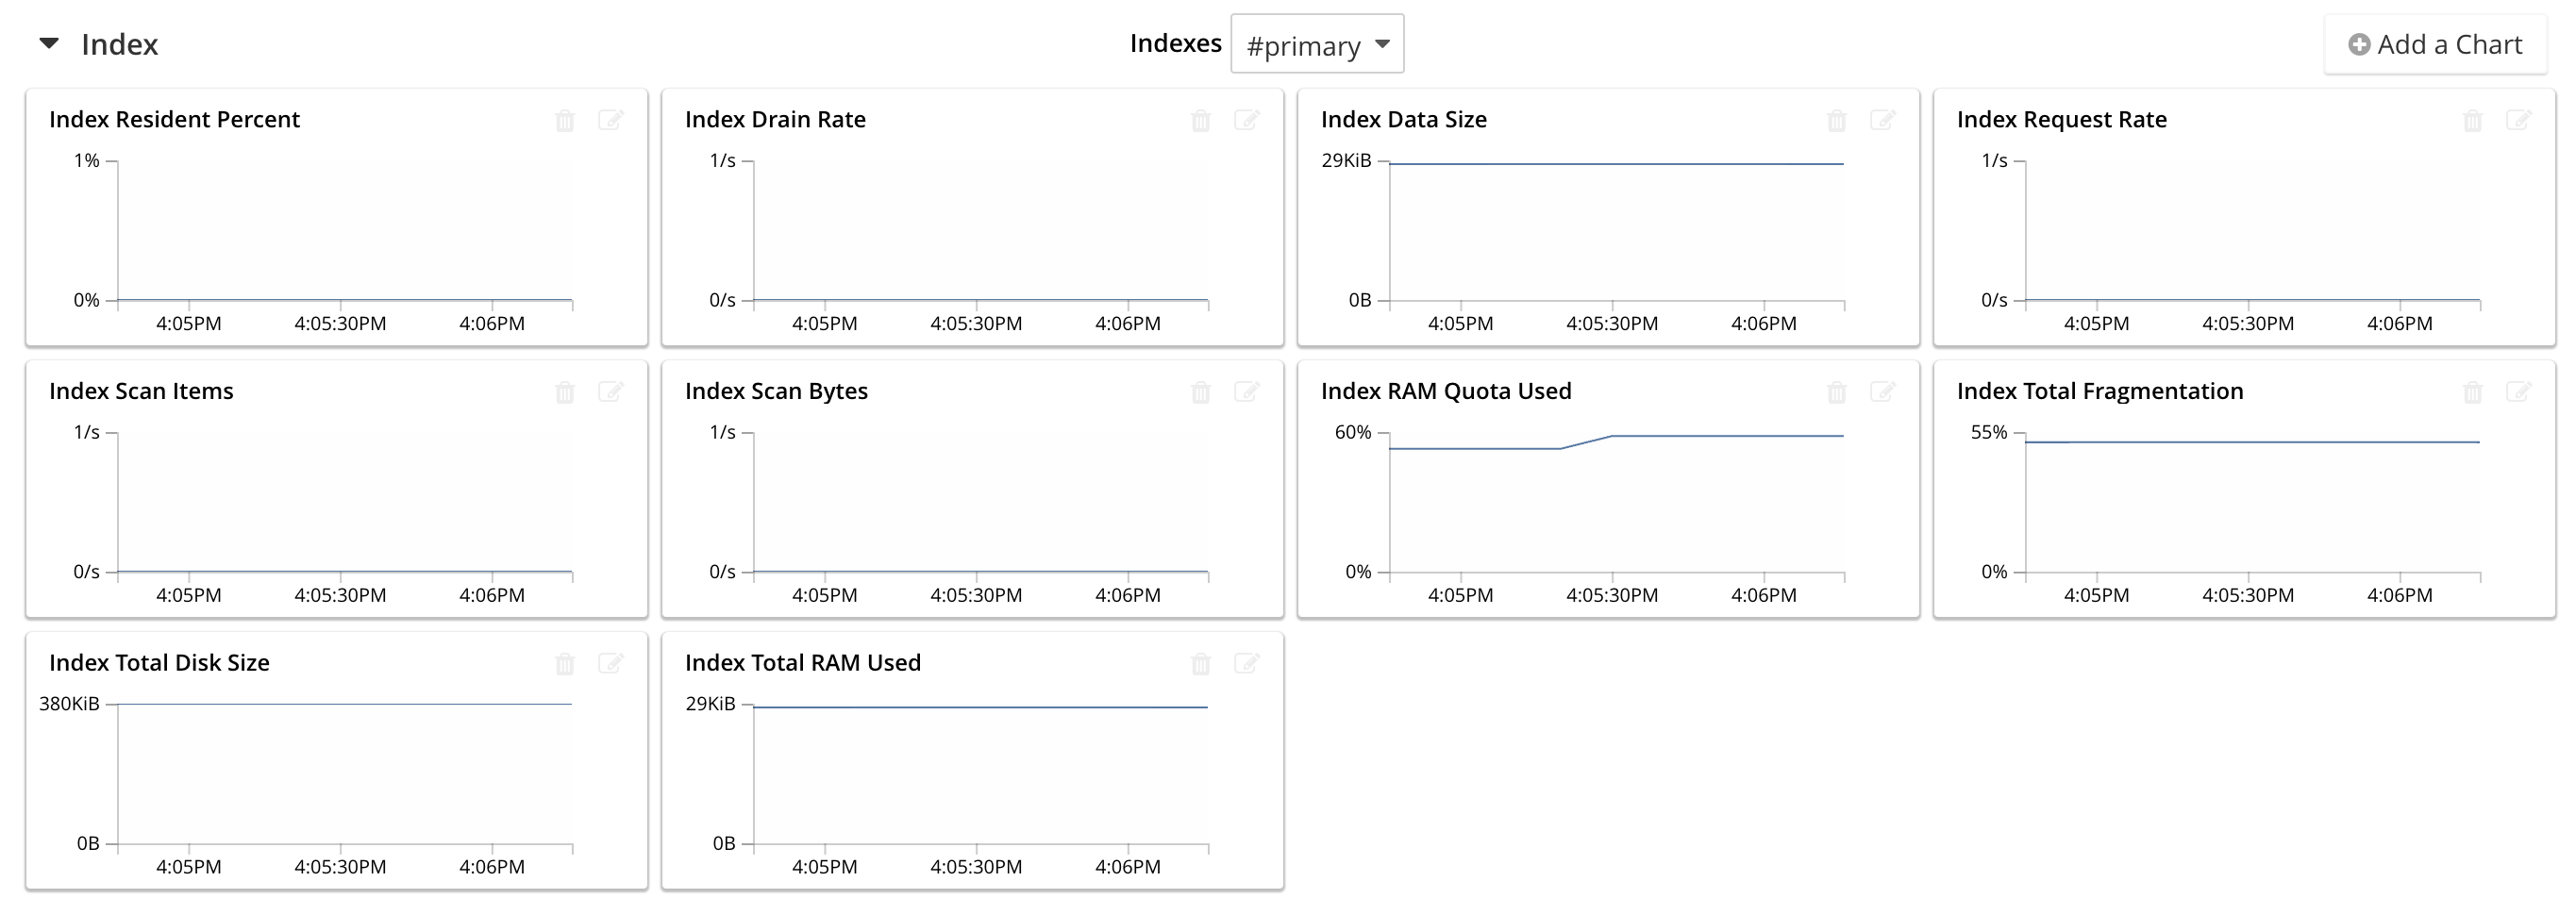
Stat list:
avg_resident_percent
total_drain_rate
total_data_size
total_requests
total_rows_returned
total_rows_scanned
avg_disk_bps
current_quota
num_indexes
memory_fragmentation (index_storage_lss_fragmentation)
memory_total_storage
reclaim_pending_global
Note: this improvement shall enable the customers to manage their node resources better.