Details
Description
Issues
-------------
- XDCR replication is stuck while replicating 1-2M items from source to destination.
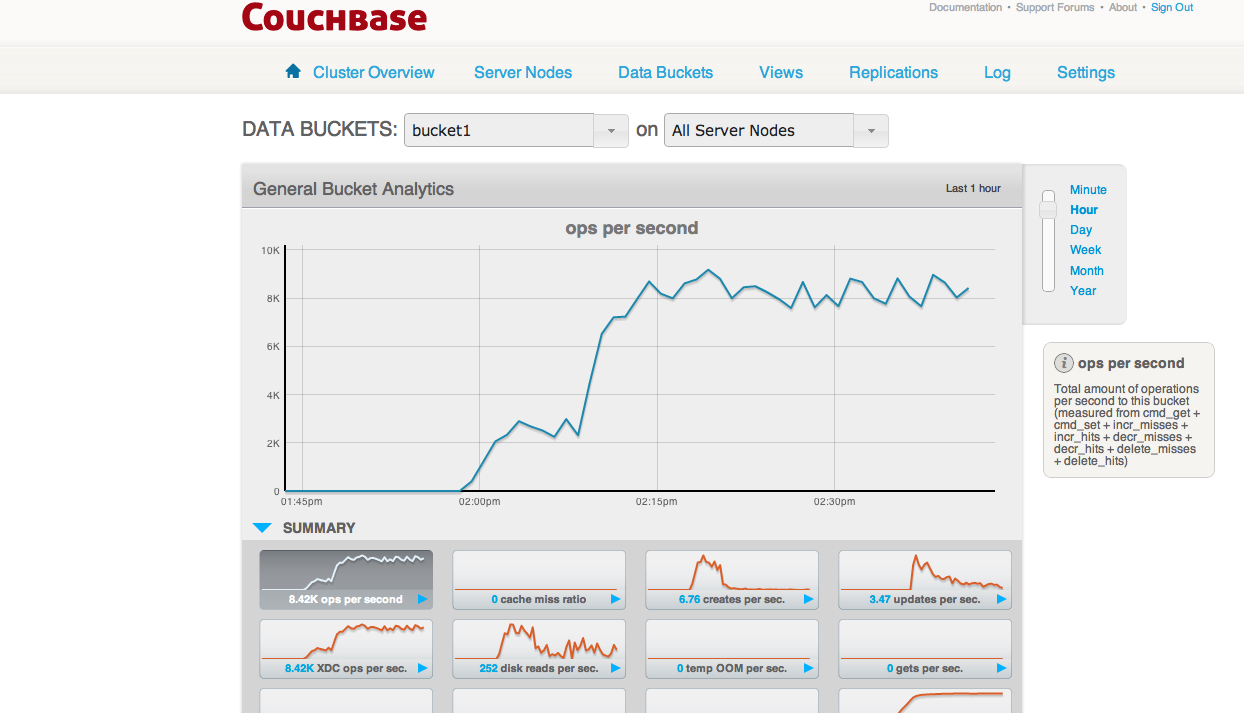
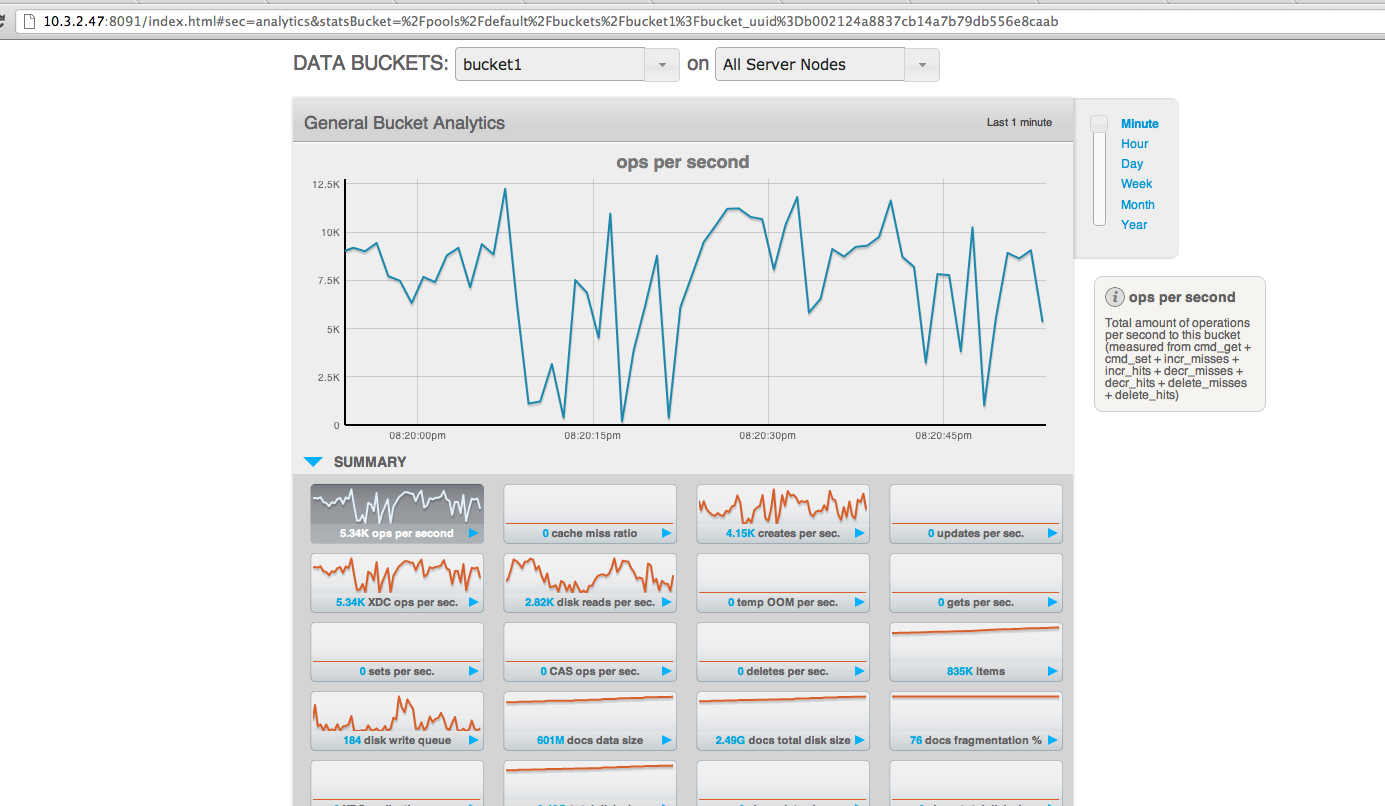
- Seeing very small creates/sec on destination cluster [Initial rate is 1-2K, drops to 0-20 items/sec.]
- Seeing number of timeouts at ns_server on destination logs.
This rate of replication is much slower than what we have seen earlier.
Repro steps
--------------------------
- Setup a 1:3 cluster and start unidirectional replication
- Load 1.5M items on source.
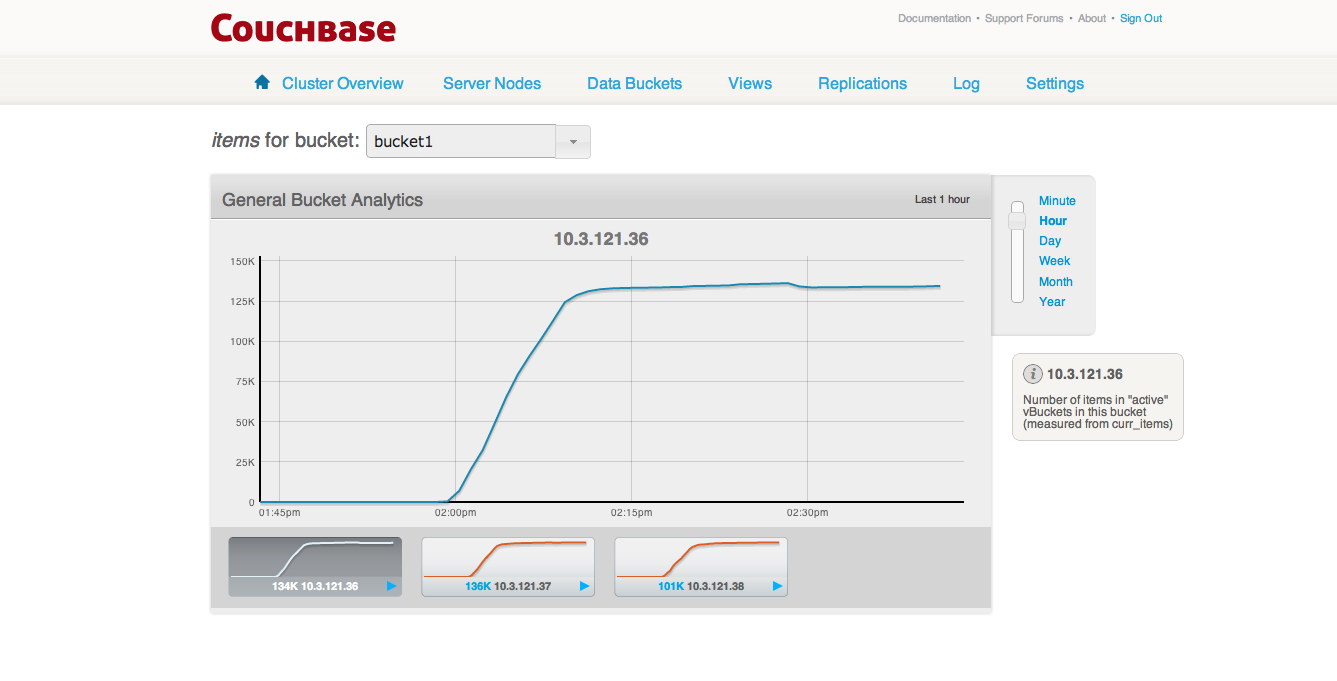
- Replicated 370K items on destination.
Replication has halted after replicating this data. [current creates range from 0-10 items/sec]
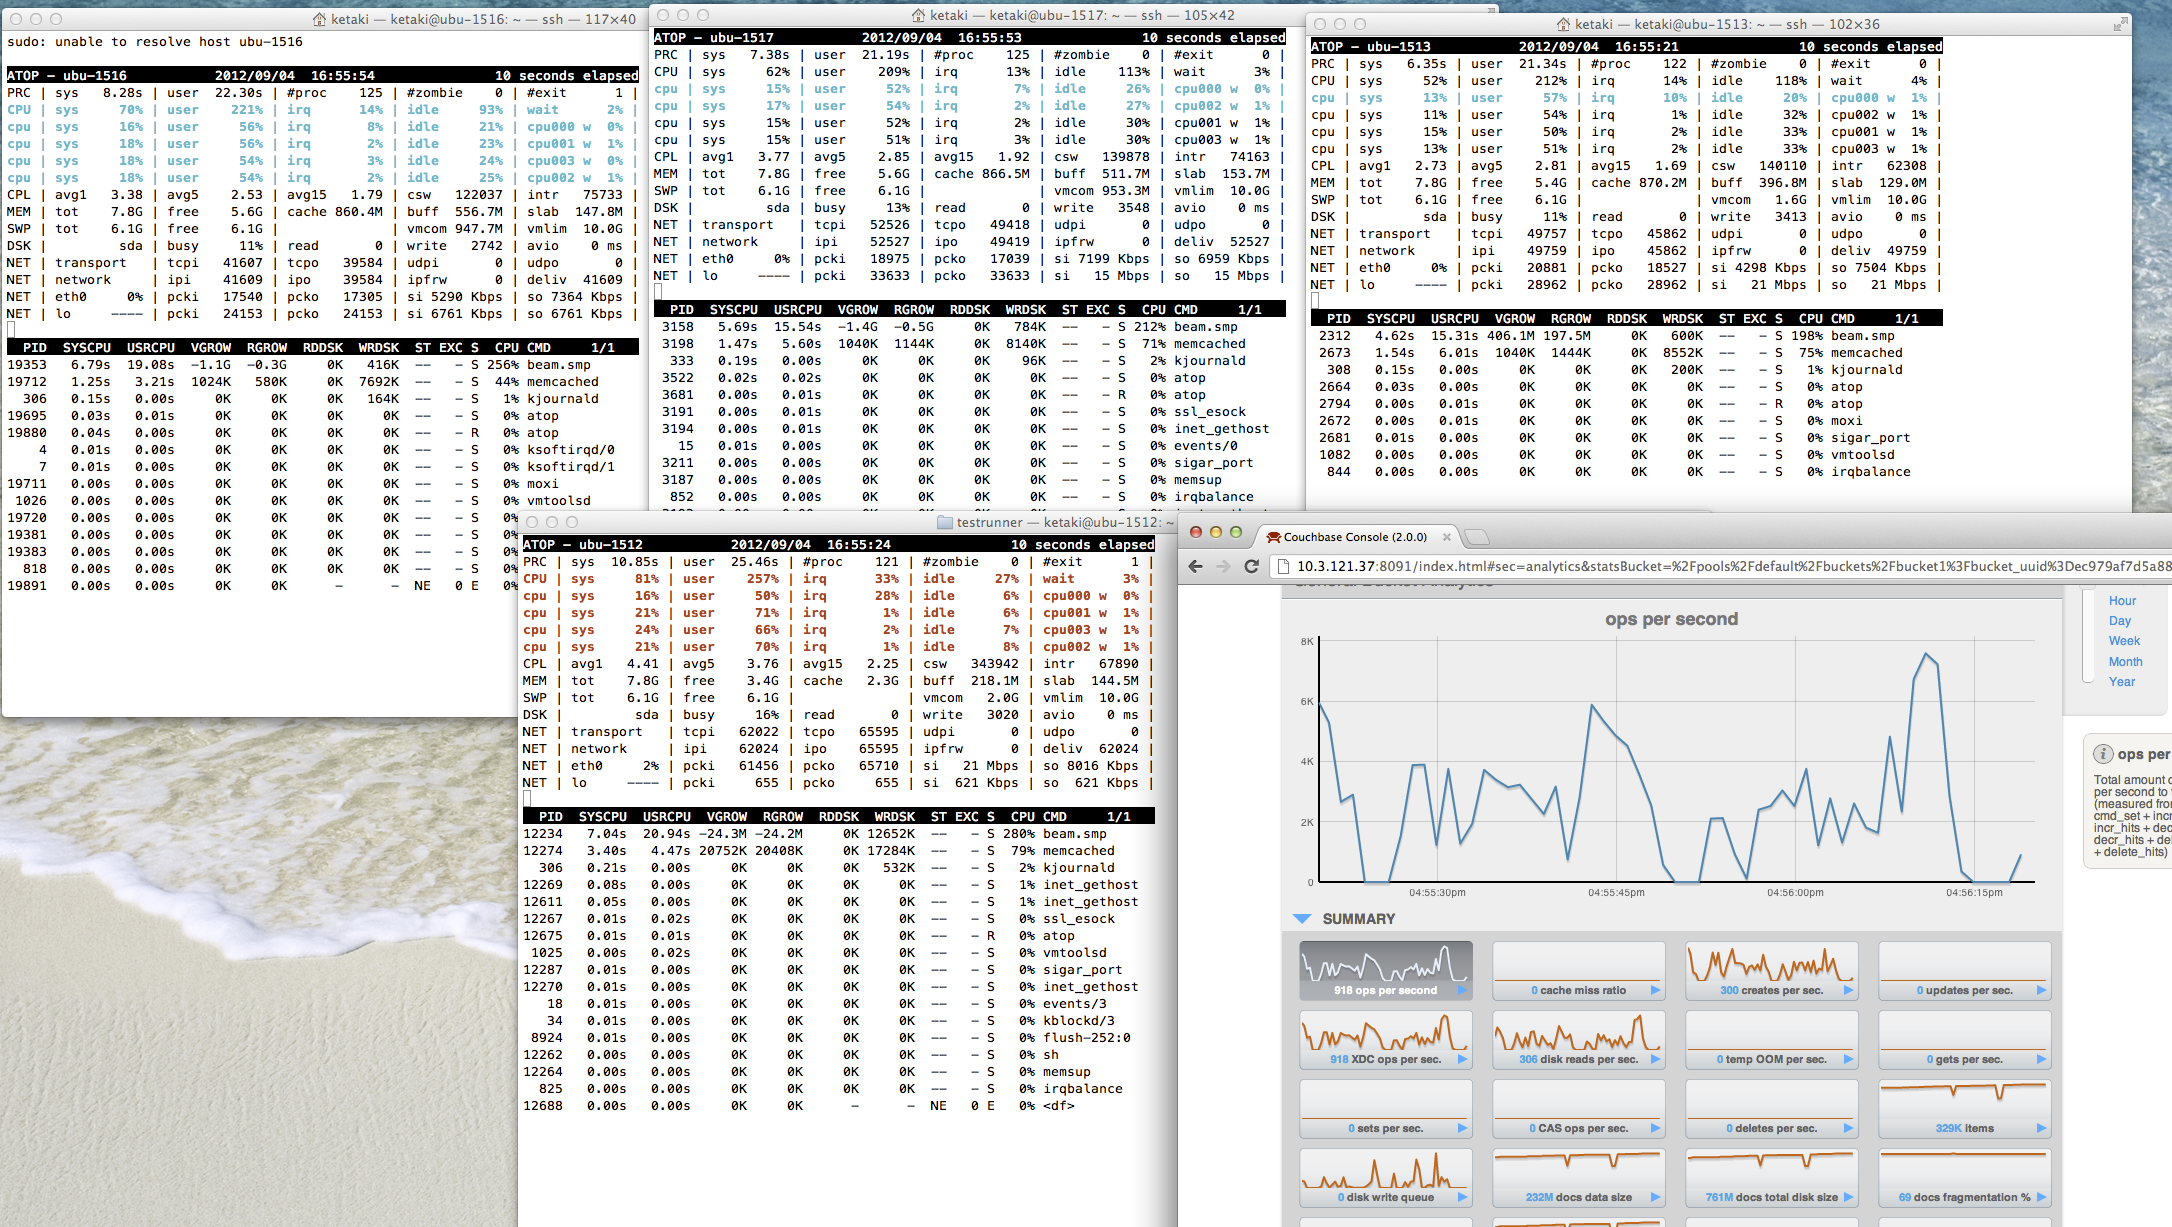
Adding screenshots from destination cluster.
Seeing a lot of ns_server timeouts on destination cluster.
ketaki@ubu-1516:/opt/couchbase/var/lib/couchbase/logs$ grep -A 20 "Reason for termination" debug.*
-
- Reason for termination ==
- {timeout,
Unknown macro: {gen_server,call,[ns_node_disco,nodes_actual_proper]}
}
[ns_server:debug,2012-09-04T14:17:35.541,ns_1@10.3.121.38:<0.9968.50>:ns_pubsub:do_subscribe_link:120]Started subscription
{ns_config_events_local,<0.9967.50>}[ns_server:debug,2012-09-04T14:17:35.543,ns_1@10.3.121.38:ns_config_rep:ns_config_rep:init:66]init pulling
[error_logger:error,2012-09-04T14:17:35.543,ns_1@10.3.121.38:error_logger:ale_error_logger_handler:log_report:72]
=========================CRASH REPORT=========================
crasher:
initial call: ns_config_rep:init/1
pid: <0.21491.39>
registered_name: ns_config_rep
exception exit: {timeout,
{gen_server,call,[ns_node_disco,nodes_actual_proper]}}
in function gen_server:terminate/6
ancestors: [ns_node_disco_sup,ns_server_sup,ns_server_cluster_sup,
<0.60.0>]
messages: []
links: [<0.338.0>,<0.21591.39>,<0.337.0>]
dictionary: [{random_seed,{15080,3474,10349}}]
trap_exit: false
Logs at https://s3.amazonaws.com/bugdb/jira/bug-rep/bug1.tar
live cluster at
Destination :10.3.121.38
Source : 10.3.121.31
Atop from nodes
node 38
---------------
PRC | sys 105m36s | user 221m40s | #proc 125 | #zombie 0 | #exit 0 |
CPU | sys 17% | user 45% | irq 5% | idle 332% | wait 0% |
cpu | sys 4% | user 11% | irq 1% | idle 83% | cpu000 w 0% |
cpu | sys 4% | user 11% | irq 1% | idle 83% | cpu001 w 0% |
cpu | sys 4% | user 11% | irq 1% | idle 83% | cpu002 w 0% |
cpu | sys 4% | user 11% | irq 1% | idle 84% | cpu003 w 0% |
CPL | avg1 2.54 | avg5 2.54 | avg15 2.58 | csw 113123e5 | intr 35839e5 |
MEM | tot 7.8G | free 4.6G | cache 1.4G | buff 554.0M | slab 150.0M |
SWP | tot 6.1G | free 6.1G | | vmcom 1.5G | vmlim 10.0G |
PAG | scan 5287e3 | stall 0 | | swin 2366 | swout 5420 |
DSK | sda | busy 1% | read 238357 | write 2774e4 | avio 0 ms |
NET | transport | tcpi 48211e5 | tcpo 47900e5 | udpi 14236 | udpo 14188 |
NET | network | ipi 482119e4 | ipo 479000e4 | ipfrw 0 | deliv 4821e6 |
NET | eth0 0% | pcki 93217e3 | pcko 61856e3 | si 317 Kbps | so 171 Kbps |
NET | lo ---- | pcki 47374e5 | pcko 47374e5 | si 5491 Kbps | so 5491 Kbps |
-
-
- system and process activity since boot ***
PID SYSCPU USRCPU VGROW RGROW RDDSK WRDSK ST EXC S CPU CMD 1/4
16898 64m08s 189m24s 1.2G 675.5M 0K 1.1G N- - S 1% beam.smp
16937 8m23s 18m34s 355.3M 193.6M 0K 540.8M N- - S 0% memcached
306 18m45s 0.01s 0K 0K 244K 4.3G N- - S 0% kjournald
1026 3m39s 10m32s 58596K 1748K 3596K 12K N- - S 0% vmtoolsd
1056 56.23s 2m24s 116.9M 37476K 25158K 2892K N- - S 0% chef-client
13 2m52s 0.00s 0K 0K 0K 0K N- - S 0% ksoftirqd/3
818 65.29s 14.69s 11284K 520K 12K 0K N- - S 0% irqbalance
4 61.40s 0.09s 0K 0K 0K 0K N- - S 0% ksoftirqd/0
10 56.29s 0.05s 0K 0K 0K 0K N- - S 0% ksoftirqd/2
7 56.22s 0.01s 0K 0K 0K 0K N- - S 0% ksoftirqd/1
- system and process activity since boot ***
-
node 37
-----------------------
ATOP - ubu-1517 2012/09/04 14:57:59 1295558 seconds elapsed
PRC | sys 99m37s | user 229m43s | #proc 119 | #zombie 0 | #exit 0 |
CPU | sys 10% | user 27% | irq 3% | idle 360% | wait 0% |
cpu | sys 3% | user 7% | irq 1% | idle 89% | cpu000 w 0% |
cpu | sys 2% | user 7% | irq 1% | idle 90% | cpu001 w 0% |
cpu | sys 2% | user 6% | irq 1% | idle 90% | cpu002 w 0% |
cpu | sys 2% | user 6% | irq 1% | idle 90% | cpu003 w 0% |
CPL | avg1 2.53 | avg5 2.53 | avg15 2.53 | csw 571182e4 | intr 19193e5 |
MEM | tot 7.8G | free 4.6G | cache 1.2G | buff 509.8M | slab 158.3M |
SWP | tot 6.1G | free 6.1G | | vmcom 1.7G | vmlim 10.0G |
PAG | scan 3066e3 | stall 0 | | swin 1300 | swout 3065 |
DSK | sda | busy 1% | read 167014 | write 2409e4 | avio 0 ms |
NET | transport | tcpi 23566e5 | tcpo 23357e5 | udpi 16918 | udpo 16870 |
NET | network | ipi 235665e4 | ipo 233568e4 | ipfrw 0 | deliv 2357e6 |
NET | eth0 0% | pcki 83889e3 | pcko 62117e3 | si 264 Kbps | so 180 Kbps |
NET | lo ---- | pcki 22821e5 | pcko 22821e5 | si 2974 Kbps | so 2974 Kbps |
-
-
- system and process activity since boot ***
PID SYSCPU USRCPU VGROW RGROW RDDSK WRDSK ST EXC S CPU CMD 1/4
1327 61m45s 198m15s 1.4G 938.6M 0K 753.2M N- - S 1% beam.smp
1577 10m03s 17m28s 362.4M 201.3M 0K 630.4M N- - S 0% memcached
333 18m22s 0.01s 0K 0K 64K 3.9G N- - S 0% kjournald
1046 3m22s 10m16s 58596K 2840K 3560K 12K N- - S 0% vmtoolsd
- system and process activity since boot ***
-
node 36
-----------------
ATOP - ubu-1513 2012/09/04 14:57:46 3625015 seconds elapsed
PRC | sys 245m23s | user 271m19s | #proc 118 | #zombie 0 | #exit 0 |
CPU | sys 6% | user 20% | irq 2% | idle 365% | wait 8% |
cpu | sys 2% | user 7% | irq 1% | idle 89% | cpu000 w 2% |
cpu | sys 1% | user 5% | irq 0% | idle 91% | cpu001 w 2% |
cpu | sys 1% | user 4% | irq 0% | idle 92% | cpu002 w 2% |
cpu | sys 1% | user 4% | irq 0% | idle 92% | cpu003 w 2% |
CPL | avg1 3.08 | avg5 2.81 | avg15 2.73 | csw 105677e5 | intr 33531e5 |
MEM | tot 7.8G | free 4.6G | cache 1.1G | buff 394.6M | slab 132.1M |
SWP | tot 6.1G | free 6.1G | | vmcom 2.0G | vmlim 10.0G |
PAG | scan 6740e4 | stall 0 | | swin 31498 | swout 120811 |
DSK | sda | busy 6% | read 8466589 | write 1182e5 | avio 1 ms |
NET | transport | tcpi 23712e5 | tcpo 23245e5 | udpi 22500 | udpo 22413 |
NET | network | ipi 237188e4 | ipo 232456e4 | ipfrw 0 | deliv 2372e6 |
NET | eth0 0% | pcki 36829e4 | pcko 34945e4 | si 382 Kbps | so 390 Kbps |
NET | lo ---- | pcki 20257e5 | pcko 20257e5 | si 2066 Kbps | so 2066 Kbps |
-
-
- system and process activity since boot ***
PID SYSCPU USRCPU VGROW RGROW RDDSK WRDSK ST EXC S CPU CMD 1/4
32016 72m48s 220m40s 1.8G 1.2G 0K 789.6M N- - S 0% beam.smp
308 129m54s 0.01s 0K 0K 392K 21.7G N- - S 0% kjournald
1082 9m52s 29m37s 68840K 1700K 120K 12K N- - S 0% vmtoolsd
32267 9m26s 17m00s 358.3M 196.4M 0K 599.2M N- - S 0% memcached
- system and process activity since boot ***
-