Details
-
Bug
-
Resolution: Fixed
-
Blocker
-
1.6.4
-
Security Level: Public
-
None
Description
I am running simple test on windows, load data very mildly (1 memcachetest thread) on the latest build.
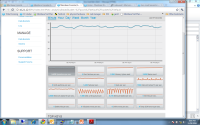
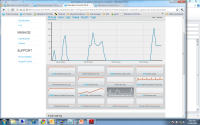
I see very long pauses (10-20 seconds), on the on the persist queue which cause the write queue to grow very fast even with this slow write rate. This almost smell as if the process is blocked by something. It was reproduced on windows fresh install on two separate physical machines.
This is not happening on Centos.
See attached screenshots from a Centos and windows fresh installation
here is more data from the windows machine, i don't see anything specific on it though.
[root@localhost ~]# /opt/membase/bin/ep_engine/management/stats 10.2.1.55:11210 dispatcher logs
dispatcher
runtime: 49s
state: dispatcher_running
status: running
task: Running a flusher loop.
Recent jobs:
runtime: 0
starttime: 2078
task: Paging out items.
---------
runtime: 0
starttime: 2080
task: Running a flusher loop.
---------
runtime: 0
starttime: 2082
task: Running a flusher loop.
---------
runtime: 0
starttime: 2084
task: Running a flusher loop.
---------
runtime: 0
starttime: 2085
task: Running a flusher loop.
---------
runtime: 0
starttime: 2087
task: Running a flusher loop.
---------
runtime: 0
starttime: 2089
task: Running a flusher loop.
---------
runtime: 0
starttime: 2089
task: Paging out items.
---------
runtime: 0
starttime: 2091
task: Running a flusher loop.
---------
runtime: 0
starttime: 2093
task: Running a flusher loop.
---------
runtime: 0
starttime: 2094
task: Running a flusher loop.
---------
runtime: 0
starttime: 2096
task: Running a flusher loop.
---------
runtime: 0
starttime: 2097
task: Running a flusher loop.
---------
runtime: 3s
starttime: 2102
task: Running a flusher loop.
---------
runtime: 0
starttime: 2102
task: Paging out items.
---------
runtime: 12s
starttime: 2116
task: Running a flusher loop.
---------
runtime: 0
starttime: 2116
task: Paging out items.
---------
runtime: 32s
starttime: 2150
task: Running a flusher loop.
---------
runtime: 0
starttime: 2150
task: Paging out items.
---------
runtime: 93ms
starttime: 2150
task: Updating stat snapshot on disk
---------
nio_dispatcher
state: dispatcher_running
status: idle
[root@localhost ~]# /opt/membase/bin/ep_engine/management/stats 10.2.1.55:11210 all | egrep "todo|cur|queue_size|mem|ejec|del"
curr_connections: 25
curr_items: 873089
curr_items_tot: 873089
delete_hits: 0
delete_misses: 0
ep_flusher_todo: 131979
ep_mem_high_wat: 4718592000
ep_mem_low_wat: 3774873600
ep_num_eject_failures: 0
ep_num_value_ejects: 0
ep_queue_size: 45140
ep_store_max_concurrency: 1
ep_total_del_items: 0
ep_vbucket_del: 0
ep_vbucket_del_fail: 0
mem_used: 985610107
rejected_conns: 0
[root@localhost ~]#
[root@localhost ~]# /opt/membase/bin/ep_engine/management/stats 10.2.1.55:11210 timings
disk_insert (29849 total)
0 - 1us : ( 99.11%) 29584 ############################################################################################################################################
8ms - 16ms : ( 99.79%) 201
16ms - 32ms : ( 99.80%) 3
65ms - 131ms : ( 99.83%) 10
131ms - 262ms : ( 99.93%) 29
262ms - 524ms : ( 99.99%) 20
524ms - 1s : (100.00%) 2
disk_update (2084 total)
0 - 1us : ( 99.47%) 2073 ##############################################################################################################################################
8ms - 16ms : ( 99.81%) 7
32ms - 65ms : ( 99.90%) 2
65ms - 131ms : ( 99.95%) 1
131ms - 262ms : (100.00%) 1
Attachments
Issue Links
- is duplicated by
-
MB-2508 disk persistence queue not draining
-
- Closed
-


